Licença
DOI: http://dx.doi.org/10.5007/1980-0037.2016v18n2p127
1 University of Campinas. School of Applied Sciences. Laboratory of Applied Sport Physiology. Limeira, SP. Brazil.
2 Federal University of Paraíba. Department of Physical Education. Joao Pessoa, PB. Brazil.
3 “Carlos de Campos” Technical School. Technical Course in Nutrition and Dietetics. São Paulo, SP. Brazil.
Received: 29 September 2015
Accepted: 20 December 2015
Somatotype, body composition and performance
in ultramarathon
Somatotipo, composição corporal e desempenho em
ultramaratona
Taisa Belli1
Cláudio Luiz de Souza Meireles2
Mônica de Oliveira Costa3
Marco Aurélio Ackermann1
Claudio Alexandre Gobatto1
Abstract – his study aimed to characterize somatotype, analyze anthropometric indicators associated with body composition during the race and verify possible relationships with the performance of athletes in a 217-km ultramarathon. For this, ten male volunteers (42.8 ± 3.5 years; 171.4 ± 1.9 cm height, 70.7 ± 3.1 kg body mass; 15 ± 3 years of run-ning exercise) performed a critical velocity (CV) test one week before the competition and were submitted to anthropometric measurements before, at 84 km of the race and at the end of the race. Volunteers inished the race in 46.8 ± 3.4 h (4.9 ± 0.4 km / h; 33.4 ± 1.8% CV). Mean values equivalent to somatotype components accounted for 3.4 ± 0.4 for endomorphy, 5.2 ± 0.4 for mesomorphy and 1.7 ± 0.3 for ectomorphy. Body mass, body mass index, fat-free mass and chest circumference decreased (P <0.05) after 84 and 217 km compared to baseline. Pre-race values of thigh skinfold thickness (R = 0.79) and waist circumference (R = 0.64) were signiicantly correlated (P <0.05) with
inal race time. hus, we concludedthat ultramarathoners had mean endo-mesomorph
somatotype and reductions in both body mass and fat-free mass during and after the race. Furthermore, the results suggest that increased body fat deposits concentrated in the lower limbs and abdominal region may have a negative impact on the performance of the athletes in 217-km ultramarathon.
Key words: Anthropometry; Body composition; Running; Athletic performance.
Anthropometry and performance in ultramarathon Belli et al.
INTRODUCTION
he morphological constitution of athletes involved in running depends on the distance to be covered. hus, larger fat stores can provide an important energy reservoir as well as increased muscle mass can be valuable to move on uneven grounds and surfaces of trails in ultramarathon events, char-acteristics that are not necessary and could even have a negative impact in running events involving shorter distances1.
However, although this assumption is relevant, to our knowledge, only one case study involving a participant in a 243 km foot race found that his physical constitution was characterized by a dominant mesomorph somato-type2. Somatotype is a parameter that expresses the morphological
constitu-tion of the individual in terms of body composiconstitu-tion and shape. It consists of three numeral values representative of components: endomorphy or adiposity, mesomorphy or musculoskeletal robustness and ectomorphy or linearity3.
In addition, an initial overview has been elucidated about the changes associated with body composition over 160-246 km ultramarathons. In this sense, while some studies have found body mass (BM) maintenance in ultramarathoners4-6, others found reduction in these values 7-9, accompanied
by a decrease in fat-free mass (FFM) and fat mass (FM)9.
Classically, identifying changes in BM provides one of the most simple and accurate indexes to assess hydration status during exercise10. However,
it seems that when a decrease in BM is observed in ultramarathon races, it probably does not occur only due to dehydration, but also due to the decrease in FFM and FM11.
It has recently been proposed that while strategies to minimize the energy cost of locomotion are essential for running events up to the distance of a marathon, minimizing tissue damage of the lower limbs is one of the cru-cial factors of performance in ultramarathon12, in addition to others such as
physical, environmental, psychological, motivational and tactical factors12-14.
In this regard, while for an elite marathon athlete to have large thighs dramatically increases internal work, for ultramarathoners, who exercise at a much lower running speeds, this anthropometric characteristic does not appear to be detrimental and may even be advantageous in terms of resistance to muscle damage12.
However, the results found in the current scientiic literature are still scarce and sometimes conlicting to support the premise that the speciic body composition proile of ultramarathoners may be associated with their performance in 160-350 km ultramarathon events15-17.
his study aimed to characterize somatotype, analyze anthropometric in-dicators associated with body composition during the race and verify possible relationships with the performance of athletes in a 217-km ultramarathon.
METHODOLOGICAL PROCEDURES
Volunteers and race description
the São Paulo State University (UNESP) (in 037/2008) and the informed consent form was signed by each athlete before participation in the study.
Table 1. Characteristics of volunteers (n = 10)
Age (years) 42.8 ± 3.5
Height (cm) 171.4 ± 1.9
Training history (years) 15 ± 3
Training volume (km/week) 118 ± 20
Participation in ultramarathons (n) 12 ± 6
Critical velocity (km/h) 13.5 ± 0.7
‘Brazil 135 Ultramarathon’ is a 217-km international ultramarathon (135 miles) held annually at Serra da Mantiqueira, southern state of Minas Gerais / Brazil. his race takes place on dirt roads in the heavier segment of the Brazilian pilgrimage trail called Caminho da Fé, and the total up-hill and downup-hill segments during the race has been estimated at 9.6 km and 10 km, respectively. hus, it is considered one of the toughest ultra-marathon events held in Brazil and athletes who are able to complete this competition achieve qualiication to perform ultramarathons renowned around the world. In that edition, the start took place in Poços de Caldas (1304 m altitude) at 08: 00 am and arrival in Paraisópolis (927m altitude) and runners who reached the inish line within 60 hours were considered inishers. he ambient temperature ranged from 08 to 30oC.
Experimental design
he critical velocity (CV) of athletes was determined one week before the competition. hen, in the afternoon before the start of the race, the volunteers at ive hours postprandial condition underwent initial evalu-ation, which consisted of anthropometric measurements and completing a demographic and training history questionnaire. Furthermore, anthro-pometric measurements were also performed in Serra dos Limas (84 km), an intermediate support point, and immediately after the race (217 km). hese were referred to as intermediate and inal evaluation, respectively. Race time was obtained from the oicial race reports. Volunteers were able to eat and drink ad libitum during the race.
Critical velocity
One week before the competition and in the following days, athletes individually performed four maximum races at diferent distances (800, 1200, 1600, 2000m) in a track, performed in random order. hus, the critical velocity was determined by the angular coeicient of the linear it of distance vs. running time18.
Anthropometric measurements
Anthropometry and performance in ultramarathon Belli et al.
clothing, body mass (kg) and height (cm) measurements were performed using a platform scale (Welmy®), with an accuracy of 0.1kg and 0.5cm, respectively. Skinfold thickness (chest, abdominal, thigh, suprailiac, subscapularis, triceps and calf) were measured using a caliper (Sanny®) with an accuracy of 1mm and the value recorded was the average of three consecutive measurements of each body region. Circumferences measures (cm) (chest, relaxed arm, lexed arm, umbilical waist, thigh and medial calf) were performed with lexible inextensible metal tape, with an accuracy of 0.1cm (Sanny®) and bone diameters (mm) (humeral biepicondyle and femoral bicondyle) were measured with the elbow and knee joints lexed to 90° and the caliper rods (Sanny®) at 45o in relation to them.
In intermediate (84 km) and inal evaluations (217 km), replicas were made of body mass, skinfold thickness (chest, abdominal and thigh) and girth (chest, relaxed arm, umbilical waist and legs) measurements.
A single experienced evaluator performed all anthropometric measure-ments on the right side of the body according to conventional techniques19.
Body mass index [kg.(m2)-1] (BMI) was calculated as body mass divided
by the squared height. Fat mass was estimated according to the equation of Stewart and Hannan20 for male athletes:
FM (g) = (331.5 x abdominal skinfold thickness (mm)) + (356.5 x thigh skinfold thickness (mm)) + (111.9 x body mass (kg)) - 9108
Fat percentage was then calculated as % BF = (FMx100) / BM and fat-free mass was calculated by subtracting fat mass from body mass. So-matotype was calculated from the initial assessment of body mass, height, skinfold thickness (suprailiac, subscapularis, triceps and calf), girth (lexed arm and medial calf) and diameters (humeral biepicondyle and femoral bicondyle)21 and somatochart was plotted using the somatotype 1.1 software
(Sweat Technologies® Australia).
Statistical analysis
Mean and standard error of the mean were calculated for all studied vari-ables. he normal distribution and homogeneity of the data were veriied by the Shapiro-Wilk and Levene´s tests, respectively. Analysis of vari-ance for repeated measures (ANOVA) was used to comparisons among assessment times, and the Greenhouse-Geisser correction was applied if sphericity violation has been appointed by the Mauchly test. Schefe post hoc was used when appropriate. Pearson correlation was used to test the relationship among variables. For all tests, signiicance level adopted was P <0.05 and the Statistic 7.0 software was used (STATSOFT, Tulsa, USA).
RESULTS
he volunteers’ race time corresponded to 14.4 ± 1.2h and 46.8 ± 3.4h and the average speed was 6.2 ± 0.5 km / h (43.2 ± 3.0% CV) and 4.9 ± 0.4 km / h (33.4 ± 1.8% CV) in 84 and 217 km, respectively.
Figure 1. Graphical representation of the somatotype (somatochart). The numerical sequence of points (diamonds) denotes the order of arrival of the volunteers in the race. Circle corresponds to the average Somatotype.
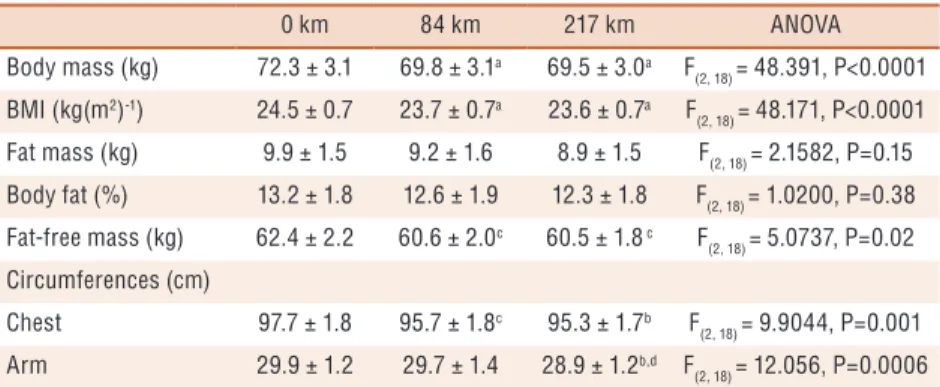
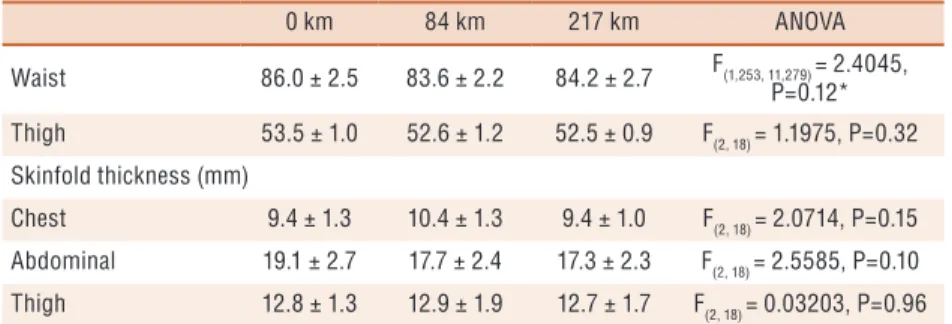
Anthropometric measurements at initial, intermediate and inal assess-ments are shown in Table 2. Signiicant diferences (ANOVA, P <0.05) were found for BM, BMI, FFM and chest circumference, with post hoc showing signiicant reductions (p <0.05) during and at the end of the race compared with initial values. Furthermore, signiicant decrease (P <0.05) in arm circumference was observed at the end of the race compared to values obtained in initial and intermediate evaluations. %BF, FM, waist and thigh circumference values, as well as chest, abdominal and thigh skinfold thick-ness measurements have not changed signiicantly over the race (P> 0.05). high skinfold thickness and waist circumference identiied before the race were positively correlated with the 217-km ultramarathon race time (P <0.05) (Figure 2).
Table 2. Anthropometric measurements at initial, intermediate and final assessments (n = 10)
0 km 84 km 217 km ANOVA
Body mass (kg) 72.3 ± 3.1 69.8 ± 3.1a 69.5 ± 3.0a F
(2, 18) = 48.391, P<0.0001 BMI (kg(m2)-1) 24.5 ± 0.7 23.7 ± 0.7a 23.6 ± 0.7a F
(2, 18) = 48.171, P<0.0001 Fat mass (kg) 9.9 ± 1.5 9.2 ± 1.6 8.9 ± 1.5 F(2, 18) = 2.1582, P=0.15
Body fat (%) 13.2 ± 1.8 12.6 ± 1.9 12.3 ± 1.8 F(2, 18) = 1.0200, P=0.38 Fat-free mass (kg) 62.4 ± 2.2 60.6 ± 2.0c 60.5 ± 1.8 c F
(2, 18) = 5.0737, P=0.02 Circumferences (cm)
Chest 97.7 ± 1.8 95.7 ± 1.8c 95.3 ± 1.7b F
(2, 18) = 9.9044, P=0.001
Arm 29.9 ± 1.2 29.7 ± 1.4 28.9 ± 1.2b,d F
Anthropometry and performance in ultramarathon Belli et al.
0 km 84 km 217 km ANOVA
Waist 86.0 ± 2.5 83.6 ± 2.2 84.2 ± 2.7 F(1,253, 11,279) = 2.4045, P=0.12*
Thigh 53.5 ± 1.0 52.6 ± 1.2 52.5 ± 0.9 F(2, 18) = 1.1975, P=0.32
Skinfold thickness (mm)
Chest 9.4 ± 1.3 10.4 ± 1.3 9.4 ± 1.0 F(2, 18) = 2.0714, P=0.15
Abdominal 19.1 ± 2.7 17.7 ± 2.4 17.3 ± 2.3 F(2, 18) = 2.5585, P=0.10
Thigh 12.8 ± 1.3 12.9 ± 1.9 12.7 ± 1.7 F(2, 18) = 0.03203, P=0.96
Post hoc: a: P< 0.00001, b: P<0.005, c: P<0.05 compared at 0 km; d:P<0.005 compared at 84 km * Greenhouse-Geisser correction applied if the sphericity violation was appointed by the Mauchly test. BMI= Body mass index
Figure 2. Correlation between race time and A) thigh skinfold thickness; B) waist circumference measured at baseline. Linear fit (solid line) and 95% confidence intervals (dotted line). The numerical sequence of points denotes the order of arrival of the volunteers in the race.
DISCUSSION
he main indings of this study were that athletes have in general somato-type classiied as endo-mesomorph and that body mass, body mass index, fat-free mass and chest and arm girth values were reduced during the race. Moreover, pre-race thigh skinfold thickness and waist circumference measurements were positively correlated with total race time.
To our knowledge, this is the irst study that evaluated somatotype in a sample of ultramarathon runners and the results presented here of dominant mesomorphy corroborate previous indings observed in a 243-km ultramarathoner2 and in triathletes22, 23.
In addition to a dominant musculoskeletal component, the present inves-tigation also showed higher adiposity than linearity in these athletes, since the endomorphic component was larger than the ectomorphic component. When considering these results together, they suggest that the morphological constitution of ultramarathoners may difer from that observed in marathon runners, that these body characteristics can be valuable for ultramarathon athletes moving over rough terrain, such as dirt roads, as well as for provide them an important energy substrate for longer running events1.
In relation to body composition identiied during the race, this study found that signiicant reductions in BM, BMI, FFM and chest
Moreover, although it has not reached statistical signiicance, reduced FM values were found at 84 km (- 7.0%) and at the end (- 9.7%) of the race.
Signiicant reduction in BM values has been previously observed in athletes after ‘Spartathlon’ (246 km)8, 24-h ultramarathon (~ 199km of
distance covered)7 and ‘Marathon des Sables’ (243 km)9. However, similar
results were found in participants of the ‘Western States Endurance Run’ (WSER) evaluated at 90 and 160 km4-6.
Establishing the possible reasons for these diferences in BM responses has not been possible to date because many factors can inluence the results such as volunteers of diferent age groups (40.3 ± 1.7 to 46.8 ± 2, than 1 year), initial BM (60.1 ± 8.3 to 72.3 ± 3.1 kg), sex (men only, or both), and diferent race times (24 to 46.8 ± 3.4 h), intensities (4.9 ± 0.4 to 8.3 ± 0.3 km/h) and hydration regimen (restricted or unrestricted) in these various competitions.
he results of this study corroborate the indings of Zouhal et al.9,
in which reduced BM was accompanied by reduced FFM and FM at 93 km and at the end of the ‘Marathon des Sables’, emphasizing that when reduced BM is observed in these races, it possibly does not occur solely due to dehydration11.
In this sense, we also observed that the percentage change in BM rep-resented on average -3.5% (-1.5 to -6.4%) in 84 km and -3.9% (-2.0 to -6.4 %) in 217 km, and the volunteer with the greatest reduction was the third fastest among those evaluated and ranked among the top 10 in the race.
he average reduction of 6.1% in BM values was observed after the ‘Marathon des Sables’, and the volunteer with the greatest reduction (-9.0%) was the fastest to inish the race (6th place) 9, and positive relationship
between BM reduction (-5.1 ± 2.6%) and performance was observed in 24-hour ultramarathon7. Furthermore, triathletes that exhibited dramatic
BM decrease (-10.7 to +3.7 %) during the ‘South African Ironman’ (224 km) were among the fastest to inish the race and this reduction was not associated with increased medical complications and rectal temperature24.
hus, reinforcing this set of previous results, our results also suggest that the classical assumptions to prevent dehydration during exercise based on BM reductions (i.e., to prevent dehydration, BM reductions must be less than 2% and discontinue exercise in case of BM reductions over 7%)25, 26 need to be properly reassessed in ultraendurance events9, 24.
he correlations observed in this study suggest that increased body fat deposits concentrated in the lower limbs and abdominal region, predicted by waist circumference27, may have a negative impact on ultramarathon
performance.
Interestingly, although Knetchle et al.16 did not observe a relationship
Anthropometry and performance in ultramarathon Belli et al.
circumference were positively related with time or negatively related with speed in races such as WSER (160 km)1, 17, ‘Marathon Des Sables’ (243 km)9
and ‘Isar Run’ (338 km)15.
CONCLUSION
We concluded that the average somatotype of ultramarathon runners was endo-mesomorph and BM, BMI, FFM and chest perimeter reductions have been observed in the irst 84 km of the race. Furthermore, we found that anthropometric characteristics associated with body composition such as higher thigh skinfold thickness and waist circumference values were as-sociated with lower performance of the athletes in 217-km ultramarathon in the mountains.
Acknowledgments
We would like to thank the volunteers, organizers and staf of the “Brazil 135 Ultramarathon”. We also would like to acknowledge Coordenação de Aperfeiçoamento de Pessoal de Nível Superior (CAPES), Conselho Nacional de Desenvolvimento Cientíico e Tecnológico (CNPq) (Proc. 305650/2009-2) and Fundação de Amparo à Pesquisa do Estado de São Paulo (FAPESP) (Proc. 2009/08535-5) for inancial support.
REFERENCES
1. Hofman MD. Anthropometric characteristics of ultramarathoners. Int J Sports
Med 2008; 29(10): 808-11.
2. Ryder JJ, Grantham NJ, Kellett DW, Mcnaughton L, Lovell R, Jones GE.
Mara-thon Des Sables: A Scientiic Case Study. Res Sports Med 2004; 12(1): 33-44.
3. Carter JE, Ackland TR, Kerr DA, Stapf A. Somatotype and size of elite female
basketball players. J Sports Sci 2005; 23(10):1057-63.
4. Nieman DC, Dumke CI, Henson DA, McAnulty SR, McAnulty LS, Lind RH,
et al. Immune and oxidative changes during and following the Western States Endurance Run. Int J Sports Med 2003; 24(7): 541-7.
5. Nieman DC, Dumke CL, Henson DA, McAnulty SR, Gross SJ, Lind RH.
Mus-cle damage is linked to cytokine changes following a 160-km race. Brain Behav Immun 2005; 19(5): 398-403.
6. Nieman DC, Henson DA, Dumke CL, Oley K, McAnulty SR, Davis JM, et al.
Ibuprofen use, endotoxemia, inlammation, and plasma cytokines during ultra-marathon competition. Brain Behav Immun 2006; 20(6): 578-84.
7. Kao WF, Shyu CL, Yang XW, Hsu TF, Chen JJ, Kao WC, et al. Athletic
perfor-mance and serial weight changes during 12- and 24-hour ultra-marathons. Clin J Sport Med 2008; 18(2): 155-8.
8. Skenderi KP, Kavouras SA, Anastasiou CA, Yiannakouris N, Matalas AL.
Exer-tional Rhabdomyolysis during a 246-km continuous running race. Med Sci Sports Exerc 2006; 38(6): 1054-7.
9. Zouhal H, Groussard C, Vincent S, Jacob C, Abderrahman AB, Delamarche P,
et al. Athletic performance and weight changes during the “Marathon of Sands” in athletes well-trained in endurance. Int J Sports Med 2009; 30(7): 516-21.
10. Armstrong LE. Assessing hydration status: the elusive gold standard. J Am Coll
CORRESPONDING AUTHOR
Claudio Alexandre Gobatto Universidade Estadual de Campinas. Faculdade de Ciências Aplicadas. Laboratório de Fisiologia Aplicada ao Esporte. Limeira, SP. Brasil. Rua Pedro Zaccaria, 1300 - Caixa Postal 1068, CEP 13484-350 Limeira, São Paulo, Brasil.
E-mail: claudio.gobatto@fca. unicamp.br
12. Millet GY, Hofman MD, Morin JB. Sacriicing economy to improve running
performance--a reality in the ultramarathon? J Appl Physiol 2012; 113(3): 507-9.
13. Hofman MD. Performance trends in 161-km ultramarathons. Int J Sports Med
2010; 31(1):31-7.
14. Wegelin JA, Hofman MD. Variables associated with odds of inishing and inish
time in a 161-km ultramarathon. Eur J Appl Physiol 2011; 111(1): 145-53.
15. Knechtle B, Duf B, Welzel U, Kohler G. Body mass and circumference of upper
arm are associated with race performance in ultraendurance runners in a multistage race--the Isarrun 2006. Res Q Exerc Sport 2009; 80(2):262-8.
16. Knechtle B, Knechtle P, Rosemann, T. Race performance in male mountain
ultra-marathoners: anthropometry or training? Percept Mot Skills 2010; 110(3 Pt 1): 721-35.
17. Hofman MD, Lebus DK, Ganong AC, Casazza GA, Van Loan M. Body
composi-tion of 161-km ultramarathoners. Int J Sports Med 2010; 31(2):106-9.
18. Kranenburg KJ, Smith DJ. Comparison of critical speed determined from track
run-ning and treadmill tests in elite runners. Med Sci Sports Exerc 1996; 28(5): 614-8.
19. Guedes DP, Guedes JERP, Manual prático para avaliação em educação física.
Barueri: Manole; 2006.
20. Stewart DA, Hannan WJ. Prediction of fat and fat-free mass in male athletes using
dual X-ray absorptiometry as the reference method. J Sports Sci 2000; 18(4): 263-74.
21. Heath BH, Carter, JE. A modiied somatotype method. Am J Phys Anthropol
1967; 27(1):57-74.
22. Anjos MAB, Fernandes Filho J, Novaes J.S. Características somatotípicas,
derma-toglíicas e isiológicas do atleta de triatlo. Fitness Perform J 2003; 2(1):49-57.
23. Leake CN, Carter JE. Comparison of body composition and somatotype of trained
female triathletes. J Sports Sci 1991; 9(2):125-35.
24. Sharwood KA, Collins M, Goedecke JH, Wilson G and Noakes, TD. Weight
changes, medical complications, and performance during an Ironman triathlon. Br J Sports Med 2004; 38(6):718-24.
25. Adolph, E.F.; Brown, A.H.; Goddard, D.R. Physiology of man in the desert. New
York: Interscience; 1947. p. 16–33, 226–241, 326–42.
26. Convertino VA, Armstrong LE, Coyle EF, Mack GW, Sawka MN, Senay LC
Jr., et al. American College of Sports Medicine position stand. Exercise and luid replacement. Med Sci Sports Exerc 1996; 28(1): i-vii.
27. Pouliot MC, Despres JP, Lemieux S, Moorjani S, Bouchard C, Tremblay A, et al.