A large 15 - year database analysis on the influence of age,
gender, race, obesity and income on hospitalization rates
due to stone disease
_______________________________________________
Marcos F. Mello
1, Giovanni Scala Marchini
1, Cesar Câmara
1, Alexandre Danilovic
1, Renata Levy
2,
José Eluf-Neto
2, Miguel Srougi
1, Eduardo Mazzucchi
11 Seção de Endourologia, Divisão de Urologia do Hospital das Clínicas da Universidade de São Paulo
Faculdade de Medicina de São Paulo, Brasil; 2 Departamento de Medicina Preventiva da Universidade de São Paulo Faculdade de Medicina de São Paulo, Brasil
ABSTRACT
ARTICLE
INFO
______________________________________________________________ ______________________
Purpose: To assess the public hospitalization rate due to stone disease in a large deve-loping nation for a 15-year period and its association with socio-demographic data. Materials and Methods: A retrospective database analysis of hospitalization rates in the Brazilian public health system was performed, searching for records with a diagno-sis code of renal/ureteral calculi at admission between 1998-2012. Patients managed in an outpatient basis or private care were excluded. Socio-demographic data was attained and a temporal trend analysis was performed.
Results: The number of stone-related hospitalizations increased from 15.7%, although the population-adjusted hospitalization rate remained constant in 0.04%. Male:female proportion among hospitalized patients was stable (49.3%:50.7% in 1998; 49.2%:50.8% in 2012), though there was a significant reduction in the prevalence of male hospita-lizations (-3.8%;p=0.041). In 2012, 38% of hospitalized patients due to stone disease had 40-59 years-old. The ≥80 years-old strata showed the most significant decrease (-43.44%;p=0.022), followed by the 20-39 (-23.17%;p<0.001) and 0-19 years-old co-horts (-16.73%;p=0.012). Overall, the lowest relative hospitalization rates were found for yellow and indigenous individuals. The number of overweight/obese individuals increased significantly (+20.6%), accompanied by a +43.6% augment in the per ca-pita income. A significant correlation was found only between income and obesity (R=0.64;p=0.017).
Conclusions: The prevalence of stone disease requiring hospitalization in Brazil re-mains stable, with a balanced proportion between males and females. There is trend for decreased hospitalization rates of male, <40 and ≥80 years-old individuals. Obesity and income have a more pronounced correlation with each other than with stone disease.
Keywords:
Disease; Calculi; Ureter; Kidney Calculi; Urolithiasis
Int Braz J Urol. 2016; 42: 1150-9
_____________________
Submitted for publication: December 24, 2015
_____________________
Accepted after revision: April 05, 2016
_____________________
Published as Ahead of Print: August 11, 2016
INTRODUCTION
Urinary stone disease is a common di-sorder, which distresses the economically acti-ve population. In the United States of America
(USA), urolithiasis was reported to affect 1.116 per 100.000 18 to 64-year-old employees covered by two large insurance carriers in the year 2000 (1-4).
ultimately leading to hospitalization. International epidemiological data suggest that the incidence and prevalence of stone disease are increasing (1-4). The probability of developing kidney stones varies according to numerous factors including age, gender, race, geographic location and body mass index (BMI). In addition, a change in the gender and age distribution of stone formers over time has been described, with an increasing participation of females and older individuals (5-7). This highlights the importance of better understanding current regional hospitalization rates in order to work on stone prevention and treatment strategies. Unfortunately, current population-based data on the frequency of kidney stone episodes in Latin nations are limited and studies describing recent national time trends are lacking.
The goals of the present study are to assess the rate of hospitalizations due to upper urinary tract calculi in Brazil over the past 15 years and to evaluate the influence of gender, age, race, in-come, obesity and geographic residence on uroli-thiasis trends.
MATERIALS AND METHODS
National Background
Brazil comprises a 8.5 billion-km2 area. According to Brazilian Institute of Geography and Statistics (Instituto Brasileiro de Geografia e Esta-tística-IBGE), the national population has reached more than 200 million people in 2014 (9). The Public Health System of Brazil, named Sistema Único de Saúde (SUS), supposedly provides health coverage for all citizens of the country. Recent data has sho-wn approximately 47%-74% of residents truly uses resources from SUS and not from private care (10).
Study Design and Data Source
A retrospective, population-based, cross--sectional time series analysis was performed using data derived from an administrative data-base of the Brazilian Public Health System (SUS).
Public Health System has a longitudinal hospital inpatient database (Sistema de Informa-ção Hospitalar-SIH/SUS), which contains records from discharges for all cities and regions of the
country (11). Each discharge includes up to five inpatient diagnoses per hospitalization. All diag-noses are coded using the International Classifi-cation of Disease (9th revision, ICD-9 until De-cember 1997; 10th revision, ICD-10 since January 1998). Patient and socio-demographic characte-ristics included are gender, race, age, ZIP code of residence, and income.
The Consumer Expenditure Survey (Pes-quisa de Orçamento Familiar-POF), the demogra-phic census, and the national research by hou-sehold sample (Pesquisa Nacional por Amostra de Domicílios-PNAD), all conducted by IBGE, aims to portray the Brazilian Population. Body mass index (BMI) data of the Brazilian population was extrac-ted from the POF, which has been performed in two periods: 2002-2003 and 2008-2009. Income per capita data was extracted from PNAD and the demographic census, the latest one being perfor-med in 2010 (12).
Database Analysis
Hospital discharges between January 1st/1998 and December 31st/2012 were abstracted
from the SIH/SUS. In 2012, Public Health System hospitals had around 326 thousand beds. All inpa-tient hospitalizations in the 15-year period for patients of any age with a primary or seconda-ry diagnosis code of N20.x (calculus of kidney or ureter) were abstracted. Only patients with urete-ral or renal stones were considered in the analysis. The absolute number of inpatient hospitali-zations due to stone disease per year was analyzed nationally and also separately for the five distin-guish regions of the country, named South, Southe-ast, Midwest, North, and Northeast regions. Absolu-te numbers were also adjusAbsolu-ted for local population to provide a prevalence perspective. Patients ma-naged in an outpatient basis or those from private care were not considered in the analysis.
≥80 years-old). Income was reported as national and regional income per capita per year. In regar-ds to BMI, individuals were divided into 2 groups: normal if BMI<25Kg/m2; overweight and obese if
BMI≥25Kg/m2).
Statistical analysis
Statistical analysis was performed using SPSS V.19 (Chicago, IL). Qualitative variables were presented as absolute numbers and relative frequencies at each time point. Percent variation from study beginning to end was also contempla-ted. Quantitative variables were analyzed in terms of temporal trends: prevalence trends over the 15-year period were quantified by the estimated an-nual percent change (EAPC) using the least squa-res linear regsqua-ression methodology (13). The linear
regression model considered a 95% confidence in-terval with a regression coefficient. A Spearman’s correlation test was performed to seek for asso-ciations between hospitalization rate, obesity, and income. Significance level was p<0.05.
RESULTS
Hospitalization Trends
The absolute number of stone-related hospi-talizations increased from 58165 in 1998 to 67306 in 2012, accounting for a 15.7% increase in Brazil. However, the prevalence of hospitalizations adjus-ted for the Brazilian population remained constant in 0.04% (Table-1; Figure-1A). All regions presented a non-significant increase in the absolute number of hospitalizations (Table-1A), which was not sustained when adjusted for the local population (Table-1B).
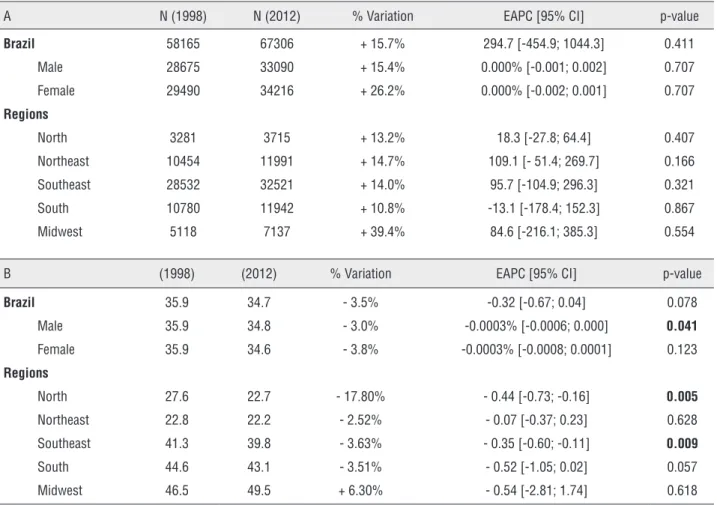
Table 1 - Temporal trends for absolute number (A) and prevalence (B) (adjusted to the population x 100.000 people) of stone-related hospitalizations in Brazil and all five regions between 1998 and 2012.
A N (1998) N (2012) % Variation EAPC [95% CI] p-value
Brazil 58165 67306 + 15.7% 294.7 [-454.9; 1044.3] 0.411
Male 28675 33090 + 15.4% 0.000% [-0.001; 0.002] 0.707
Female 29490 34216 + 26.2% 0.000% [-0.002; 0.001] 0.707
Regions
North 3281 3715 + 13.2% 18.3 [-27.8; 64.4] 0.407
Northeast 10454 11991 + 14.7% 109.1 [- 51.4; 269.7] 0.166
Southeast 28532 32521 + 14.0% 95.7 [-104.9; 296.3] 0.321
South 10780 11942 + 10.8% -13.1 [-178.4; 152.3] 0.867
Midwest 5118 7137 + 39.4% 84.6 [-216.1; 385.3] 0.554
B (1998) (2012) % Variation EAPC [95% CI] p-value
Brazil 35.9 34.7 - 3.5% -0.32 [-0.67; 0.04] 0.078
Male 35.9 34.8 - 3.0% -0.0003% [-0.0006; 0.000] 0.041
Female 35.9 34.6 - 3.8% -0.0003% [-0.0008; 0.0001] 0.123
Regions
North 27.6 22.7 - 17.80% - 0.44 [-0.73; -0.16] 0.005
Northeast 22.8 22.2 - 2.52% - 0.07 [-0.37; 0.23] 0.628
Southeast 41.3 39.8 - 3.63% - 0.35 [-0.60; -0.11] 0.009
South 44.6 43.1 - 3.51% - 0.52 [-1.05; 0.02] 0.057
Figure 1 - Number and Proportion of Hospitalizations in Brazil and all five regions, with % of obesity and Income Analysis.
A-Brazil
C-Northeast
E-South F-Midwest
B-North
D-Southeast 1998 1999 2000 2001 2002 2003 2004 2005 2006 2007 2008 2009 2010 2011 2012
1998 1999 2000 2001 2002 2003 2004 2005 2006 2007 2008 2009 2010 2011 2012
1998 1999 2000 2001 2002 2003 2004 2005 2006 2007 2008 2009 2010 2011 2012
1998 1999 2000 2001 2002 2003 2004 2005 2006 2007 2008 2009 2010 2011 2012
1998 1999 2000 2001 2002 2003 2004 2005 2006 2007 2008 2009 2010 2011 2012 1998 1999 2000 2001 2002 2003 2004 2005 2006 2007 2008 2009 2010 2011 2012
% Obesity (left scalo)
Income per Capita (R$+10) (right scale) Stone Prevalence (X100) (right scale) N Stone Hospitalizations (+1.000) (right scale)
% Obesity (left scalo)
Income per Capita (R$+10) (right scale) Stone Prevalence (X100) (right scale) N Stone Hospitalizations (+1.000) (right scale)
% Obesity (left scalo)
Income per Capita (R$+10) (right scale) Stone Prevalence (X100) (right scale) N Stone Hospitalizations (+1.000) (right scale)
% Obesity (left scalo)
Income per Capita (R$+10) (right scale) Stone Prevalence (X100) (right scale) N Stone Hospitalizations (+1.000) (right scale)
% Obesity (left scalo)
Income per Capita (R$+10) (right scale) Stone Prevalence (X100) (right scale) N Stone Hospitalizations (+1.000) (right scale) % Obesity (left scalo)
Income per Capita (R$+10) (right scale) Stone Prevalence (X100) (right scale) N Stone Hospitalizations (+1.000) (right scale)
100
75
50
25
0
40
30
20
10
0 100
75
50
25
0
20
15
10
5
0 40
30
20
10
0 100
75
50
25
0 50
37,5
25
12,5
0
15
11,25
7,5
3,75
0
15
11,25
7,5
3,75
0 50
37,5
25
12,5
0 17
12,75
8,5
4,25
0
90
67,5
45
22,5
The Midwest region had the highest hospi-talization prevalence (0.05% in 1998 and 2012) and the highest progression rate, although non--significant (+6.2%; p=0.61; Figure-1F). The Northeast region showed the lowest hospitali-zation rate (0.02% in 1998 and 2012), which re-mained stable (-2.5%; p=0.62; Figure-1C). The only two regions with a significant change in time trends for hospitalization rates were the North (-17.8%; p=0.005) and the Southeast re-gion (-3.63%; p=0.009), both with significant decreases (Table-1B).
Gender Analysis
Male:female proportion among hospitali-zed patients was relatively stable in Brazil, with 49.3%:50.7% in 1998 and 49.2%:50.8% in 2012 (Figure-2A). The increase in the absolute num-ber of hospitalizations for men (+15.4%) and women (26.2%) showed no significant estimated annual percent change (p non-significant) (Table--1A). However, there was a significant reduction in the prevalence of male hospitalizations in the analyzed period (-3.8%; p=0.041) (Table-1B).
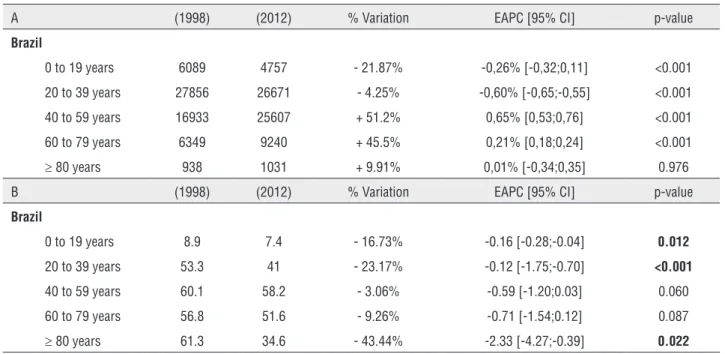
Age Temporal Changes
In 2012, the prevalence of hospitaliza-tions due to stone disease in the Brazilian po-pulation stratified by popo-pulation age was 7.1% from 0-19 years; 39.6% 20-39 years; 38.0% 40-59 years; 13.7% 60-79 years; and 1.5% ≥80 years (Figure-2B).
In absolute numbers, both 0-19 and 20-39 years-old strata presented a significant de-crease with a negative EAPC (p<0.001), while 40-79 years-old individuals had a significant increase (p<0.001) (Table-2A). In discordance, all age strata showed a decrease in the pre-valence of stone-related hospitalization rates between 1998 and 2012. However, temporal trend analysis revealed a stable situation for the 40-59 (-3.06%; p=0.06) and 60-79 years--old groups (-9.26%; p=0.087). The ≥80 years--old strata showed the most significant decre-ase (-43.44%; p=0.022), followed by the 20-39 old (-23.17%; p<0.001) and 0-19 years--old cohorts (-16.73%; p=0.012) (Table-2B).
Ethnicity Evaluation
There were no records of hospitalization by race until 2009 and no time-trend analysis could be performed. The distribution by race in 2012 was 43.4% white; 2.2% black; 22.1% brown; 0.5% yellow; 0.03% indigenous and 31.8% with no information (Figure-2C).
In 2012, the distribution by race showed two patterns: in the North, Northeast and Midwest regions, brown citizens were the most common among those hospitalized due to stone disease (55.8%, 35.2%, 32.1%, respectively). In the Sou-theast and South regions, there was a predominan-ce of Caucasians (54.1% and 76.9%, respectively). There were high percentages of missing records (no information) in all regions. Overall, the lo-west relative hospitalization rates were found for yellow and indigenous individuals (Figure-2C).
Obesity, Income and Hospitalization Correlation The number of overweight and obese in-dividuals increased significantly (+20.6%) (Table--3A) and was accompanied by a +43.61% augment in the per capita income (Table-3B). The correla-tion of hospitalizacorrela-tion rate with income (R=-0.36; p=0.22) and obesity rate (R=-0.42; p=0.11) was not significant. Conversely, a positive significant correlation was found between income and obe-sity (R=0.64; p=0.017) (Figure-1). Table-3 shows overweight prevalence and income per capita for Brazil and all five regions.
The North region showed the highest in-crease in the proportion of overweight people (+32.8%; 35.0% in 2003 and 46.5% in 2009) and the lowest increase on income per capita (+27.8%; US$199.29 in 1998 and US$152.67 in 2010) (Ta-ble-3). Surprisingly, there was a decrease in the incidence of hospitalization by stone disease (-17.8%; p=0.005) (Table-1B).
In Northeast region, there was an increase in relative number of overweight people (+22.5%; 35.5% in 2003 and 43.5% in 2009) and also in the income per capita (+58.4%; US$89.22 in 1998 and US$141.31 in 2010) (Table-3). Hospitalization remained stable (-2.52%; p=0.628) (Table-1B).
Figure 2 - Gender (A) and Age (B) distribution among patients hospitalized due to stone disease in Brazil from 1998 to 2012; Ethnicity (C) distribution of hospitalizations for different Brazilian regions in 2012.
1998
1998 1999
1999 2000
2000 2001
2001 2002
2002 2003
2003 2004
2004 2005
2005 2006
2006 2007
2007 2008
2008 2009
2009 2010
2010 2011
2011 2012
2012
Prev Male (left scale) Prev Female (left scale)
N Male (right scale) N Female (right scale)
North Northeast Southeast South Midwest Brazil White
Brown Indigenous
Black Yellow No Information
Absolute Number (n)
Absolute Number (n)
Prevalence (x100.000)
Prevalence (x100.000)
50
37,5
25
12,5
0
44000
33000
22000
11000
0
40000
30000
20000
10000
0
100
75
50
25
0
80%
60%
40%
20%
0%
prev<19yo (left scale) prev 20-39yo (left scale) prev 40-59yo (right scale) prev 60-79yo (left scale) prev≥80yo (right scale)
Table 2 – Temporal trends for absolute number (A) and prevalence (B) (adjusted to the population x 100.000 people) of stone-related hospitalizations in Brazil between 1998 and 2012 according to age strata.
A (1998) (2012) % Variation EAPC [95% CI] p-value
Brazil
0 to 19 years 6089 4757 - 21.87% -0,26% [-0,32;0,11] <0.001
20 to 39 years 27856 26671 - 4.25% -0,60% [-0,65;-0,55] <0.001
40 to 59 years 16933 25607 + 51.2% 0,65% [0,53;0,76] <0.001
60 to 79 years 6349 9240 + 45.5% 0,21% [0,18;0,24] <0.001
≥ 80 years 938 1031 + 9.91% 0,01% [-0,34;0,35] 0.976
B (1998) (2012) % Variation EAPC [95% CI] p-value
Brazil
0 to 19 years 8.9 7.4 - 16.73% -0.16 [-0.28;-0.04] 0.012
20 to 39 years 53.3 41 - 23.17% -0.12 [-1.75;-0.70] <0.001
40 to 59 years 60.1 58.2 - 3.06% -0.59 [-1.20;0.03] 0.060
60 to 79 years 56.8 51.6 - 9.26% -0.71 [-1.54;0.12] 0.087
≥ 80 years 61.3 34.6 - 43.44% -2.33 [-4.27;-0.39] 0.022
Table 3 – Temporal variation of overweight prevalence (A) and income per capita (B) in Brazil.
A
People overweight % (2003) % (2012) % Variation
Brazil 40.2 % 48.5% + 20.6%
Regions
North 35.0% 46.5% + 32.8%
Northeast 35.5% 43.5% + 22.5%
Southeast 42.2% 49.0% + 16.1%
South 44.6% 52.3% + 17.3%
Midwest 39.9% 47.5% + 19.0%
B
Income per capita US$ (1998) US$ (2010) % Variation
Brazil 164.72 237.00 + 43.6%
Regions
North 119.29 152.67 + 27.8%
Northeast 89.22 141.31 + 58.4%
Southeast 210.73 291.05 + 38.2%
South 184.16 283.82 + 54.2%
overweight individuals (+16.1%; 42.2% in 2003 and 49.0% in 2009) and in the income per capi-ta (+38.2%; US$210.73 in 1998 and US$291.05 in 2010) (Table-3).
In the South region, there was a rela-tive increase in total number of overweight people (+17.3%; 44.6% in 2003 and 52.3% in 2009) and in the income per capita (+54.2%; US$184.16 in 1998 and US$283.82 in 2010; Table-3), with stable rates oh hospitalization (-3.51%; p=0.057) (Table-1B).
In the Midwest region, there was a rela-tive increase in the number of overweight ci-tizens (+19.0%; 39.9% in 2003 and 47.5% in 2009) and in the income per capita (+58.2%; US$182.54 in 1998 and US$288.41 in 2010; Table-3). In parallel, hospitalization increased (+6.3%; p=0.618) (Table-1B).
DISCUSSION
The importance of prevention is highli-ghted in an era of stone disease prevalence growth worldwide. Factors that may play a role in the in-creasing risk of kidney stone disease include sunli-ght and heat, dietary consumption of animal pro-tein, salt and water, and certain clinical conditions like obesity. After mapping the present scenario, better policies and actions might be commenced to improve prevention. However, a standardized analysis of hospitalizations due to stone disease has never been made in Brazil. Our study tries to somehow depict the national scenario.
A number of studies have shown that the lifetime prevalence of kidney stones among adults increased significantly in the past years. The Na-tional Health and Nutrition Examination Survey showed a significant 37% increase in the preva-lence of stone disease in the American population between 1976-1980 and 1988-1994 (1). Benjamin et al. used the Hospital Episode Statistics (HES) to evaluate national trends in the UK between 2000 and 2010 and found similar trends, the number of upper urinary tract stone hospital episodes in-creased by 63% (4). In the other hand, Ghani et al. studied the US Nationwide Inpatient Sample in the period of 1999-2009 and found that the total number of hospitalizations for upper urinary
tract calculi was found relatively stable (181 592 in 1999 vs. 190 040 in 2009, EAPC 0.07%, P=0.83, 95% CI: -0.53-0.68%) (6). Importantly, their rese-arch does not account for patients treated in an outpatient basis, a common practice in the USA.
In the period studied (1998-2012), the ab-solute number of inpatient stone-related episodes increased 15.7% in Brazil (14). However, the pre-valence of hospitalizations remained almost sta-ble. This is in disagreement with the world litera-ture (1-4). Possible explanations could rely in the fact that in an economic growth scenario, more people are gaining access to private care treat-ment and not using the public health system. In addiction, a combined analysis of stone disease treatment including inpatient and ambulatory ca-ses could show different results. Unfortunately, we do not have in Brazil a comprehensive private and outpatient database to address this matter.
The prevalence of stone disease increases with age and is relatively uncommon before 20 years-old. However, the incidence increases rapi-dly and peaks from ages 40 to 60 years and then decreases from ages 65 years and thereafter (2). We found that all age strata presented a signifi-cant decrease in hospitalization prevalence, with the exception of 40-59 and 60-79 years-old popu-lations. In other words, while young individuals are less hospitalized, older ones have stable rates of hospitalization. This could be a result of the direct or indirect influence of obesity, metabolic syndrome and diabetes mellitus.
risk was up to 2.09 times higher than in normal weight women. In their study, body mass, weight gain in adulthood, and waist circumference were associated with an increased risk of incident sto-nes. Women were at a higher risk for stone disease than men for all of these risk factors. In our inves-tigation, a significant correlation was only found between stone episodes and income per capita. No association between obesity and stone disease prevalence could be found. Again, the analysis of private care could alter these findings.
Historically, men have been more likely to develop urinary calculi with an incidence and prevalence of up to 2–4 times greater than that for women (16, 17). In the present study, women and men had similar proportion in regards to hos-pitalization due to upper urinary tract calculi. In accordance to literature data, although we found a non-significant increase in the absolute number of male (+15.4%) and female (+26.2%) hospitali-zations, there was a significant reduction in the prevalence of male hospitalization rates (-3.8%; p=0.041). Scales et al. showed that the ratio of males to females treated as inpatients for stone disease changed from 1.7:1 in 1997 to 1.3:1 in 2002 (5). Based on self-reports of stone disease, Stamatelou et al. showed a larger increase in wo-men rates than in wo-men between 1976 and 1994 (1). Mean average temperature is believed to be a major contributor to variation in geogra-phic risk for stone disease, since higher average temperatures and greater sun exposure could result in oversaturation of stone-forming salts in the urine. In our study, however, the sun-nier and heater regions (North and Northeast) showed the lowest hospitalization rates. Those two regions are also the poorer regions of the country and this finding could reflect the di-fficulty in access to health coverage. The most developed regions of Brazil (South, Southeast) showed the highest hospitalization rates due to stone disease. In addition, individuals living in developed areas have a different lifestyle of pe-ople living in underdeveloped areas and they tend to feed on processed food and to be more sedentary. Thus, the explanation for the geogra-phic variation in kidney stone risk is probably multifactorial in our country.
Potential limitations to our study must be stressed. SIH/SUS is a snapshot of a patient’s admis-sion and the study does not distinguish patients who may have had multiple admissions for the same or a new calculus episode. Patients discharged from the emergency room, those undergoing outpatient tre-atments or those who are managed in the supple-mentary system are not captured. Also, the database used does not distinguish elective from emergency hospitalizations and the accuracy of coding for pro-cedures is unclear. Between 1998 and 2012, extra corporeal shock-wave lithotripsy had a significant relative increase (+338%) what may have lead to a decrease of number of hospitalization, since SWL can be performed in and outpatient basis (14). Ano-ther drawback was that in 2008 a new form of regis-ter for hospitalizations was implemented, leading to a potential coding bias. Lastly, the nature of the da-taset does not allow the true capturing of risk factors and we can only hypothesize on causality. Impor-tantly, this is not a phenomenon exclusive of Brazil. Our analysis included all inpatient hospitalizations for stone disease performed in SUS in the analyzed period and provided an accurate picture of local and regional stone disease tendencies.
CONCLUSIONS
The prevalence of stone disease requiring hospitalization in Brazil remains stable, with a balanced proportion between males and females. There is trend for decreased hospitalization rates of male, <40 and ≥80 years-old individuals. Obe-sity and income have a more pronounced correla-tion with each other than with stone disease.
CONFLICT OF INTEREST
None declared.
REFERENCES
1. Stamatelou KK, Francis ME, Jones CA, Nyberg LM, Curhan GC. Time trends in reported prevalence of kidney stones in the United States: 1976-1994. Kidney Int. 2003;63:1817-23. 2. Romero V, Akpinar H, Assimos DG. Kidney stones: a global
3. Scales CD Jr, Smith AC, Hanley JM, Saigal CS; Urologic Diseases in America Project. Prevalence of kidney stones in the United States. Eur Urol. 2012;62:160-5.
4. Turney BW, Reynard JM, Noble JG, Keoghane SR. Trends in urological stone disease. BJU Int. 2012;109:1082-7. 5. Scales CD Jr, Curtis LH, Norris RD, Springhart WP, Sur RL,
Schulman KA, et al. Changing gender prevalence of stone disease. J Urol. 2007;177:979-82.
6. Ghani KR, Sammon JD, Karakiewicz PI, Sun M, Bhojani N, Sukumar S, et al. Trends in surgery for upper urinary tract calculi in the USA using the Nationwide Inpatient Sample: 1999-2009. BJU Int. 2013;112:224-30.
7. Strope SA, Wolf JS Jr, Hollenbeck BK. Changes in gender distribution of urinary stone disease. Urology. 2010;75:543-6. 8. Saigal CS, Joyce G, Timilsina AR; Urologic Diseases in
America Project. Direct and indirect costs of nephrolithiasis in an employed population: opportunity for disease management? Kidney Int. 2005;68:1808-14.
9. IBGE (2014) Brazilian Institute of Geography and Statistics; available at: http://www.ibge.gov.br/home/estatistica/ populacao/estimativa2014/
10. Porto SM, Ugá MA, Moreira Rda S. [An analysis of use of the health services by financing system: Brazil 1998-2008]. Cien Saude Colet. 2011;16:3795-806.
11. SIH/SUS (2012) Hospital Information System of Public Health System of Brazil. Available at: http://www2.datasus. gov.br/DATASUS/index.php?area=0202
12. POF (2014) Consumer Expenditure Survey from Brazilian Institute of Geography and Statistics; 2002-2003 and 2008-2009: Available at: http://www.ibge.gov.br/home/xml/ pof_2002_2003.shtm and http://www.ibge.gov.br/home/ xml/pof_2008_2009.shtm
13. Anderson WF, Camargo MC, Fraumeni JF Jr, Correa P, Rosenberg PS, Rabkin CS. Age-specific trends in incidence of noncardia gastric cancer in US adults. JAMA. 2010;303:1723-8.
14. Marchini GS, Mello MF, Levy R, Vicentini FC, Torricelli FC, Eluf-Neto J, et al. Contemporary Trends of Inpatient Surgical Management of Stone Disease: National Analysis in an Economic Growth Scenario. J Endourol. 2015;29:956-62. 15. Mattix Kramer HJ, Grodstein F, Stampfer MJ, Curhan GC.
Menopause and postmenopausal hormone use and risk of incident kidney stones. J Am Soc Nephrol. 2003;14:1272-7. 16. Heller HJ, Sakhaee K, Moe OW, Pak CY. Etiological role
of estrogen status in renal stone formation. J Urol. 2002;168:1923-7.
17. Taylor EN, Stampfer MJ, Curhan GC. Obesity, weight gain, and the risk of kidney stones. JAMA. 2005;293:455-62.
_______________________ Correspondence address: