Cirrhosis of the liver in Brazil: mortality and
productive years of life lost prematurely
1
Ines Lessa
2This descriptive study was done using official data on mortality from cirrhosis of the liver for the year 1989. Its objectives are: (a) to describe mortality from cirrhosis of the liver in Brazil-ian adults; (b) to estimate the productive years of life lost (PYLL) prematurely (between 20 and 59 years of age) from this cause; and (c) to show any regional differences in cirrhosis mortal-ity or PYLL.
The raw data were adjusted by age and sex, using the 1980 population of Brazil as the stan-dard. Calculation of PYLL was based on the formula of Romeder and McWhinnie for years of potential life lost, modified by the author to express productive years of life lost.
The crude death rates from cirrhosis were higher in the Southeast and North, and in all regions they were higher in males, the countrywide male/female ratio being 4.5. Cirrhosis mor-tality among males ranged from a low of 14.37 deaths per 100 000 in the Center-West to a high of 35.86 per 100 000 in the Southeast; for females the rates ranged from 3.49 deaths per 100 000 in the Center-West to 8.5 deaths per 100 000 in the North. The cirrhosis mortality curves by age for men showed a leveling off or decline after age 60, except in the North where the curve continued to rise. Like this latter curve, the cirrhosis mortality curves for women also kept rising progressively with increasing age, most markedly in the North and Northeast. Overall, mortality from cirrhosis of the liver accounted for 48.7% of the deaths from digestive system disorders among men and for 24.1% of such deaths among women.
Of the 138 860 PYLL from cirrhosis of the liver in 1989, 83.2% were lost by males; but the average loss per person dying of cirrhosis nationwide, around 15.5 years, was similar for both sexes. Regionally, the average PYLL per affected person was higher for men and women in the North and for women in the Center-West than it was in the other regions.
The data suggest that cirrhosis of the liver among men in all the regions, except the North, is probably attributable largely to alcoholism. Among males from the North, there is strong evi-dence that cirrhosis with a viral etiology (hepatitis B and C viruses) is also important. For women, the evidence suggests that cirrhosis of viral etiology predominates.
ABSTRACT
The epidemiology of cirrhosis of the liver is poorly known in developing countries, but it is one of the five
lead-ing causes of death among productive age groups in at least 12 countries of the Americas (1), mostly of Latin origin. Cirrhosis of the liver was also the eighth leading cause of death in the United States in 1981 (2) and the ninth leading cause in 1990 (3). Of deaths due to this ailment, 50% to 97% in the United States, 80% in 11 cities of various countries, and 67% among Japanese men are attributed to alcoholism (3–6).
Due to its long asymptomatic course and other diagnostic difficulties in population studies, the prevalence of cirrhosis of the liver is hard to pin-point. In France, a prevalence of 3 000 cases per 1 million population has been estimated, with the prevalence increasing to 25 000 cases per 1 million among alcoholics over 30 years of age with a history of consuming over 80 g of alcohol per day (for men) and 40 g
1 This article has been published in Portuguese in
the Boletín de la Oficina Sanitaria Panamericana, Vol. 121, No. 2, pp. 111–122, August 1997, with the title “Cirrose hepática no Brasil: mortalidade e anos produtivos de vida perdidos precocemente.”
2 Institute of Collective Health, Federal University
per day (for women) (7). A broad investigation on diseases of the liver conducted among hospitalized and ambulatory patients in the United States (in Jefferson County, Alabama) revealed that among those with chronic liver disease, 39% had a his-tory of alcohol abuse (J. Neal, as cited in J. Hoofnagle—3). However, medical service reports citing high frequencies of alcoholism among patients with chronic liver disease suffer from selec-tivity, bias, and failure to represent the population as a whole.
Cirrhosis of the liver is more fre-quent among males (6, 7), and the alcohol-related type is more common in wine-producing countries (7). Deaths due to cirrhosis of the liver during the victims’ productive years are generally attributed to excessive alcohol consumption, it being thought that death caused by cirrhosis with other etiologies generally occurs later (7). After alcoholism, hepatitis B and C viruses are the most important risk factors for cirrhosis. However, various other rarer conditions exist that may also cause the problem (6, 7).
In Brazil, information about the epi-demiology of cirrhosis of the liver is scanty. Mortality data reported 30 years ago for Ribeirão Preto and São Paulo are available (5). In addition, the disease is known to be common at cer-tain locations in the Amazon Basin, but its frequency in terms of popula-tion has not been reported (8). More recently, in a historical series on the 10 leading causes of death in Brazil (1979– 1988), cirrhosis of the liver was always ranked either ninth or tenth among males (9). However, within Brazil’s five multistate regions it was only listed among the 10 leading causes in the Northeast (in 1980, 1981, and 1985) and in the Southeast (in 1983) (10). Within this context, the evidence ob-tained from the historical series (9) may be seen to clearly justify a more thorough investigation of available information on mortality from cirrho-sis of the liver. The specific objectives of the study presented here are: (a) to describe mortality attributable to cir-rhosis of the liver in Brazilian adults; (b) to estimate the productive years of
life lost (PYLL) from premature mor-tality due to cirrhosis; and (c) to bring out any regional differences in cirrho-sis mortality and PYLL.
MATERIALS AND METHODS
The raw data on mortality among adults (people at least 20 years old) were obtained from an official publica-tion of the Ministry of Health contain-ing the most recent statistics on mortal-ity in Brazil, referring to the year 1989 (11). The classifications used were as follows: deaths due to cirrhosis of the liver, No. 571 in the International Classi-fication of Diseases (ICD), 9th revision, and deaths due to diseases of the diges-tive system, ICD Nos. 520–579 (12).
Background data on Brazil’s five regions, shown in Figure 1, are pro-vided in Annex 1. The following were calculated by age, sex, and region: mortality from cirrhosis of the liver per 100 000 inhabitants; the proportion of mortality ascribed to disorders of the digestive system that was due to cirrhosis; and PYLL due to premature mortality (between 20 and 59 years) as a result of cirrhosis.
The population used for calculating these coefficients corresponds to that of 1989, estimated by the Brazilian Institute of Geography and Statistics (IBGE) based on data from the 1991 census (11). This publication provides the total population for each region and each state, with no breakdown by age. The estimated populations of the municipalities in each region are also provided, together with the usual information about deaths. These latter population data were used for the cal-culations so that there would be no underestimate of mortality relative to the total deaths recorded by the statis-tics. In order to estimate the size of the population by age and in each of six age groups, we calculated the respec-tive percentages by sex for 1989 based on data presented by the IBGE for that year. Adjustment of the rates was per-formed by the direct method, using the 1980 Brazilian population as the standard (13).
In determining PYLL, we used the formula of Romeder and McWhinnie (14) for potential years of life lost between the ages of 1 and 70 years, as previously modified and adjusted by the author (IL) to calculate PYLL aris-ing from premature mortality attribut-able to cardiovascular diseases in Brazil (15).
The analysis is descriptive, with ratios of mortality coefficients being used to detect possible regional or sex differences. The data from the Center-West Region, because they had the low-est values, were used as the denomi-nators for regional ratios. Male:female ratios were also calculated for each region, as were regional PYLL averages for both sexes. Differences in PYLL averages by sex in each region were measured relative to the South Region, which recorded the lowest PYLL val-ues. When applicable, the chi-square test was used to assess proportions.
RESULTS
Overall, the data indicate that 12 363 adult deaths were caused by cirrhosis of the liver, 9 937 (80.4%) in men and 2 426 (19.6%) in women. Over three-quarters (75.4%) of the male deaths from cirrhosis occurred between the ages of 20 and 59, as compared to 61.8% of female deaths; the difference between these two latter
ages was statistically significant: (chi-square = 10.6; P= 0.001).
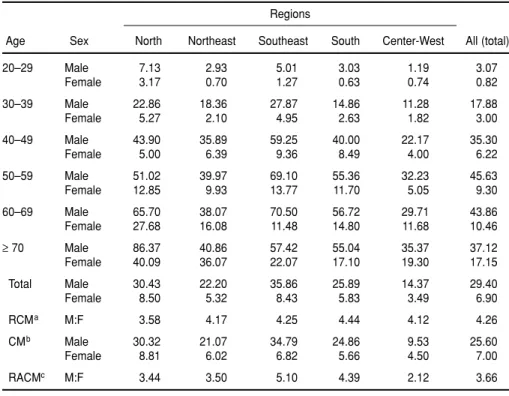
Men exhibited cirrhosis mortality 4.26 times greater than that of women (29.40 versus 6.90 deaths per 100 000). Adjustment for age and sex left this ratio only slightly changed, at 3.66. The raw data also indicated a greater risk of dying from cirrhosis among both men and women of the Southeast and the North. Adjusted, the rates still remained higher in the same regions, showing only slight differences, with women from the North standing out. The lowest rates were found in the Center-West (Table 1).
Mortality increased with age in both sexes, but with major differences: For men there was a trend toward stabi-lization or decline beginning around age 59 in all regions except in the North, where the rate of increase is even greater after 59 than it was before (Figure 2a); for women, no downward trend is observed; rather, mortality continues to increase, most notably in the North and Northeast (Figure 2b).
When we compared cirrhosis mor-tality in the North, South, Northeast, and Southeast regions with that in the Center-West, we observed that the rates were relatively high for men and women between 20 and 29 years of age in the North. More generally, except for women 40–49 and men 50–59, all the rates in the North were at least twice as high as their Center-West counterparts. Mortality was also high in the Southeast, with the highest mor-tality ratio (relative to the Center-West Region) being recorded for the youngest men (this ratio being 4.2:1). In this region, all the rates were twice as high as their Center-West counter-parts except those for women 20–29, 60–69, and over 69, and those for men over 69. The Northeast and the South did not exhibit especially high rates; but, as in the other regions, the greatest contrast with the Center-West values was found in the rates for the youngest (20–29) men—these rates, as Table 2 shows, being 2.5 times that found in the Center-West.
Table 3 shows the percentages of digestive disease mortality ascribed to cirrhosis by region, age group, and sex, which gives an idea of the signifi-cance of cirrhosis within this category. As may be seen, cirrhosis accounted for 48.7% of the recorded digestive dis-ease deaths among men in 1989, but only 24.1% of those among women. The regional figures among males ranged from 36.1% (in the Center-West) to 50.4% (in the Southeast); for women, the range was from 18.3% (in the Center-West) to 32.2% (in the North). More broadly, in every region except the Center-West, and except among men over 69, cirrhosis ac-counted for at least 40% of all digestive disease mortality among males.
Calculations based on these figures indicate that the total number of eco-nomically productive years of life lost
FIGURE 2. Mortality coefficients (deaths per 100 000) from cirrhosis of the liver in (A) men and (B) women, by region and age group, in 1989
TABLE 1. Mortality from cirrhosis of the liver in Brazil by sex, region, and age group, 1989
Regions
Age Sex North Northeast Southeast South Center-West All (total)
20–29 Male 7.13 2.93 5.01 3.03 1.19 3.07
Female 3.17 0.70 1.27 0.63 0.74 0.82
30–39 Male 22.86 18.36 27.87 14.86 11.28 17.88
Female 5.27 2.10 4.95 2.63 1.82 3.00
40–49 Male 43.90 35.89 59.25 40.00 22.17 35.30
Female 5.00 6.39 9.36 8.49 4.00 6.22
50–59 Male 51.02 39.97 69.10 55.36 32.23 45.63
Female 12.85 9.93 13.77 11.70 5.05 9.30
60–69 Male 65.70 38.07 70.50 56.72 29.71 43.86
Female 27.68 16.08 11.48 14.80 11.68 10.46
≥70 Male 86.37 40.86 57.42 55.04 35.37 37.12
Female 40.09 36.07 22.07 17.10 19.30 17.15
Total Male 30.43 22.20 35.86 25.89 14.37 29.40
Female 8.50 5.32 8.43 5.83 3.49 6.90
RCMa M:F 3.58 4.17 4.25 4.44 4.12 4.26
CMb Male 30.32 21.07 34.79 24.86 9.53 25.60
Female 8.81 6.02 6.82 5.66 4.50 7.00
RACMc M:F 3.44 3.50 5.10 4.39 2.12 3.66
aRatios of cirrhosis mortality in men and women.
(PYLL) to premature death from cir-rhosis in Brazil in 1989 was 138 860 years, with males accounting for 83.2% of this total (Table 4). However, the national average PYLL per person was close to 15.5 years in both sexes. Regionally, the average PYLL per per-son was somewhat higher for men in the North and women in the North
and Center-West, departures from the national averages being negligible in the other regions.
DISCUSSION
Even though mortality data are among those most easily obtained in
any Brazilian state (because they are secondary in nature), relatively high underestimation in the reporting of deaths in the less developed regions is well known (11). In addition, medical care in less developed regions tends to be of poor quality, thus fostering a sit-uation in which relatively large pro-portions of all deaths are ascribed to ill-defined causes; this is especially true in the interior of the North and the Northeast.
To avoid large underestimates of cir-rhosis mortality, the population fig-ures used to calculate these rates were those cited for municipalities regularly reporting cirrhosis mortality data. Even so, given the problem of deaths being attributed to poorly defined causes, it is possible that the rates reflect an underestimate, especially in the North and perhaps in the State of Mato Grosso (in the Center-West), because there is a high prevalence of viral hepatitis throughout the area of the Amazon Basin,3and so it is
possi-ble that large numbers of deaths occur-ring without benefit of medical care and included in deaths attributable to poorly defined causes may actually have been due to cirrhosis of the liver. The trend toward stabilization of age-specific male cirrhosis mortality beginning around age 60 (Figure 2), except in the North, suggests a strong predominance of cirrhosis with an alcoholic etiology in the other four regions. This type of mortality curve is common in alcoholic cirrhosis due to its poor survival prognosis when com-pared to cirrhosis of other etiologies (5, 6). The view that there is a predom-inance of alcoholic cirrhosis in men is also based on the high prevalence of alcoholism in this sex (1, 7, 16), on the frequencies of alcoholic cirrhosis found among patients of medical
ser-TABLE 2. Ratios of cirrhosis mortality, by age and sex, in the North, Northeast, South, and Southeast regions of Brazil as compared to cirrhosis mortality in the Center-West Region, 1989
Regions
Age Sex North Northeast Southeast South
20–29 Male 6.0 2.5 4.2 2.5
Female 4.3 0.9 1.7 0.9
30–39 Male 2.0 1.6 2.5 1.3
Female 2.9 1.1 2.7 1.4
40–49 Male 2.0 1.6 2.7 1.8
Female 1.3 1.6 2.3 2.1
50–59 Male 1.6 1.2 2.1 1.7
Female 2.5 2.0 2.7 2.3
60–69 Male 2.2 1.3 2.4 1.9
Female 2.4 1.4 1.0 1.3
≥70 Male 2.4 1.2 1.6 1.6
Female 2.1 1.9 1.1 0.9
Total Male 2.1 1.5 2.5 1.8
Female 2.4 1.5 2.4 1.7
TABLE 3. The percentage of all Brazilian mortality from diseases of the digestive system accounted for by mortality from cirrhosis of the liver—by sex, region, and age group, 1989
Regions
Age Sex North Northeast Southeast South Center-West Total (%)
20–29 Male 40.0 41.9 45.5 46.7 19.6 43.3
Female 32.6 22.3 32.1 26.1 22.2 28.7
30–39 Male 52.2 60.3 66.7 64.9 49.6 64.0
Female 37.5 31.3 51.1 35.2 28.2 43.4
40–49 Male 61.1 62.2 66.0 69.8 55.1 65.4
Female 26.3 38.6 47.6 46.3 25.4 43.6
50–59 Male 46.0 50.1 59.3 60.1 47.7 57.0
Female 40.0 30.0 35.6 28.9 19.0 32.8
60–69 Male 45.4 41.8 43.0 42.1 28.2 42.1
Female 36.4 29.8 24.1 22.1 21.0 25.0
≥70 Male 30.0 30.0 19.4 17.8 14.3 21.1
Female 25.5 16.7 9.7 7.3 10.9 10.8
Total Male 42.2 48.1 50.4 48.1 36.1 48.7
Female 32.2 25.9 24.8 20.2 18.3 24.1
3 The Amazon Basin should not be confused with
vices, and on studies conducted with methodologies using various informa-tion sources to verify the contents of death certificates that have found alco-holism mentioned in cases of death due to cirrhosis of the liver (5).
In the case of men from the North Region, the sharply rising mortality curve in the oldest groups points to possible involvement of another major cirrhosis etiology. The most probable explanation is co-participation of the hepatitis B and/or C virus, or the B and delta, all of which are prevalent in the Amazon Basin (8, 17) and could act in synergy with alcohol. The pro-gressively rising mortality curves found for men from the North and women from all regions of Brazil (see Figure 2) differ from the general curve seen in the United States and are simi-lar to those curves observed for both sexes among the Japanese—these lat-ter also being explained by the syn-ergy between alcohol and virus in men and the predominance of nonalcoholic cirrhosis (generally of viral etiology) in
women (6). Within this context it is worth noting that Erlinger and Ben-hamou refer to cirrhosis due to hepati-tis viruses B and C as the secondary cause of cirrhosis, but make no men-tion of gender (7).
Serologic surveys of viral hepatitis conducted in various small localities in the Amazon Basin have shown that, in many cases, nearly 100% of the popu-lation tested was seropositive for one or more types of hepatitis virus (8). Moreover, the share of mortality among men due to viral hepatitis in the North Region of Brazil, beginning at age 20, is 12.3 times higher than in the Southeast (the region with the lowest share of mortality attributable to that cause), while among women in the North it is 5.7 times higher. These ratios are much higher than the ratios between other regions by sex and the Southeast; and among both men and women viral hepatitis accounts for a much higher percentage of infectious and parasitic disease mortality in the North than in any of the other four
regions (Annex 2). Therefore, signifi-cant epidemiologic evidence supports the hypothesis that there is strong par-ticipation or co-parpar-ticipation by hepati-tis B and/or C virus in determining Brazilian mortality due to cirrhosis of the liver, at least in the North Region. Unfortunately, there are no population data on the prevalence of alcoholism in the North Region that would permit better understanding of the difference between cirrhosis mortality there and in the other regions.
Brazilian data on alcoholism reflect a high prevalence of that disorder among men in the Southeast (18), who exhibit the highest crude mortality attributable to cirrhosis of the liver (see Table 2), despite the fact that the wine-producing center of the country is located in the South Region. On the other hand, Mexico has the highest recorded mortality from cirrhosis of the liver in Latin America while rank-ing only sixth in per capita consump-tion of alcohol among 15 countries with available data. Chile, a wine-producing country, ranks second in cirrhosis mortality and fifth in alcohol consumption; while Argentina, also a wine producer, has the highest per capita consumption of alcohol and the lowest rate of mortality from cirrhosis of the liver. Of the 15 countries, Brazil ranks tenth in per capita alcohol con-sumption (1).
Since the beginning of the 1960s, Mexico and Chile have recorded the highest mortality from cirrhosis of the liver (5) in Latin America, but both countries have prevalences of alco-holism that are far below those that a relatively recent (1987) multicenter international study found in the Brazil-ian cities of São Paulo (in the Southeast Region) (18) and Porto Alegre (in the South Region) (19) that was conducted using the same methodology.
The possible discrepancies between the magnitudme of mortality from cir-rhosis of the liver and the prevalences of alcoholism in diverse population groups, and/or their relation to the presence or absence of local or regional wine-producing industries, stem from a diversity in the aims and methods of
TABLE 4. Productive years of life lost (PYLL) in Brazil due to premature mortality attribut-able to cirrhosis of the liver—by sex, region, and age group, 1989
Regions
Center-Age Sex North Northeast Southeast South West Total (all)
Male n= 253 n= 1 200 n= 4 647 n= 1 152 n= 241 n= 7 493
Female n= 61 n= 246 n= 927 n= 220 n= 45 n= 1 499
20–29 Male 1 050 2 520 8 175 1 995 315 14 595
Female 525 735 2 380 420 210 4 270
30–39 Male 1 800 7 850 31 150 5 825 1 575 48 200
Female 450 1 175 5 900 1 075 275 8 875
40–49 Male 1 320 6 885 24 405 6 600 1 305 40 485
Female 150 1 365 4 560 1 305 240 7 620
50–59 Male 315 1 785 7 625 2 110 410 12 245
Female 90 435 1 595 390 60 2 570
Total Male 4 485 19 040 71 895 16 530 3 605 115 525
Female 1 215 3 710 14 435 3 190 785 23 335
Average Male 17.73 15.87 15.47 14.35 14.96 15.42
PYLL Female 19.92 15.08 15.60 14.50 17.44 15.57
Difference Male 3.38 1.52 1.12 0.61
in averagesa Female 5.42 0.58 1.07 2.94
aDifferences between the PYLL averages by sex and age group in each region and the comparable average PYLL in the South
the research activities producing and analyzing data. In many cases the investigation involved analyzed only one of the above-mentioned factors. Furthermore, in some studies the data are for groups while in others they are for individuals. To this must be added the difficulties in establishing operat-ing criteria for dichotomizoperat-ing the pres-ence or abspres-ence of alcoholism.4
What is clear is that in 1989 a high rate of death from cirrhosis of the liver below age 60 (premature mortality) led to a loss of 138 860 years of pro-ductive life for Brazilian men and women. This loss can be considered high compared to the loss of potential years of productive life in 1990 in the United States from the same cause, even though in the latter country the excess of years lost in relation to Brazil was 83 965, since the calculations for Brazil were made for the ages between 20 and 59 years, while for the United States they were made for all ages below 65 (3).
It was not our intent to determine any statistical significance for the dif-ferences between the PYLL averages, either in regional or gender compar-isons. The point to be made is that such losses are a burden on the
Brazil-ian national economy and regional economies, imposing a heavy burden on both the family and society. The deaths involved produce losses in the general work force (particularly in the skilled labor force), cause early pay-ment of pensions to dependents (an average of 15.5 years earlier than expected), and lead to deterioration in the quality of life of dependents by interfering with the education of minor dependents and causing other social disadvantages.
It is worth remembering that most premature deaths from cirrhosis of the liver are attributed to alcoholism, which is considered a risk factor related to lifestyle that is probably mediated by interactions between the heredity of enzyme-related metabolic defects and/or other biologic abnor-malities as well as by factors related to the psychosocial and cultural environ-ment (20–22). In Brazil, population strategies (health education focusing on lifestyle and on attitude and behav-ior modification) may be adopted at early ages in an effort to bring about primordial or even primary preven-tion,5despite the fact that rates of
alco-holism are high, thus creating a diffi-cult situation with regard to treatment and social rehabilitation. Such strate-gies would also help to work against other chronic diseases associated with excessive consumption of alcohol that have a greater social impact than cir-rhosis of the liver—such as high blood pressure, cerebrovascular disease, dia-betes secondary to alcoholism, pancre-atitis, and psychologic disorders.
As for prevention of cirrhosis of the liver resulting from infection by the hepatitis virus, the situation seems par-ticularly serious for population groups in a number of different regions of the Amazon Basin, given the high preva-lence of seropositivity for various hepatitis viruses and the difficulties involved in gaining geographic access to such regions, among other things. However, certain Brazilian risk groups are specifically targeted for immuniza-tion against hepatitis B, and the sys-tematic vaccination of children is already being recommended in order to break the chain of transmission of that agent (3).
As all of the foregoing suggests, pre-vention of cirrhosis of the liver arising from the two main risk factors cited will require a large quantity of finan-cial, human, and material resources and will constitute a difficult task in view of Brazil’s current economic, political, and social conditions.
4 Lessa I. Investigação epidemiológica de doenças
crônicas não transmissíveis. (Chapter of a book in publication.)
5 Primordial prevention is defined as prevention of
the acquisition of the risk factor (alcoholism) for cirrhosis of the liver. Primary prevention is defined as removal of the risk factor (alcoholism) prior to the onset of cirrhosis of the liver.
1. Organización Panamericana de la Salud. Salud del adulto y del anciano. In: Vol 1: Las condiciones de salud en las Américas. Washing-ton, DC: OPS; 1990. (Scientific publication 524).
2. Kauer M, Silverman S. Alimentary tract and liver. In: Shroeder SA, Krupp MA, Tierney LM, McPhee SJ. Current medical diagnosis and treatment.Los Altos, California: Lange Med-ical Publications; 1989:408.
3. Hoofnagle J. Epidemiology and control of viral hepatitis. Chicago: Annual Meeting of the American Association for the Study of the Liver; 1993.
4. United States, Department of Health and Human Services. Sixth special report to the US Congress on alcohol and health. Washing-ton, DC: US Government Printing Office; 1987. (DHHS publication no. ADM 87-1519).
5. Puffer RR, Griffith GW. Características de la mortalidad urbana. Washington, DC: Organi-zación Panamericana de la Salud; 1968. (Sci-entific publication 151).
6. Parrish KM, Higuchi S, Muramatsu T, Stinson FS, Harford TC. A method for estimating alco-hol-related liver cirrhosis mortality in Japan. Int J Epidemiol1991;20:921–926.
7. Erlinger S, Benhamou JP. Cirrhosis: clinical aspects [chap 7]. In: McIntyre N, Benhamou JP, Bircher IAD, Rizzeto M, Rodes O. Vol 1: Oxford textbook of hepatology. Paris: Oxford Medical Press; 1991.
8. Bensabath G, Hadler S, Soares MCP, Fields H, Maynard JE. Epidemiologic and serologic studies of acute viral hepatitis in Brazil’s Amazon Basin. Bull Pan Am Health Organ 1987;21:16–27.
9. Brasil, Ministério da Saúde. Informe epidemio-lógico do SUS, CENEPI.1992;1(2):81–115. 10. Brasil, Ministério da Saúde. Informe
11. Brasil, Ministério da Saúde. Estatísticas de mortalidade, Brasil, 1989.Brasília: Ministério da Saúde; 1993.
12. Brasil, Fundação Instituto Brasileiro de Geografia e Estatística. Anuário estatístico do Brasil, 1983.Rio de Janeiro: IBGE; 1984. 13. Brasil, Fundação Instituto Brasileiro de
Geografia e Estatística. Anuário estatístico do Brasil, 1992.Rio de Janeiro: IBGE; 1992. 14. Romeder JM, McWhinnie JR. Potential years
of life lost between ages 1 and 70: an indicator of premature mortality for health planning. Int J Epidemiol1977;6:143–151.
15. Lessa I. Years of productive life lost to prema-ture mortality from cardiovascular diseases. Bull Pan Am Health Organ1991;25:229–236. 16. Santana VS, Almeida Filho N. Aspectos
epi-demiológicos do alcoolismo [chap 3]. In: Ramos SP. Alcoolismo hoje.Porto Alegre: Artes Médicas; 1987:29–44.
17. Bensabath G, Soares MCP, Maia MMS. Hepatites por vírus. In: Vol 1: Instituto Evandro Chagas: 50 anos de contribuição às ciências bioló-gicas e à medicina tropical. Belém: Fundação de Serviços de Saúde Pública; 1986:483–529. 18. Rego RA, Berardo FAN, Rodrigues SSR,
Oliveira ZMA, Oliveira MB, Vasconcelos SC, et al. Fatores de risco para doenças crônicas não transmissíveis: inquérito domiciliar no município de São Paulo, SP, Brasil: metodolo-gia e resultados preliminares. Rev Saúde Pública(São Paulo) 1990;24:277–285. 19. Duncan BB. As desigualdades sociais na
dis-tribuição de fatores de risco para doenças não transmissíveis [Doctoral thesis]. Universidade Federal do Rio Grande do Sul: Rio Grande do Sul; 1991.
20. Vargas HS. Etiologia do alcoolismo. In: Vargas HS, ed. As repercussões do álcool e do alcoolismo. 2nd ed. São Paulo: Fundo Editorial BYC; 1988.
21. Masur J. A etiologia do alcoolismo [chap 2]. In: Ramos SP. Alcoolismo hoje. Porto Alegre: Artes Médicas; 1987:19–28.
22. Pelicier Y. Des mots sur l’alcoolisme. Con-frontations psychiatriques1972;8:9–19.
Manuscript received 28 November 1994. Accepted, fol-lowing revision, for publication in Spanish in the Boletín de la Oficina Sanitaria Panamericanaon 17 August 1995 and for publication in English in the Revista Panamericana de Salud Pública/Pan American Journal of Public Health on 7 September 1995.
ANNEX 1. Some characteristics of Brazil’s five regional subdivisionsa
Regions
Variables North Northeast Southeast South Center-West
Area in km2 3 858 595 1 548 672 924 935 577 723 1 602 040
Area of Amazon Basin component in km2 3 277 163 612 327
No. of states, 1990 7 9 4 3 3b
No. of municipalities, 1992 298 1 509 1 432 873 379
Population, 1990 5 034 403 43 094 708 65 883 203 22 899 688 10 393 52
Demographic density (inhabitants/km2) 1.6 22.57 56.31 33.86 4.01
Life expectancy at birth, 1980s 64.17 51.57 63.59 66.98 64.70
Population ≥60 years, 1980 (%) 4.17 6.30 6.44 5.69 4.15
Fertility rate, 1980 (%) 6.45 6.13 3.45 3.63 4.15
% of hospital beds per 1 000 inhabitants, 1990, relative to the WHO parameterc
≤75 50 to 100 50 to ≥100 50 to 100 50 to ≥100
Deaths from poorly defined causes, ICD Nos. 780–799d
0–10% 3 states 2 states 1 state 1 state
11–25% 2 states 2 states 2 states
26–50% 3 states 5 states
51–100% 1 state 4 states
Mortality due to infectious and parasitic
diseases (%) 10.3 7.0 4.6 3.9 8.0
Economically active population (≥10 years of age) 3 756 595 31 614 528 52 390 826 17 920 057 7 947 147 Illiteracy rate, adults ≥15 years of age (%)
Whites 8.2 28.6 8.4 9.4 11.5
Blacks 14.0 49.7 21.0 20.1 33.2
Mixed 12.8 38.8 16.3 23.9 20.5
Source: IBGE (12).
aIt was not possible to obtain information on per capita income for each region. It is known that there is a great difference between the South and Southeast regions and other regions; the
Northeast has the lowest per capita income in the country.
bThe Federal District (Brasília, the capital of the country) is located in this region.
Este é um estudo descritivo, efetuado com base em dados oficiais sobre mortalidade por cirrose hepática para o ano de 1989. Os seus objetivos são: a) descrever a mor-talidade por cirrose hepática em adultos brasileiros; b) estimar os anos produtivos de vida perdidos (APVP) precocemente (entre 20 e 59 anos) e c) determinar possiveis diferenças regionais na mortalidade e nos anos produtivos de vida perdidos.
Os dados brutos foram ajustados por idade e sexo, tomando como padrão a popu-lação brasileira para o ano de 1980. Os APVP basearam-se na fórmula de Romeder e McWhinnie para anos potenciais de vida perdidos, modificados pela autora para anos produtivos de vida perdidos.
As taxas brutas de mortalidade foram mais elevadas no Sudeste e Norte, e em todas as regiões predominou no sexo masculino, com razões homem/mulher para o país de 4,5 e variações regionais dos coeficientes de mortalidade para o sexo masculino de 14,37 (Centro-Oeste) a 35,86/100 000 (Sudeste), e para o sexo feminino de 3,49 (Centro-Oeste) a 8,5/100 000 (Norte). As curvas etárias de mortalidade para os homens, exceto os da região Norte, mostram tendência ao declinio ou estabilização a partir dos 60 anos. Para os homens do Norte, a curva é continuamente ascendente, atingindo 86,37/100 000 habitantes a partir dos 70 anos. As mulheres também apre-sentam curvas ascendentes, muito expressivas no Norte e Nordeste. As taxas ajusta-dos por idade mostram uma redução para as mulheres do Sudeste, mantendo-se mais elevada no Norte. A mortalidade proporcional por cirrose hepática em relação ao aparelho digestivo chegou aos 48,7% para os homens e 24,1% para as mulheres.
Dos 138 860 APVP por cirrose hepática em 1989, 83,2% foram no sexo masculino, mas as médias de APVP para o país, em torno de 15,5 anos, foram semelhantes para os sexos. Todavia, as médias de APVP para homens e mulheres do Norte e mulheres do Centro-Oste foram muito mais elevadas do que nas demais regiões.
Os dados sugerem que a cirrose hepática entre os homens de todas as regiões, exceto os da região Norte, é possivelmente determinada pelo alcoolismo, enquanto entre homens nortistas existem fortes evidências da co-existencia de cirrose hepática de etiologia viral (vírus B e C da hepatite). Para as mulheres, as evidências apontam também para o predomínio da cirrose de etiologia viral.
RESUMO
Cirrose hepática no Brasil:
mortalidade e anos produtivos
de vida perdidos
precocemente
ANNEX 2. The proportions (%) of all mortality (except deaths from ill-defined causes) and all infectious and parasitic disease mortality accounted for by mortality from viral hepatitis, by sex and region, showing the ratios between these percentages in the North, Northeast, South, and Center-West regions and those in the Southeast Region, 1989
% of all Ratio to % of IPD Ratio to
Region Sex mortality Southeast mortalitya Southeast
North Male 0.74 12.3 8.1 5.7
Female 0.57 5.7 7.3 2.6
Northeast Male 0.11 1.8 1.7 1.2
Female 0.17 1.7 2.7 1.0
Southeast Male 0.06 — 1.4 —
Female 0.10 — 2.8 —
South Male 0.12 2.0 4.2 3.0
Female 0.13 1.3 4.7 1.7
Center-West Male 0.15 2.5 1.8 1.3
Female 0.10 1.0 1.2 0.4
Source:Raw data from reference 11. Calculations made by the author (IL).