Social vulnerability and health status:
a household survey in the central
area of a Brazilian metropolis
Vulnerabilidade social e estado de saúde: inquérito
domiciliar em uma metrópole brasileira
1 Faculdade de Ciências Médicas da Santa Casa de São Paulo, São Paulo, Brasil. 2 Other members listed at the end of the paper.
Correspondence R. B. Barata Faculdade de Ciências Médicas da Santa Casa de São Paulo.
Rua Dr. Cesário Mota Jr. 61, São Paulo, SP
01221-020, Brasil.
Rita Barradas Barata 1
Manoel Carlos Sampaio de Almeida Ribeiro 1 Ana Carolina Cassanti 1
Grupo do Projeto Vulnerabilidade Social no Centro de São Paulo 2
Abstract
The self-rated health in a sample of adults living in the central area of São Paulo, Brazil, was stud-ied by comparing a group of residents in census tracts without social vulnerability, identified us-ing an indicator developed by the SEADE Foun-dation, and a group of residents in census tracts with middle, high or very high social vulnerabil-ity. Subject age and sex were used as control vari-ables while family income, education level, degree of happiness, adequacy of income, satisfaction with the neighborhood and sense of discrimina-tion were the intervening variables selected. After adjustment in the hierarchical model the self-rated health status was inversely associated with social vulnerability, age and sense of discrimina-tion, and directly related to income, education level and degree of happiness. Satisfaction with the neighborhood and adequacy of income lose significance after adjustment. The degree of hap-piness is the variable with the greatest strength of association with health status even after control-ling for other variables.
Social Vulnerability; Social Conditions; Health Status
Introduction
The city of São Paulo, Brazil, is one of the world’s 19 megacities, defined by the World Health Or-ganization (WHO) as cities with more than 10 million inhabitants and which concentrate in a uneven way the local and national economy, po-litical and scientific power and media attention 1. For a number of reasons – the complexity of their economic activities, the coexistence of differ-ent social classes, fragmdiffer-entary characteristics and cultural syncretism – the great metropolises create spaces that are permeated with social and health inequalities.
Throughout the 20th century the process of social segregation has risen. Increasing polar-ization is represented through the unequal dis-tribution of income, formal education, profes-sional qualifications, housing quality, and access to cultural and others assets, with effects on the occupation process of urban areas. The internal structure of São Paulo concentrates its wealth in its central and western areas while poverty is concentrated in the outskirts 2.
The historical center of São Paulo shows evi-dent signs of deterioration, impoverishment and diversification when compared to the traditional center at the beginning of the last century. In the 1950s and 60s, the center of São Paulo had al-ready started showing signs of deterioration, with the presence of informal commerce, violence and poverty. This trend continued into the 1970s and 80s and reached an extreme heterogeneous situa-tion among different social groups in the 1990s 3. The city center, made up of ten administra-tive areas of Sé subdistrict and Barra Funda ad-ministrative area (Lapa subdistrict), is among those with a higher proportion of the population (93.8%) with low or no social vulnerability. Al-though it is possible to observe great social het-erogeneity in it. The size of families, for example, range from 2.4 people per house in the non-vul-nerability group to 3.8 people per house in the very high vulnerability group. The same differ-ences can be observed in the average number of years spent in formal education, ranging between 4.2 to 12.2 years and the average income among those who head a house, from R$ 257 to R$ 3,152 (SEADE Foundation. Índice de Vulnerabilidade Social. http://www.seade.gov.br, accessed on 10/ Apr/2010).
The reproduction aspects of the human groups who live in the social areas impact on health status and determine the epidemiological profile. So, the heterogeneity of life conditions in urban areas affects different aspects of health-disease processes as well as patterns of health service usage 4,5.
A study by Mossey & Shapiro 6 showed the capacity of self-rated status as a mortality predic-tor among senior citizens, and a rising number of epidemiological studies have used the percep-tion of health status as a global measure for the health level of a population. In Brazil, the self-assessment of health status has been incorporated into epidemiological studies more frequently after the inclusion of this question in the supplement on health of the National Household Sample Sur-vey (PNAD) in 1998 following the trend observed in health surveys conducted in other countries 7. The question on self-assessment was also included in the Risk and Protective Factors Surveillance Sys-tem for Chronic Non-Communicable Diseases Through Telephone Interview (VIGITEL) 8.
The associations between health status and socioeconomic variables such as education and income, or demographics such as age and sex is well known 7,8,9,10. However, less common are studies that attempt to examine other aspects of well-being that can be related to self-reported health status, such as the degree of happiness, the feeling of discrimination, satisfaction with the
neighborhood, the adequacy of income to meet the needs and expectations of family spending.
This paper analyzes data from a survey in the central area of São Paulo. It studies the inequali-ties of health status and access to health services in the different degrees of social vulnerability. The objective of the analysis here presented was to identify the inequalities of health status among Sao Paulo downtown groups of residents classi-fied according to their degree of social vulner-ability considering other aspects beside socio-demographic indicators, such as degree of hap-piness, sense of discrimination, satisfaction with the neighborhood and adequacy of income.
Methods
This was a cross-sectional study with adult resi-dents (aged 18 and older) from São Paulo Munici-pality’s central area, stratified according to the social vulnerability level calculated by the region census tract.
Samples and field work
The samples came from the census tract in the region, classified as the paulista social vulner-ability index (IPVS – SEADE Foundation. http:// www.seade.gov.br/produtos/ipvs/apresentacao. php, accessed on 10/Apr/2010). The IPVS clas-sifies the census tract sectors in six groups of so-cial vulnerability (very high to low vulnerability) considering socio-economic dimensions (% of heads of households: illiterate, primary education complete, monthly income of up to triple the mini-mum wage, average years of schooling, average in-come) and family life cycle (% of heads of house-holds aged between 10 and 29, mean age of heads of households and % of children 0-4 years living in the census tract). For the survey, census tracts were arranged in two strata of social vulnerability in order to capture the extremes of vulnerability: • Residents without social vulnerability, living in census tracts of group 1 of IPVS (no social vul-nerability);
• Residents with social vulnerability, living in census tract of groups 4, 5 and 6 of IPVS (me-dium, high and very high social vulnerability).
in order to update all homes randomly select-ed in the census tracts. The enrollment allowselect-ed making a list with all 16,872 addresses randomly selected from the groups. Starting from this list, 40 households were randomly selected (20 + 20 reserve). The 20 reserve homes were used when the sample was not able to be completed due to refusal or after three unsuccessful visits.
One individual per home was interviewed, randomly chosen from a list of electable residents in the household. The interviews were conducted by trained interviewers and with field supervision. The study was conducted by a team from a firm specialized in household surveys. Consequently, 917 interviews were performed (92% of the pre-dicted), 428 interviews (86%) in the census tract stratum without vulnerability and 487 (97%) in the stratum with social vulnerability. The enroll-ment happened in March and April of 2008 and the data collection occurred over the next four months.
Collection instrument
The data collection instrument gathered demo-graphic and social information about the health status according to the self-reported health data (SF-12), protection and risk factors for health, re-productive care and control and access to health services. All questions had been used in health surveys in the United States, Sweden and the United Kingdom. Furthermore, the question-naire was pretested in residents of the central region. Data from pre-test served only to adjust-ments in the questionnaire and was not included in the analysis.
The self-rated health status was evaluated through the question “Generally, would you say that your health is”: with the following alterna-tives, very good, good, fair, poor, and very poor. A dichotomous variable was created for this study, defining the health status, evaluated positively (very good and good), here denominated as good Figure 1
Sampled census tracts. São Paulo central area, Brazil, 2008.
Not sampled (756)
Without vulnerability (25)
With vulnerability (25) Census tracts
N
E W
S
or evaluated negatively (fair, poor, very poor) de-nominated poor.
We investigated the association between the health status and contextual variable of social vulnerability of the area of residence, individual socio-demographic variables (age, sex, education and monthly family income) and perceptions re-lated with well-being (degree of happiness, sense of discrimination, satisfaction with the neighbor-hood and adequacy of income).
The sense of discrimination was obtained from the answer to the question: “Are you part of a group that suffers some kind of discrimina-tion/prejudice? Y/N”. The degree of happiness was checked by the interviewee in a scale of 0 to 10 and classified as low, moderate and high. The sense of adequacy of income was obtained by the question “how do you rate your family income nowadays?”, with answers: “we live comfortably with our current income and our income is ad-equate for our needs” grouped into the adequate category, and the answers “it is difficult to live within our current income and our income is not adequate for our needs” grouped into the inad-equate category. Satisfaction with the neighbor-hood was obtained with the answer to the ques-tion “Are you satisfied with your neighborhood?” the answers were grouped into satisfied (satisfied and very satisfied) or dissatisfied (dissatisfied or reasonably satisfied).
Statistical analysis
The univariate analysis estimated the prevalence and investigated the associations through the chi-square test (alpha of 0.05), odds ratio (OR) and 95% confidence intervals (95%CI)
The multivariate analysis was performed by logistic regression using a hierarchical modeling strategy, in which the independent variables are added to the model in blocks according to levels of hierarchy. Beginning with the most distal block, we evaluate with this strategy the importance of the block as a whole, and excluded the variables that do not contribute to the model in order to fol-low with the evaluation of more proximal blocks.
The hierarchical blocks were formed as fol-lows:
• Distal: area of residence vulnerability;
• Intermediate: sex, age, education and family income;
• Proximal: sense of discrimination, degree of happiness, adequacy of income and satisfaction with the neighborhood.
We chose to consider as intermediate vari-ables those which are usually used in self-reported health studies and as proximal the variables that correspond to the subjective perceptions of
well-being, assuming that subjective perceptions are based on objective situations. In the logical model we consider as an explanatory variable the level of social vulnerability in the census tract of residence, and as the intervening variables sex, age, education and family income in the next level and subjective perceptions of happiness, discrimination, satisfac-tion with the neighborhood and adequacy of in-come as another set of intervening variables. The outcome variable was self-reported health status.
Using a stepwise forward strategy in hierarchi-cal modeling with a significance of 0.05 in order to enter into the model and 0.10 for permanence, four models were built that differed in relation to the proximal variable considered. Besides considering the variables related to the perception of different dimensions of well-being as proximal variables as noted earlier, we chose to present a model for each one. Because the variable “satisfaction with the neighborhood” lost its significance in the adjusted model, the data will not be displayed.
Ethical aspects
The project was approved by the Ethis Research Committee on humans at the Irmandade da Santa Casa de São Paulo, protocol nº. 061/07. All inter-viewees were informed about the research objec-tives, orally and in writing and signed consent forms when agreed to participate. All precautions relating to confidentiality of the interviewees were adopted.
Results
The survey considered 487 adults living in areas of social vulnerability (medium, high and very high) and 430 adults living in areas without social vul-nerability. Among residents in areas without so-cial vulnerability, 194 (45.1%) reported very good health, 159 (37%) good, 67 (15.6%) fair, 9 (2.1%) poor and 1 (0.2%) very poor. Among residents in areas of social vulnerability, 82 (16.8%) reported very good health, 216 (44.4%) good, 147 (30.2%) fair, 28 (5.7%) poor and 14 (29%) very poor.
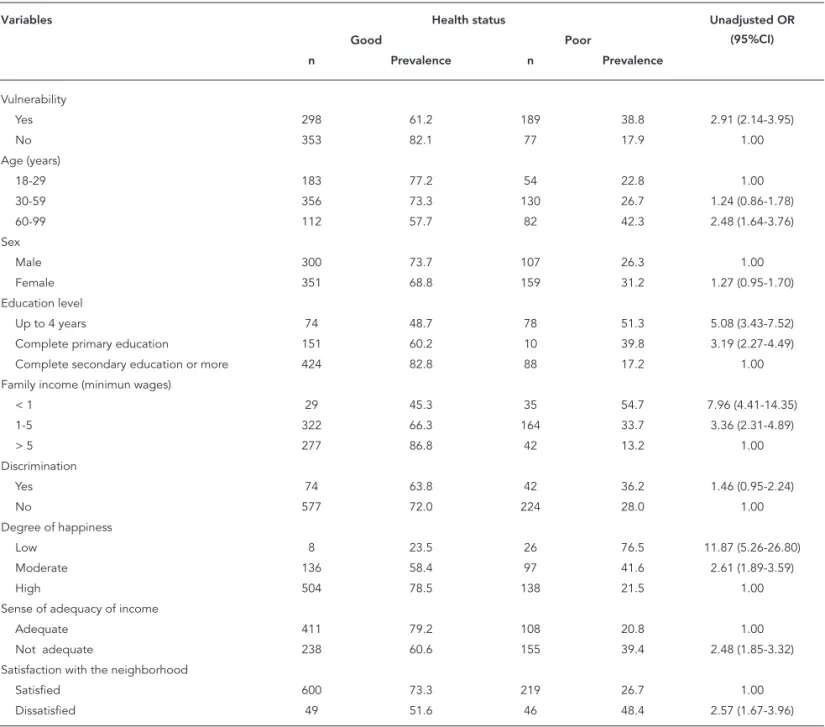
Table 1 presents sample characteristics. Data are independently presented for the two groups of social vulnerability. There are statistical differences for all the variables except for sex (p-value < 0.05).
of fair or poor health is higher for people living in areas of social vulnerability (OR = 2.91), aged 60 and over (OR = 2.48), with lower education (up to four years and complete primary education, OR = 5.08 and 3.19, respectively), with income low-er than five times the minimum wage (OR = 7.96 or 3.36), income considered inadequate (OR = 2.48), moderate or low degree of happiness (OR = 2.61 and 11.87, respectively), and dissatisfied with their neighborhood (OR = 2.57).
Table 3 presents the results of the hierarchical model, where degree of happiness is considered as a proxy variable: social vulnerability remains
a key determinant of health. The associations with education, family income and level of hap-piness also remained significant. Regarding age, the association seems to be significant only for the elderly.
Table 4 presents the hierarchical model, where perceived adequacy of income for family needs is the proxy variable. This model does not include the degree of happiness. The adjustment reduces the strength of association with vulnerability but it remained significant. The association with the per-ception of the adequacy of income virtually disap-peared after adjustment for other variables. Table 1
Self-rated health status according to demographic, social and welfare variables. São Paulo central area, Brazil, 2008.
Variables Health status Unadjusted OR
(95%CI)
Good Poor
n Prevalence n Prevalence
Vulnerability
Yes 298 61.2 189 38.8 2.91 (2.14-3.95)
No 353 82.1 77 17.9 1.00
Age (years)
18-29 183 77.2 54 22.8 1.00
30-59 356 73.3 130 26.7 1.24 (0.86-1.78)
60-99 112 57.7 82 42.3 2.48 (1.64-3.76)
Sex
Male 300 73.7 107 26.3 1.00
Female 351 68.8 159 31.2 1.27 (0.95-1.70)
Education level
Up to 4 years 74 48.7 78 51.3 5.08 (3.43-7.52)
Complete primary education 151 60.2 10 39.8 3.19 (2.27-4.49)
Complete secondary education or more 424 82.8 88 17.2 1.00
Family income (minimun wages)
< 1 29 45.3 35 54.7 7.96 (4.41-14.35)
1-5 322 66.3 164 33.7 3.36 (2.31-4.89)
> 5 277 86.8 42 13.2 1.00
Discrimination
Yes 74 63.8 42 36.2 1.46 (0.95-2.24)
No 577 72.0 224 28.0 1.00
Degree of happiness
Low 8 23.5 26 76.5 11.87 (5.26-26.80)
Moderate 136 58.4 97 41.6 2.61 (1.89-3.59)
High 504 78.5 138 21.5 1.00
Sense of adequacy of income
Adequate 411 79.2 108 20.8 1.00
Not adequate 238 60.6 155 39.4 2.48 (1.85-3.32)
Satisfaction with the neighborhood
Satisfied 600 73.3 219 26.7 1.00
Dissatisfied 49 51.6 46 48.4 2.57 (1.67-3.96)
Table 5 presents the hierarchical model, taking as a proxy variable the feeling of discrimination. The strenght of association of sense of discrimina-tion increased after adjusting for other variables and the statistical significance could be observed.
The variable satisfaction with the neighbor-hood loses significance after adjustment for social vulnerability. The inclusion of individual variables of perception from other well-being dimensions, such as degree of happiness, adequacy of income and sense of discrimination, in addition to socio-demographic variables, resulted in a reduction
of approximately 40% in the strength of associa-tion between social vulnerability and self-referred health status.
Discussion
Self-rated health has proved to be a good predictor of mortality in subsequent years, indicating a bet-ter prognosis than objective measures based on clinical assessments 11,12, self-rated health prob-ably reflects the integrated perception of the indi-Table 2
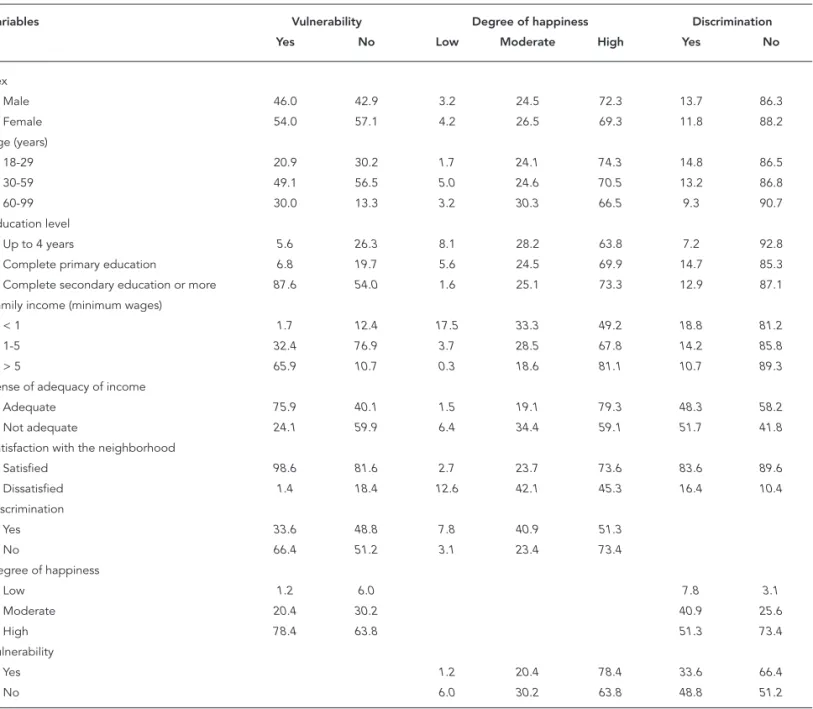
Association between social vulnerability, degree of happiness, sense of discrimination, perception of adequacy of income, satisfaction with the neighborhood, social variables and age. São Paulo central area, Brazil, 2008.
Variables Vulnerability Degree of happiness Discrimination
Yes No Low Moderate High Yes No
Sex
Male 46.0 42.9 3.2 24.5 72.3 13.7 86.3
Female 54.0 57.1 4.2 26.5 69.3 11.8 88.2
Age (years)
18-29 20.9 30.2 1.7 24.1 74.3 14.8 86.5
30-59 49.1 56.5 5.0 24.6 70.5 13.2 86.8
60-99 30.0 13.3 3.2 30.3 66.5 9.3 90.7
Education level
Up to 4 years 5.6 26.3 8.1 28.2 63.8 7.2 92.8
Complete primary education 6.8 19.7 5.6 24.5 69.9 14.7 85.3
Complete secondary education or more 87.6 54.0 1.6 25.1 73.3 12.9 87.1
Family income (minimum wages)
< 1 1.7 12.4 17.5 33.3 49.2 18.8 81.2
1-5 32.4 76.9 3.7 28.5 67.8 14.2 85.8
> 5 65.9 10.7 0.3 18.6 81.1 10.7 89.3
Sense of adequacy of income
Adequate 75.9 40.1 1.5 19.1 79.3 48.3 58.2
Not adequate 24.1 59.9 6.4 34.4 59.1 51.7 41.8
Satisfaction with the neighborhood
Satisfied 98.6 81.6 2.7 23.7 73.6 83.6 89.6
Dissatisfied 1.4 18.4 12.6 42.1 45.3 16.4 10.4
Discrimination
Yes 33.6 48.8 7.8 40.9 51.3
No 66.4 51.2 3.1 23.4 73.4
Degree of happiness
Low 1.2 6.0 7.8 3.1
Moderate 20.4 30.2 40.9 25.6
High 78.4 63.8 51.3 73.4
Vulnerability
Yes 1.2 20.4 78.4 33.6 66.4
No 6.0 30.2 63.8 48.8 51.2
vidual over his/her state including the biological, psychological and social dimensions in health per-spective as welfare 13.
Drever et al. 13 (p. 590) consider that “people are good judges of their own state of health” which makes the self-evaluation a relatively simple out-come for population studies.
As noted by Erikson et al. 14, the choice of non-comparative questions (in general would you say your health is…?) produces an asymmet-ric distribution shifted towards a higher preva-lence of good or excellent health. In this study, in almost all situations analyzed, the perception of good or excellent health, except for people who reported low level of happiness, prevailed. As it is a cross-sectional study it is necessary to consider the phenomenon of reverse causality, so it is not possible to determine if people with a lower de-gree of happiness are more likely to report fair or poor health status or if the opposite occurs, meaning that people with fair or poor health sta-tus have a low degree of happiness, or if both rela-tions are true.
The associations between health status and demographic variables such as age and sex have
been reported in different investigations 15,16,17. The results presented here confirm the inverse relationship between age and health status but do not show significant differences regarding sex, different to the results found by Shibuya et al. 18 in a sample of Japanese population and by Kennedy et al. 15. for the US population. Erikson et al. 14 mention that whatever the measure used, women tend to rate their health worse in all age groups. Subramanian et al. 16 however, found no differ-ences between men and women in a multilevel study including individual and contextual vari-ables, including the degree of happiness. Honjo et al. 17 studying Japanese adults also found no dif-ferences between men and women for the physi-cal health component of SF-12.
Family income and educational level are so-cio-economic variables often used in studies of self-rated health status. All the studies mentioned above found a linear positive relationship between family income and educational level.
Degree of happiness and adequacy of income were introduced in the analysis to understand oth-er dimensions of welfare. The degree of happiness tries to reflect the general satisfaction with life and Table 3
Association between health status and social vulnerability adjusted by age, sex, education, family income and degree of happiness. São Paulo central area, Brazil, 2008.
Variables Unadjusted OR 95%CI Adjusted OR 95%CI
Vulnerability
Yes 2.91 2.14-3.95 1.72 1.10-2.69
No 1.00
Age (years)
18-29 1.00
30-59 1.24 0.86-1.78 1.15 0.76-1.75
60-99 2.48 1.64-3.76 2.80 1.67-4.69
Education level
Up to 4 years 5.08 3.43-7.52 2.83 1.72-4.66
Complete primary education 3.19 2.27-4.49 2.16 1.43-3.26
Complete secondary education or more
1.00
Family income (minimum wages)
< 1 7.96 4.41-14.35 2.47 1.20-5.10
1-5 3.36 2.31-4.89 1.76 1.10-2.82
> 5 1.00
Degree of happiness
Low 11.87 5.26-26.80 5.69 2.34-13.84
Moderate 2.61 1.89-3.59 2.34 1.62-3.38
High 1.00
Table 4
Association between health status and social vulnerability adjusted by age, sex, education, family income and sense of adequacy of income. São Paulo central area, Brazil, 2008.
Variables Unadjusted OR 95%CI Adjusted OR 95%CI
Vulnerability
Yes 2.91 2.14-3.95 1.77 1.14-2.73
No 1.00
Age (years)
18-29 1.00
30-59 1.24 0.86-1.78 1.19 0.79-1.80
60-99 2.48 1.64-3.76 3.08 1.86-5.12
Education level
Up to 4 years 5.08 3.43-7.52 2.53 1.57-4.09
Complete primary education 3.19 2.27-4.49 2.00 1.34-2.98
Complete secondary education or more 1.00 Family income (minimum wages)
< 1 7.96 4.41-14.35 2.81 1.36-5.82
1-5 3.36 2.31-4.89 1.74 1.06-2.84
> 5 1.00
Sense of adequacy of income
Adequate 1.00
Not adequate 2.48 1.85-3.32 1.45 1.01-2.11
OR: odds ratio; 95%CI: 95% confi dence interval.
Table 5
Association between health status and social vulnerability adjusted by age, sex, education, family income and discrimination. São Paulo central area, Brazil, 2008.
Variables Unadjusted OR 95%CI Adjusted OR 95%CI
Vulnerability
Yes 2.91 2.14-3.95 1.75 1.13-2.70
No 1.00
Age (years)
18-29 1.00
30-59 1.24 0.86-1.78 1.26 0.84-1.90
60-99 2.48 1.64-3.76 3.23 1.95-5.36
Education level
Up to 4 years 5.08 3.43-7.52 2.74 1.69-4.45
Complete primary education 3.19 2.27-4.49 2.04 1.37-3.05
Complete secondary education or more 1.00 Family income (minimum wages)
< 1 7.96 4.41-14.35 3.50 1.75-6.97
1-5 3.36 2.31-4.89 2.04 1.29-3.23
> 5 1.00
Discrimination
Yes 1.46 0.95-2.24 1.62 1.02-2.58
No 1.00
evaluate it. The adequacy of income indirectly in-dicates the sense of control over their own lives, or the feeling of having the means to deal with every-day challenges. Both are positively associated with self-reported health status.
Satisfaction with the neighborhood also shows positive association with health status suggesting that the perception that individuals have on the environment in which they reside is a component of welfare and also influences self-rated health status. An inquiry conducted in Buenos Aires in which the contextual variable was the educational level of the head of household in each census tract showed the independent influence of neighbor-hood on health status after adjustment for indi-vidual socio-demographic variables 19.
The multivariate analysis aimed at isolating the effect of the contextual variable and social vulner-ability to other variables obtained at the individual level. After adjusting, all variables remain statis-tically significant. The strength of association be-tween fair or poor health and age (60 years or more) becomes stronger after controlling for socioeco-nomic and welfare suggesting that aging, although it is an immediate determinant of individual health status, also suffers the influence of socioeconomic factors that can reduce its influence.
The gradient observed for educational levels and family income remains constant after control-ling for other variables although the strength of the association is reduced by half. These results show that the introduction of the contextual vari-able, constructed from the compositional effect of socioeconomic variables of families that live in the surveyed areas, reduces the strength of associa-tion between health status and individual socio-economic variables without however, canceling it. These results are consistent with those obtained by Subramanian et al. 16,20 for North American and Chilean communities where the level of family in-come proved to be a determinant of health status after controlling for individual and contextual vari-ables such as inequality in income distribution.
The perception of the level of income (How do you rate your family income nowadays?) in order to meet the family needs almost loses significance after adjusting for other socio-economic variables suggesting that the subjective judgments on the environment are closely related with the prevailing material conditions of social vulnerability. Since this variable shows a significant association with social vulnerability and family income, its effect on health status disappears when these variables are included in the model.
The same happens with the satisfaction with the neighborhood association which is no lon-ger significant after adjustment in a hierarchical model. Poortinga et al. 21 in a survey of a city in
the United Kingdom found that various measures of perception about the quality of neighborhood related to self-rated health loses its significance. In the survey of quality of life of the elderly popula-tion of Great Britain, perceppopula-tions about the neigh-borhood were associated with the self-rated health status remaining significant even after adjusting for socio-economic and socio capital variables 22.
As for the sense of discrimination, negative ste-reotypes that are deeply rooted in culture can be a source of discriminatory behavior even among people who may not be biased and in societies where there are no organized racial, ethnic, sexual or other legal systems 23. The consistency of an in-verse association between perceived discrimina-tion and negative effects on physical and mental health in different population groups in diverse contexts reinforces the assumption that the stress associated with situations of discrimination is re-lated directly and indirectly to health status 23.
The perception of discrimination can affect health directly through physiological repercus-sions of response to chronic stress and indirectly through the adoption of unhealthy behaviors to adapt (coping) to discrimination or noncompli-ance with preventive behaviors 24.
In this study, the sense of discrimination was negatively associated to health status, with an OR significant only after adjusted to the hierarchical model.
The degree of happiness remained significant after adjustment for socioeconomic variables and the contextual variable, maintaining strong asso-ciation with health status. There is, therefore, an independent relationship between the degree of happiness and health. Although it is impossible in a cross-sectional study to establish the direction-ality of this relationship, the association suggests that regardless of social vulnerability, individuals who consider themselves happier also have the best state of health.
Subramanian et al. 16 say that good health and happiness represent critical aspects of individual well-being and appear as goals that all societies and individuals seek. Although both have a com-mon set of factors, there are some peculiarities, such as declining health with age does not neces-sarily cause a decline in the degree of happiness. The multilevel model used by the authors to ana-lyze the determinants of both outcomes in indi-vidual and community levels showed that healthy individuals are more likely to be happy individuals and healthy communities tend to be happy com-munities, and in this case, the relationship be-tween the co-variables is stronger.
tracts is an independent determinant of health status as evidenced in the multivariate analysis. Although it was constructed with information con-cerning the head of household, it had a significant effect on the state of health that does not disappear after adjusting for individual socioeconomic vari-ables. The control for individual variables reduces the strength of association by about 40% showing that the contextual effect is mediated by the char-acteristics of individuals.
The renewed interest in ecological approaches, or studies of clusters, motivated by the research of social determinants of health, led the authors to consider a number of methodological issues and analysis techniques to identify the contextual ef-fects, characteristic or own areas, and composi-tional effects, resulting from the sum of the indi-vidual or family characteristics.
The systematic review by Santos et al. 7 com-ments on the results of 18 epidemiological stud-ies on the association between contextual factors and self-assessment of health status, where 15 showed significant associations between contex-tual (neighborhood features) and self-rated health. These associations support the hypothesis that the context of the areas of housing affects individual health. In all studies, the areas with higher social vulnerability (poverty, inequality, low social capital etc.) contributed to a higher prevalence of fair or poor health status.
There are several mechanisms by which resid-ing in areas with higher social vulnerability can af-fect health. Usually unhealthy behaviors are more prevalent in groups with the lowest socio-eco-nomic levels, access to health services and quality of care can be compromised and the exposure to situations of material deprivation and a potentially stressful environment contribute to the accumula-tion of disadvantages in these populaaccumula-tions 25.
This study has several limitations in part com-mon to household surveys and partly due to its own characteristics. As in any household survey there is the problem related to survival bias, in oth-er words, only individuals who are still alive and liv-ing in the community, in other words, are not insti-tutionalized and can be reached by the interviews. This selection “of the fittest” may underestimate the impact of adverse living conditions on health. Another limitation common to household surveys
is the higher refusal rate among people with better living conditions and the increasing difficulty in accessing them in large urban centers for security reasons. In this paper we try to minimize the im-pact of this aspect by resorting to inverse sampling with pre-draw units for replacement. Still, we had fewer interviews in strata without social vulner-ability. As our main interest was to compare the two groups we believe that these losses should not have significantly changed the results.
Conclusion
Although the downtown area of São Paulo has the best socio-economic indicators of most adminis-trative districts, characterizing the region as low or no social vulnerability, inside there is a great social heterogeneity among regular residents. The com-parison in self-rated health status among residents of census tracts without social vulnerability and residents of census tracts with middle, high or very high social vulnerability showed a significant as-sociation indicating worse health status in vulner-able areas.
The association remained significant even af-ter adjustment for individual socio-economic and demographic variables. Moreover, the degree of happiness, another component of welfare, showed the strongest association with health status. The feeling of discrimination and the perceived ade-quacy of income to meet family needs remained significant but the lower limit of the confidence in-terval of the risk measure has a value close to unity, suggesting that after controlling for other variables these variables such as perceptions, lose strength in the intermediation between the conditions of social vulnerability and health status.
Resumo
O estado de saúde autorreferido de uma amostra de adultos residentes na área central do Município de São Paulo, Brasil, foi estudado comparando-se um grupo de residentes em setores censitários sem vulnerabilidade social, segundo o indicador elaborado pela Fundação SEADE, e um grupo de residentes em setores censitários com média, alta ou muito alta vulnerabilidade social. A idade e o sexo foram utilizados como variáveis de con-trole, enquanto a renda familiar, o grau de escolaridade, o grau de felicidade, a adequação do nível de renda, a satisfação com a vizinhança e a sensação de discrimi-nação foram as variáveis intervenientes selecionadas. Após o ajuste no modelo hierárquico, o estado de saúde autorreferido mostrou associação inversa com a vul-nerabilidade social, idade e sensação de discriminação e relação direta com a renda, a escolaridade, o grau de felicidade. A satisfação com a vizinhança e a adequação do nível de renda perdem significância após o ajuste. O grau de felicidade é a variável com maior força de as-sociação com o estado de saúde mesmo após o controle pelas demais variáveis.
Vulnerabilidade Social; Condições Sociais; Nível de Saúde
Contributors
R. B. Barata participated in all stages of the preparation and execution of the project and article write up. M.C.S.A. Ribeiro participated in all stages of the research design and exection, was responsible for data analysis and was involved in the write up. A. C. Cassanti was responsible for preparing the questionnaire, the literature review and data analysis.
Other members of the Grupo do Projeto Vulnerabilidade Social no Centro de São Paulo
Maria Amélia M. Veras, Karina C. B. Ribeiro, Nivaldo Carneiro Jr., Cássio Silveira, Marta C. de Andrade, Ting Hui Ching, Cecília R. Proença, Karen M. Misawa, Maria Carolina C. Madi, Patrícica A Marques, Denise Andrade (School of Medicine, São Paulo Mercy Hospital – Facul-dade de Ciências Médicas da Santa Casa de São Paulo).
References
1. Centre for Health Development, World Health Or-ganization. Megacities and urban health. Geneva: World Health Organization; 2009
2. Taschner SP, Bógus LMM. São Paulo, uma metró-pole desigual. EURE (Santiago) Revista Latino-americana de Estudios Urbano-Regionales 2001; 27:87-120.
3. Frugoli Jr. H. São Paulo: espaços públicos e intera-ção social. São Paulo: Editora Marco Zero; 1995. 4. Castellanos PL. Epidemiologia, saúde pública,
situação de saúde e condições de vida: conside-rações conceituais. In: Barata RB, editor. Condi-ções de vida e situação de saúde. Rio de Janeiro: ABRASCO; 1997. p. 31-75.
5. Paim JS. Abordagens teórico-conceituais em estu-dos de condições de vida e saúde: notas para refle-xão em ação. In: Barata RB, editor. Condições de vi-da e situação de saúde. Rio de Janeiro: ABRASCO; 1997. p. 7,30.
6. Mossey JM, Shapiro E. Self-rated health: a predic-tor of mortality among the elderly. Am J Public Health 1982; 72:800-8.
7. Santos SM, Chor D, Werneck GL, Coutinho ESF. Associação entre fatores contextuais e auto-avalia-ção de saúde: uma revisão sistemática de estudos multinível. Cad Saúde Pública 2007; 23:2533-54. 8. Barros MBA, Zanchetta LM, Moura EC, Malta DC.
9. Rodrigues CG, Maia AG. Como a posição social influencia a auto-avaliação do estado de saúde? Uma análise comparativa entre 1998 e 2003. Cad Saúde Pública 2010; 26:762-74.
10. Peres MA, Masiero AV, Longo GZ, Rocha GC, Ma-tos IB, Najnie K, et al. Auto-avaliação da saúde em adultos no Sul do Brasil. Rev Saúde Pública 2010; 44:901-11.
11. Idler ER, Benyamini Y. Self-rated health and mor-tality: a review of twenty seven community stud-ies. J Health Soc Behav 1997; 38:21-37.
12. Burström B, Fredlund P. Self-rated health: is it as good a predictor of subsequent mortality among adults in lower as well as in higher social class? J Epidemiol Community Health 2001; 55:836-840. 13. Drever F, Doran T, Whitehead M. Exploring the
re-lation between class, gender and self-rated general health using the new socioeconomic classification. A study using data from the 2001 census. J Epide-miol Community Health 2004; 58:590-6.
14. Erikson I, Unden AL, Elofsson S. Self-rated health. Comparisons between three different measures. Results from a population study. Int J Epidemiol 2001; 30:326-33.
15. Kennedy B, Kawachi I, Glass R, Prothrow-Stith D. Income distribution, socioeconomic status and self-rated health in the United states: multilevel analysis. BMJ, 1998; 317:917-21.
16. Subramanian SV, Kim D, Kawachi I. Covariation in the socioeconomic determinants of self-rated health and happiness: a multivariate multi-level analysis of individuals and communities in the USA. J Epidemiol Community Health 2005; 59:664-9.
17. Honjo K, Kawakami N, Takeshima T, Tachimori H, Ono Y, Uda H, et al. Social class inequalities in self-rated health and their gender and age groups dif-ferences in Japan. J Epidemiol 2006; 16:223-32.
18. Shibuya K, Hashimoto H, Yano E. Individual in-come, income distribution and self-rated health in Japan: cross sectional analysis of nationally repre-sentative sample. BMJ 2002; 324:16-9.
19. Alazraqui M, Roux AVD, Fleischer N, Spinelli H. Salud auto-referida y desigualdades sociales, ciu-dad de Buenos Aires, Argentina, 2005. Cad Saúde Pública 2009; 25:1990-2000.
20. Subramanian SV, Delgado I, Jadue L, Vega J, Kawa-chi I. Income inequality and health: multilevel analysis of Chilean communities. J Epidemiol Community Health 2003; 57:844-8.
21. Poortinga W, Dunstan FD, Fone DL. Perceptions of the neighbourhood environment and self rat-ed health: a multilevel analysis of the Caerphilly Health and Social Needs Study. BMC Public Health 2007; 7:285.
22. Bowling A, Barber J, Morris R, Ebrahim S. Do per-ceptions of neighbourhood environment influ-ence health? Baseline findings from a British sur-vey of aging. J Epidemiol Community Health 2006; 60:476-83.
23. Williams DR, Mohammed SA. Discrimination and racial disparities in health: evidence and needed research. J Behav Med 2009; 32:20.
24. Pascoe EA, Richman LS. Perceived discrimination and health: a meta-analysis review. Psychol Bull 2009; 135:531-54.
25. Syed HR, Dalgard OS, Hussain A, Dalen I, Claussen B, Ahlberg NL. Inequalities in health: a compara-tive study between ethnic Norwegians and Paki-stanis in Oslo, Norway. Int J Equity Health 2006; 5:7.
Submitted on 26/Jun/2010