* Corresponding author: T. U. Andrade. Universidade Vila Velha. Rua Co-missário José Dantas de Melo, 21 - Boa Vista - 29102-770 - Vila Velha - ES, Brazil. E-mail: [email protected]
A
vol. 52, n. 1, jan./mar., 2016 <http://dx.doi.org/10.1590/S1984-82502016000100011
Level of satisfaction of clients of public pharmacies dispensing
high-cost drugs in Espírito Santo, Brazil
Karla Oliveira dos Santos Cassaro, Otávio Arruda Heringer, Márcio Fronza, Dominik Lenz, Denise
Coutinho Endringer, Tadeu Uggere de Andrade
*Department of Pharmaceutical Sciences, University Vila Velha, Vila Velha, ES, Brazil
The aim of this study was to evaluate the level of satisfaction of pharmaceutical services and to determine the socioeconomic proile of public pharmacy clients. This is a cross-sectional observational study using a quantitative approach. The sample was calculated from the monthly number of patients seen in pharmacies and was stratiied for each pharmacy. Data were analysed using SPSS 11.5 software and by observing the simple relative frequencies for qualitative variables. For the quantitative variables, the analysis of variance (ANOVA) and post-hoc Fisher tests were performed. Data are expressed as mean ± standard deviation (SD). The results show that, in general, patients at “Farmácias cidadãs” are satisied with the services. However, when stratiied, we found that the greatest satisfaction was related only to structural and organizational aspects, while the pharmaceutical services are unsatisfactory. When relating satisfaction to the socioeconomic characteristics, a diference between waiting time (39.07 ± 19.53), attendance by pharmacist (8.91 ± 5.14) and education was observed. It is concluded that users are satisied with the services of state “Farmácias cidadãs” of Espírito Santo, but there should be improvements in relation to pharmaceutical services and the interpersonal relationships between health professionals and users of the public health system in Brazil.
Uniterms: Public Pharmacy. Uniied Health System. Pharmaceutical Services.
O objetivo do presente estudo foi avaliar o nível de satisfação dos serviços farmacêuticos e a determinação do peril socioeconômico de clientes de farmácias públicas. Trata-se de um estudo observacional transversal com abordagem quantitativa. A amostra foi calculada através de dados da quantidade mensal de pacientes atendidos nas farmácias e estratiicada para cada unidade do Estado. Os dados foram analisados por meio programa SPSS 11.5, observando-se as frequências relativas simples para as variáveis qualitativas. Para as variáveis quantitativas efetuaram-se análise de variância de uma via (ANOVA) e teste post-hoc de Fisher. Os dados foram expressos como a média ± desvio padrão (DP). Os resultados revelam que, em geral, os usuários atendidos nas farmácias cidadãs estão satisfeitos com os serviços, porém, quando estratiicado por pergunta, avaliou-se que a maior satisfação está relacionada apenas aos aspectos estruturais e organizacionais e que o serviço farmacêutico é insatisfatório. Quando relacionada à satisfação com as características socioeconômicas, observou-se diferença entre tempo de espera (39.07 ± 19.53), de atendimento pelo farmacêutico (8.91 ± 5.14) e escolaridade. Conclui-se que os usuários estão satisfeitos com os serviços das farmácias cidadãs estaduais do Espírito Santo, porém deve haver melhora em relação ao atendimento farmacêutico e à relação interpessoal entre proissionais de saúde e usuários do sistema público de saúde brasileiro.
INTRODUCTION
The level of satisfaction reflects the quality of healthcare offered, as well as the preferences and expectations of users in relation to the health system (Halal et al., 1994; Kucukarlan, Schommer, 2002; Larson, Roves, MacKeigan, 2002). Therefore, it has become increasingly
important to evaluate the level of user satisfaction in relation to services provided by health professionals, which could be used as a quality indicator to improve these services (Halal et al., 1994; Kucukarlan, Schommer, 2002; Larson, Roves, MacKeigan, 2002; Marin, 2003).
The user satisfaction can be considered a connection between users and professionals when aiming to correct
or improve the work of the health professionals (Oliveira,
Guirardello, 2006). Furthermore, the user satisfaction data
may improve the work of managers of the public health system (Espiridião, Trad, 2005; Benazzi, Figueiredo,
Banassi, 2010). Thus, the level of satisfaction of users of a health service could be converted into indicators of quality to promote an improvement in this service.
Recent studies show that users become more satisied
with the services of a pharmacy when the pharmacist interacts with them and gives clear explanations about
the medications (Al-Arii, 2012; Alturki, Khan, 2013). Alturki and Khan (2013) found that 61.2% of users
expressed dissatisfaction, as they did not understand the
information provided by the pharmacist. In addition, Catic, Jusufovic and Tabakovic (2013) showed that the
features most appreciated by users about the pharmacist were the explanations and providing appropriate responses
(79.1%), followed by consultation offered by these
professionals who clearly informed the patient about the
drugs proposed by the physician. In the present study,
we evaluated the relationship between the user and the pharmaceutical services for potential improvements at the level of individual pharmaceutical care. This was already
proven by the Association of Pharmacists in Bosnia and Herzegovina (Catic, Jusufovic, Tabakovic, 2013).
The Brazilian Uniied Health System is recognized
as one of the most extensive and comprehensive public
health systems in the world. It ranges from simple
queries to highly complex procedures, such as transplants
(Portal da Saúde, 2013) and there is a law that ensure
free universal access (Brasil, 1990). Health services in
the Uniied Health System aim to protect public health.
Therefore, this law regarding pharmaceutical services has become an integral part of the system (Brasil, 1990), because drugs are considered the main instrument for treating diseases, and thus have a substantial impact on public health (Espírito Santo, 2012).
In 2004, by resolution of the National Health Council No. 338 of May 6, 2004, the Ministry of Health established the National Pharmaceutical Assistance Policy
to ensure access to medicines, their rational use and to qualify the services provided by pharmaceutical sectors
in Brazil (Brasil, 2004). In 2007, the Pharmaceutical Services (PS) was divided into three components: basic,
strategic and specialized components, the latter regulated by decree GM/MS No. 2981 of November 26, 2009, in order to facilitate access to high cost drugs or for rare
diseases (Brasil, 2010). In the state of Espírito Santo, these
medications are dispensed by “Farmácias cidadãs”. The “Farmácias cidadãs” of the state of Espírito
Santo were imposed by Decree No. 1956-R 7 in 2007,
which promotes drug dispensing, i.e. high-cost drugs that are of great importance to the users are provided in the entire state (Espírito Santo, 2007). All over Espirito Santo, there are nine “Farmácias cidadãs” (Espírito Santo, 2012). These pharmacies have a whole aspect of internal environment aiming to provide proper care and there are
drugs available for treatment of 335 different diseases (Espírito Santo, 2013). The entire project is geared towards
the humanization of pharmaceutical care, in addition to
providing specialized pharmacists and qualiied services.
However, no study has been conducted to verify
whether the “Farmácias cidadãs” fulil the requirements for
which they were founded. Therefore, assuming that the level of user satisfaction is an important tool for evaluation of health services, this study aimed to evaluate the satisfaction of citizens that attended “Farmácias cidadãs” and its relationship with certain selected socioeconomic data.
MATERIAL AND METHODS
Study design and sampling
This is a cross-sectional observational study using a quantitative approach, in which data were collected using a structured questionnaire. Moreover, socioeconomic data were evaluated using variables, including age, gender, median household income, education, and monthly family income. Other estimated variables, including waiting time, attendance time by the pharmacist, source of the prescription and the drug-dispensing service, were also assessed to evaluate the satisfaction of the users of the “Farmácias cidadãs”.
The sample size was calculated taking into account the number of monthly visits (23,167) in 2010 in the
nine surveyed pharmacies (Espírito Santo, 2012). Then,
size was 376 individuals. Considering a possible loss of 20%, the amount of participants was increased to 451
users (Benazzi, Figueiredo, Banassi, 2010). Subsequently, data were stratified for pharmacies. A sample of each
pharmacy was stratiied based on the local population of
each municipality.
The way the present research was carried out can be considered biased, as the recruitment of patients was not randomized because patients participated only when they
agreed to take part.
Sample Selection
Convenience sampling was adopted for patients and caregivers who sought care in “Farmácias cidadãs” of their respective municipality. Users or carers who attended a “Farmácia cidadã”, residents in the state of Espírito Santo, aged at least 18 years and who could respond to the proposed questionnaire were included.
Patients were addressed upon arrival at the pharmacy
and informed about the research. Those who agreed to participate received a questionnaire and the instructions. At the end of the documentation, the participants returned the questionnaires and consent forms.
Local service evaluation
“Farmácias cidadãs” of Espírito Santo are located
in nine diferent cities. Each pharmacy was visited in the irst week of a given month in order to assess the highest
number of users. The users in the pharmacies were invited to participate in the study. After accepting the invitation and signing the consent form, the questionnaire was presented to users and/or their guardians. The same researcher distributed the questionnaires in all pharmacies. To analyse the variables of waiting time and attendance
by the pharmacist, patients were asked about the time of
arrival and attendance.
Analysis of the level of satisfaction
To assess the satisfaction of users, a structured questionnaire was applied, i.e. the “Satisfaction
Questionnaire with Pharmacy Services”, which was
designed and implemented primarily by Kucukarslan and
Schommer (2002) and adapted, translated and validated
for the Portuguese language by Correr et al. (2009). This questionnaire assessed both the services provided by the pharmacist and the pharmacy services in
general. The intensity scale had a ive-point Likert-type
scale for each question (total of 20), where the lower number represents the “very bad” option and the higher number the “very good” option. The respondents then chose the answer that best represented their opinion. The level of satisfaction is expressed as the mean ± standard deviation (SD) for each question and the questionnaire as a whole, both in each pharmacy and as the sum of all pharmacies. The users were
also classiied as satisied (score equal to or greater than 4) and not satisied (score less than 4).
Ethical criteria
The study was approved by the Ethics and Human
Research Board of the University Vila Velha (UVV-CEP), process number 46,148 in June 2012.
Statistical analysis
Statistical analyses were performed using the
Statistical Package for Social Sciences (SPSS 17.0).
Satisfaction data, standby time and attendance were expressed as mean ± standard deviation (SD). The
Kolmogorov-Smirnov normality test was used to evaluate the continuous variables (Table I). To evaluate the
distribution of the data, descriptive statistics were applied,
and analysis of variance (ANOVA) to detect diferences
between the means of questions and questionnaires,
followed by Tukey’s test. The Chi-square test was used
to compare frequencies of socioeconomic variables with
the percentage of satisied and dissatisied users. When the correlation of the variables had less than ive members, the
Fisher test was used to compare frequencies. The level of
signiicance for the tests was p < 0.05.
RESULTS AND DISCUSSION
Socioeconomic data
Of all participants, 408 met the inclusion criteria.
The most frequent reason for exclusion was a missing
TABLE I - Kolmogorov-Smirnov normality test.
Kolmogorov-Smirnov normality test (p-value)
signature on the informed consent or incorrect completion of the questionnaire of pharmaceutical services. Of the
users, 250 (62%) were female and 158 patients (38%)
male. Several studies have shown that healthcare is more important for women than men, which may explain the
higher frequency of women (Mendoza-Sassi, Beria, 2001;
Ribeiro et al., 2006; Benazzi, Figueiredo, Banassi, 2010; Catic, Jusufovic, Tabakovic, 2013).
The most frequent average monthly household
income was 1–2 minimum wages (54.5%), as shown by previous studies (Silva, Muccioli, Belfort Jr., 2004; Gomes et al., 2008). The age group with the highest frequency
was 35–49 years (42.9%), followed by 50–60 years (26.5%), and 18–34 years (18.6%). Twelve per cent of the
respondents were older than 60 years. Most of the subjects
had completed high school (41.7%), followed by 19.9%
who had completed higher-level education.
T h e m a j o r i t y o f f o r m e r s t u d i e s s h o w e d a predominance of users and/or carers with low education (Castellano et al., 1999; Colossi, 2004). However, as in the present work, there are reports of a prevalence
of individuals with higher-level education (Herc,
Berezovsky, 2006; Benazzi, Figueiredo, Banassi, 2010). These data show a change in the proile of patients that
attended public pharmacies, what had been considered only for the disadvantaged clients, according to Benazzi, Figueiredo and Banassi (2010).
Table II shows the average waiting times of the users (39.07 ± 19.53 min) and the time they were efectively attended to by the pharmacist (8.91 ± 5.14 min). Three pharmacies (A, F and I) had waiting times above the average (p < 0.01).
Of all users surveyed, 385 (95.5%) received
medications. The other users had no medication dispensed
mainly due to incomplete documentation (66.7%). In relation to the prescriptions, 225 (56%) were from the Public Health System and 44% were from Privates Health
Systems.
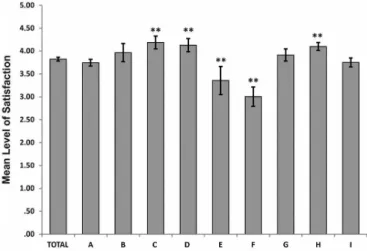
Satisfaction
The overall satisfaction level was 3.80 ± 0.3,
indicating a medium level of satisfaction. The general satisfaction data are shown in Figure 1, and the scores for each question of the satisfaction questionnaire are shown
in Table II.
The results show that most users were satisied with
the services provided in the “Farmácias cidadãs”. Cerdá et al. (2005) described that there is an interaction between user satisfaction and their health condition. However, according to Benazzi, Figueiredo and Banassi (2010) a satisfaction survey is a complex issue because of the use of the client opinion as a tool of the study to evaluate a health service. Cerdá et al. (2005) stated that variables related to the dispensing and organization of the health sector could also help to improve customer satisfaction.
Indeed, despite an overall score that can be
considered good, when analysing the questionnaire items separately, it can be observed that the lowest scores were related to aspects involved with the pharmacist (items 7,
8, 9, 10, 11, 12, 15, 18 and 19 of the questionnaire, Table III), i.e. related to the pharmaceutical management of the therapy. This is in agreement with data regarding the USA
(Larson, Roves, MacKeigan, 2002) and Brazil (Correr et al., 2009). In the work of Alturki and Khan (2013), users
TABLE II - Waiting times at pharmacies and time with pharmacist
Pharmacies Waiting time (min) Mean ± SD
Time attended by the pharmacist (min)
Mean ± SD
TOTAL 39.07 ± 19.53 8.91 ± 5.14
A 50.48 ± 18.65** 7.84 ± 4.06
B 9.78 ± 5.93** 6.65 ± 3.19
C 16.80 ± 8.02** 9.84 ± 7.54
D 1.19 ± 2.18** 4.62 ± 2.80**
E 0.71 ± 1.89** 8.75 ± 2.50
F 39.48 ± 29.38 11.38 ± 3.76*
G 25.35 ± 17.61** 8.65 ± 4.84
H 21.52 ± 25.94** 10.03 ± 6.41*
I 76.71 ± 26.26** 10.38 ± 4.88*
Data are expressed as mean ± standard deviation (SD). **p < 0.01 and *p < 0.05 compared to the total average.
FIGURE 1 - Patient satisfaction with pharmaceutical services
were satisied with the service provided by the pharmacist,
but often did not understand the information that was provided to them. Andrade et al. (2009) demonstrated that the satisfaction level with the pharmaceutical services was improved with the presence of specialized pharmaceutical care services. Thus, the results of this study indicate that the organization of the pharmacy, physical space and the
professionalism of the staf may have been relevant to the
overall average factors.
Additionally, one can infer the need for training of the pharmacists in clinical care so that the user satisfaction evaluation can achieve a level of excellence.
Satisfaction and socioeconomic variables
The results expressed in scatter plots that relate the waiting time to the satisfaction demonstrate that the higher the waiting time, the lower the satisfaction of the clients (Figure 2). The longer the clients were attended to
by the pharmacists, the less they were satisied (Figure 3).
Cerdá et al. (2005) also found that the longer the waiting time of the user, the lower the satisfaction, even with the public health services, corresponding to the lowest scores
of their work.
There was a weak negative correlation between
waiting time and user satisfaction (Figure 2). These data indicate that these parameters may not be the most important factor in determining the level of satisfaction.
Likewise, the weak negative correlation between attending
time and user satisfaction could be explained by the
high variation in results between diferent pharmacies.
Moreover, when data were categorized, a significant correlation between satisfaction and waiting time was
observed (Table II). The same occurred with the attending
time by the pharmacist. Clients that were attended to for
more than 15 minutes were less satisfied. Although it
seems paradoxical that the time with the pharmacist should reduce the level of satisfaction, it is possible that this time is being interpreted only as an additional waiting time for obtaining medication, since the dispensation may not be carried out with proper patient education.
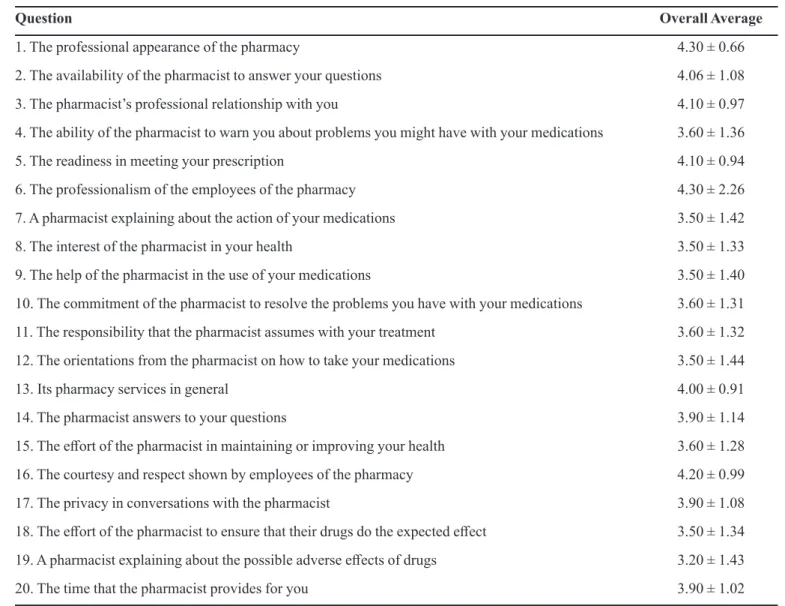
The general satisfaction data related to the variables
of the questionnaire are shown in Table III. It can also
be observed that satisfaction is also related to higher education. This may be related to better understanding about drugs and/or better access to information other than the pharmacist, such as physicians, thus improving treatment adherence (Dewulf et al., 2006).
Variables such as family income may directly afect user satisfaction (Silva, Muccioli, Belfort Jr., 2004). Previous studies have shown that satisfaction surveys of users of the Uniied Health System mostly involve low-income users who cannot aford private health insurance (Silva, Muccioli, Belfort Jr., 2004; Gomes et al., 2008). However, this factor was not important in determining the level of satisfaction in this study, given that the percentage of satisfied users did not change significantly with
increasing income (Table IV). This fact may be related to the diferentiated service that is ofered by “Farmácias cidadãs” in which the user, even with a better inancial situation, cannot aford the high cost of drugs.
For further studies, it would be interesting to assess
FIGURE 3 - Scatter plot of the time with the pharmacist (min) vs. user satisfaction of the ”Farmácias cidadãs” in Espírito Santo (p < 0.001).
the patient’s understanding of the pharmacist’s role in the Public Health System because it was one of the
limitations faced in the initial interview. Many patients do not understand the role of this professional in the
public system, a fact that may have caused diiculties in
answering the questionnaire.
The data gathered for the present study demonstrate the importance of the pharmacist in the health system and can be extrapolated to other regions of the country where the distribution system and organization are similar to Espírito Santo.
CONCLUSION
We conclude that the model of pharmaceutical services provided in “Farmácias cidadãs” in the state of
Espírito Santo is satisfactory for users, especially in regard to structural and organizational issues. There should be an improvement in the pharmaceutical services provided by the pharmacists. This would improve the rational use of medicines, thus avoiding negative clinical outcomes associated with them, as well as contributing to achieving a better health service.
ACKNOWLEDGEMENTS
We thank the “Fundação de Amparo à Pesquisa e
Inovação do Espírito Santo (FAPES)” for granting the
scholarship and to FAPES/CNPq/MS-Decit/SESA for the finantial support to the study (PPSUS. Processo nº
65835131/2014).
TABLE III - Mean of overall satisfaction level for each item of the Satisfaction Questionnaire with Pharmacy Services
Question Overall Average
1. The professional appearance of the pharmacy 4.30 ± 0.66
2. The availability of the pharmacist to answer your questions 4.06 ± 1.08
3. The pharmacist’s professional relationship with you 4.10 ± 0.97
4. The ability of the pharmacist to warn you about problems you might have with your medications 3.60 ± 1.36
5. The readiness in meeting your prescription 4.10 ± 0.94
6. The professionalism of the employees of the pharmacy 4.30 ± 2.26
7. A pharmacist explaining about the action of your medications 3.50 ± 1.42
8. The interest of the pharmacist in your health 3.50 ± 1.33
9. The help of the pharmacist in the use of your medications 3.50 ± 1.40
10. The commitment of the pharmacist to resolve the problems you have with your medications 3.60 ± 1.31
11. The responsibility that the pharmacist assumes with your treatment 3.60 ± 1.32 12. The orientations from the pharmacist on how to take your medications 3.50 ± 1.44
13. Its pharmacy services in general 4.00 ± 0.91
14. The pharmacist answers to your questions 3.90 ± 1.14
15. The efort of the pharmacist in maintaining or improving your health 3.60 ± 1.28
16. The courtesy and respect shown by employees of the pharmacy 4.20 ± 0.99
17. The privacy in conversations with the pharmacist 3.90 ± 1.08
18. The efort of the pharmacist to ensure that their drugs do the expected efect 3.50 ± 1.34 19. A pharmacist explaining about the possible adverse efects of drugs 3.20 ± 1.43
20. The time that the pharmacist provides for you 3.90 ± 1.02
REFERENCES
AL-ARIFI, M.N. Patients’ perception, views and satisfaction with pharmacists’ role as health care provider in community pharmacy setting at Riyadh, Saudi Arabia. Saudi Pharm. J., v.20, n.1, p.323-330, 2012.
ALTURKI, M.; KHAN, T.M.A study investigating the level of satisfaction with the health services provided by the Pharmacist at ENT hospital, Eastern Region Alahsah, Kingdom of Saudi Arabia. Saudi Pharm. J., v.21, n.1, p.255-260, 2013.
ANDRADE, T.U.; BURINI, D.M.; MELLO, M.O.; BERSACULA, N.S.; SALIBA, R.A.D.; BRAVIM, F.T.; BISSOLI, N.S. Evaluation of the satisfaction level of patients attended by a Pharmaceutical Care Program in a Private Communitarian Pharmacy in Vitória (ES, Brazil). Braz. J. Pharm. Sci., v.45, n.2, p.349-355, 2009.
BENAZZI, L.E.B.; FIGUEIREDO, A.C.L.; BANASSI, D.G. Avaliação do usuário sobre o atendimento oftalmológico oferecido pelo SUS em um centro urbano no sul do Brasil. Ciên. Saúde Col., v.15, n.3, p.861-868, 2010.
TABLE IV - General correlation between socioeconomic variables, attendance data and dispensing of medications with the satisfaction of the users of the “Farmácias cidadãs”
Variables
Patient satisfaction
p-value
Unsatisied Satisied
N % N %
Waiting time 0.002
Less than 60 minutes 57 16.1 296 83.9
More than 60 minutes 17 34.7 32 65.3
Attendance time by the pharmacist 0.009
Less than 5 minutes 21 12.1 153 87.9
From 5 to 15 minutes 44 22.0 156 78.0
More than 15 minutes 8 32.0 17 68.0
Source of prescription 0.703
Uniied Health System 44 19.6 180 80.4
Private 30 16.9 147 83.1
Education 0.008
Incomplete primary education 20 26.7 55 73.3
Completed primary education 10 18.2 45 81.8
Completed high school 30 16.0 158 84.0
Higher education 11 13.6 70 86.4
Monthly family income 0.739
Less than 1 minimum wage 2 20.0 8 80.0
From 1 to 2 minimum wages 43 20.0 172 80.0
From 3 to 5 minimum wages 20 16.5 101 83.5
From 6 to 10 minimum wages 4 11.1 32 88.9
More than 10 minimum wages 2 15.4 11 84.6
Dispensation of medication 0.750
Yes 70 18.4 311 81.6
BRASIL. Lei n.8.080, de 19 de setembro de 1990. Dispõe sobre as condições para a promoção, proteção e recuperação da saúde, a organização e o funcionamento dos serviços correspondentes e dá outras providências. Diário Oicial da União, Brasília, 20 set. 1990. Seção I, p.18055.
BRASIL. Ministério da Saúde. Resolução CNS n.338, de 06 de maio de 2004. Aprova a Política Nacional de Assistência Farmacêutica. Diário Oicial da União, Brasília, n.96, 20 maio 2004. Seção I.
BRASIL. Ministério da Saúde. Secretaria de Ciência, Tecnologia e Insumos Estratégicos. Departamento de Assistência Farmacêutica e Insumos Estratégicos. Da excepcionalidade às linhas de cuidado: o componente especializado da Assistência Farmacêutica. Brasília: Ministério da Saúde, 2010. 262p. (Série B. Textos Básicos de Saúde).
CATIC, T.; JUSUFOVIC, F.I.; TABAKOVIC, V. Patients perception of community pharmacist in Bosnia and Herzegovina. Mat. Socio-Med., v.25, n.3, p.206-209, 2013.
CERDÁ, J.M.V.; GIMENO, G.S.; BOQUET, E.M.; VILLALBA, E.M.F.; ALMINÃNA, M.A. Satisfacción percebida por usuários infectados por la VUH conlaunidad de atención farmacêutica a usuários externos (UFPE). Farm. Hosp., v.29, n.2, p.134-139, 2005.
CASTELLANO, A.G.; MOREIRA, L.B.; KAIMOTO, T.; MOREIRA, H. Aspectos socioeconômicos em usuários portadores de vício de refração. Arq. Bras. Oftalmol., v.62, n.6, p.697-700, 1999.
COLOSSI, C. G. Perfil socioeconômico dos usuários submetidos a cirurgia oftalmológica pelo Sistema Único de Saúde em um serviço credenciado na cidade de Porto Alegre. São Paulo, 2004. 98p. [Dissertação de Mestrado - Escola Paulista de Medicina - Universidade Federal de São Paulo].
CORRER, C.J.; PONTAROLO, R.; MELCHIORS, A.C.; SOUZA, R.A.P.; ROSSIGNOLI, P.; FERNÁNDEZ-LLIMÓS, F. Satisfação dos usuários com serviços da farmácia: tradução e validação do pharmacy services questionneire para o Brasil. Cad. Saúde Pública, v.25, n.1, p.87-96, 2009.
DEWULF, N.L.S.; MONTEIRO, R.A.; PASSOS, A.D.C.; VIEIRA, E.M.; TRONCON, L.E.A. Adesão ao tratamento medicamentoso em pacientes com doenças gastrintestinais crônicas acompanhados no ambulatório de um hospital universitário. Rev. Bras. Ciên. Farm., v.42, n.4, p.575-584, 2006.
ESPIRIDIÃO, M.; TRAD, L.A.B. Avaliação da satisfação de usuários. Ciên. Saúde Col., v.10 (supl.), p.303-312, 2005.
ESPÍRITO SANTO. Secretaria de Saúde. Gerência Estadual da Assistência Farmacêutica. Parâmetros e orientações gerais para implantação de farmácia cidadã na atenção primária à saúde. Available at: <http://farmaciacidada. saude.es.gov.br/download/Parametros_e_Orientacoes_ para_Implantacao_da_Farmacia_Cidada_Municipal.pdf. www.saude.es.gov.br>. 2012>. Accessed on: Ago. 2014.
ESPÍRITO SANTO. Secretaria de Saúde. Gerência Estadual da Assistência Farmacêutica. Farmácia Cidadã Estadual:
mais eiciência no serviço à população. Available at: <http:// www.es.gov.br/Noticias/165761/farmacia-cidada-estadual-mais-eiciencia-no-servico-a-populacao.htm. www.saude. es.gov.br>. Accessed on: Ago. 2014
GOMES, B.A.F.; BIANCARDI, A.L.; NETTO, C.F.; GAFFREE, F.F.P.; MORAES JUNIOR, H.V. Perfil socioeconômico e epidemiológico de usuários submetidos à cirurgia de catarata em um hospital universitário. Rev. Bras. Oftalmol., v.67, n.5, p.220-225, 2008.
HALAL, I.S.; SPARRENBERGER, F.; BERTONI, A.M.; CIACOMET, C.; SEIBEL, C.E.; LAHUDE, F.M.; MAGALHÃES, G.A.; BARRETO, L.; LIRAR, C.A. Avaliação da qualidade de assistência primária à saúde em localidade urbana da região sul do Brasil. Rev. Saúde Pública, v.28, n.2, p.131-136, 1994.
HERCOS, B.V.S.; BEREZOVSKY, A. Qualidade do serviço oftalmológico prestado aos usuários ambulatoriais do Sistema Único de Saúde – SUS. Arq. Bras. Oftalmol., v.69, n.2, p.213-219, 2006.
KUCUKARSLAN, S.; SCHOMMER, J.C. Patients’ expectations and their satisfaction with pharmacy services. J. Am. Pharm. Assoc., v.42, n.3, p.489-895, 2002.
MARIN, N., (Org.). Organização Pan-Americana de Saúde. Organização Mundial da Saúde. Assistência farmacêutica para gerentes municipais. Rio de Janeiro: OPAS: OMS, 2003. 334p.
MENDOZA-SASSI, R.; BÉRIA, J.U. Utilización de losservicios de salud: uma revisiónsistematica sobre losfactores relacionados. Cad. Saúde Pública, v.17, n.4, p.819-832, 2001.
OLIVEIRA, A.M.L.; GUIRARDELLO, L.B. Satisfação do paciente com os cuidados de enfermagem: comparação entre dois hospitais. Rev. Escola Enferm. USP, v.40, n.1, p.71-77, 2006.
RIBEIRO, M.C.S.A.; BARRETO, R.B.; ALMEIDA, M.F.; SILVA, Z.P. Peril sociodemográico e padrão de utilização de serviços de saúde para usuários e não usuários do SUS – PNAD 2003. Cad. Saúde Pública, v.11, n.4, p.1011-1022, 2006.
SILVA, L.M.P.; MUCCIOLI, C.; BELFORT Jr., R. Perfil socioeconômico e satisfação dos usuários atendidos no mutirão de catarata do Instituto de Visão - UNIPESP. Arq. Bras. Oftalmol., v.67, n.5, p.727-734, 2004.
Received for publication on 13th August 2014