Work carried out at the Hospital das Clínicas, Universidade de São Paulo - USP. 1Physician, Division of Ophthalmology, Hospital das Clínicas, Universidade de São Paulo
-USP - São Paulo (SP), Brazil.
Correspondence address: Frederico Castelo Moura. Rua Pedroso Alvarenga, 1.077 - São Paulo (SP) - CEP 04531-012 - E-mail: fredcastelo@ terra.com.br
Recebido para publicação em 22.03.2010 Última versão recebida em 25.07.2010 Aprovação em 06.08.2010
Relationship between visual field sensitivity loss and quadrantic macular
thickness measured with Stratus-Optical coherence tomography
in patients with chiasmal syndrome
Correlação entre defeito de campo visual e espessura macular quadrântica avaliada através da
tomografia de coerência óptica em pacientes com compressão quiasmática
FREDERICO CASTELO MOURA1, LUCIANA VIRGINIA FERREIRA COSTA-CUNHA1, ROBERTO FREIRE SANTIAGO MALTA1, MÁRIO LUIZ RIBEIRO MONTEIRO1
ABSTRACT
Purpose: To correlate visual field sensitivity (VFS) loss on standard automated perimetry (SAP) and quadrantic macular thickness on optical coherence tomo-graphy (OCT) in patients with permanent temporal hemianopia from chiasmal compression.
Methods: Forty eyes from 40 patients with chiasmal compression and 40 healthy eyes were submitted to standard automated perimetry and Stratus-OCT scanning. Raw data of the fast macular thickness scanning protocol were exported and macular thickness measurements were recorded and averaged for each quadrant and half of the central area. The correlation between visual field sensitivity loss and optical coherence tomography measurements was tested with Pearson’s correlation coefficients and with linear regression analysis. Results: A significant association was found between each macular thickness parameter and the corresponding central VF mean sensitivity. The strongest association was observed between superonasal macular thickness and the inferotemporal mean defect measured both in decibel (R=0.47; p=0.001) and in 1/Lambert (R=0.59; p<0.0001) units.
Conclusion: Stratus-OCT-measured macular thickness was topographically related with visual field sensitivity loss in patients with temporal hemianopia from chiasmal compression. Such measurements could prove clinically useful in the diagnosis and follow-up of patients with chiasmal compression.
ClinicalTrial.gov identifier number: NCT0039122.
Keywords: Tomography, optical coherence; Perimetry; Optic atrophy; Optic chiasm; Hemianopsia; Visual fields
RESUMO
Objetivo: Avaliar a correlação entre o defeito de campo visual ao exame de perimetria computadorizada e a espessura macular quadrântica ao exame de tomografia de coerência óptica (OCT) em pacientes com hemianopsia tem-poral permanente causada por compressão quiasmática.
Métodos: Quarenta olhos de 40 pacientes com compressão quiasmática e 40 olhos de 40 indivíduos controles foram submetidos aos exames de perimetria computadorizada e tomografia de coerência óptica. Dados não processados foram exportados e as medidas de espessura macular foram calculadas para cada quadrante e metade da área macular central. A correlação entre o defeito campimétrico e as medidas de espessura macular foi avaliada por coeficiente de correlação de Pearson e por análise de regressão linear.
Resultados: Associação significante foi encontrada entre os parâmetros de espessura macular e seus respectivos defeitos campimétricos. A correlação mais forte foi encontrada entre o parâmetro espessura macular nasal superior e o defeito campimétrico médio temporal inferior medido em decibel (R=0,47; p=0,001) e em 1/Lambert (R=0,59; p<0,0001).
Conclusão: Medidas de espessura macular avaliada através da tomografia de coerência óptica foi topograficamente relacionada ao defeito campimétrico em pacientes com hemianopsia temporal por compressão quiasmática. Estas medidas podem provar a importância clínica no diag-nóstico e seguimento dos pacientes com compressão quiasmática. ClinicalTrial.gov identifier number: NCT0039122.
Descritores: Tomografia de coerência óptica; Perimetria; Atrofia óptica; Quias-ma óptico; Hemianopsia; Campos visuais
related peripapillary RNFL thickness with VF loss measured on standard automated perimetry (SAP).
The pattern of the neuronal damage in chiasmal compression represents an important model for studies assessing instruments for the measurement of retinal structures and provides informa-tion for the investigainforma-tion of structure-funcinforma-tion relainforma-tionships in non-glaucomatous optic neuropathies. In patients with long-standing extensive mid-chiasmal lesions the crossed nerve fibers are lost with preservation of the uncrossed nerve fibers, which originate in the temporal hemiretina and penetrate the optic nerve through the superior and inferior arcuate fiber bundles. Thus, RNFL loss occurs predominantly on the nasal and temporal side of the optic disc, a pattern identified on ophthalmoscopy as band atrophy (BA) of the optic nerve(8). Distinctive changes may
also be observed in the RGC layer, with severe loss occurring in the hemiretina nasally to the macula and relative preservation on the temporal side. Using optical coherence tomography (OCT), we and others were able to document both RNFL loss around the nerve and RGC loss in the nasal hemiretina of eyes with this pattern of neuronal loss(9-13).
INTRODUCTION
S
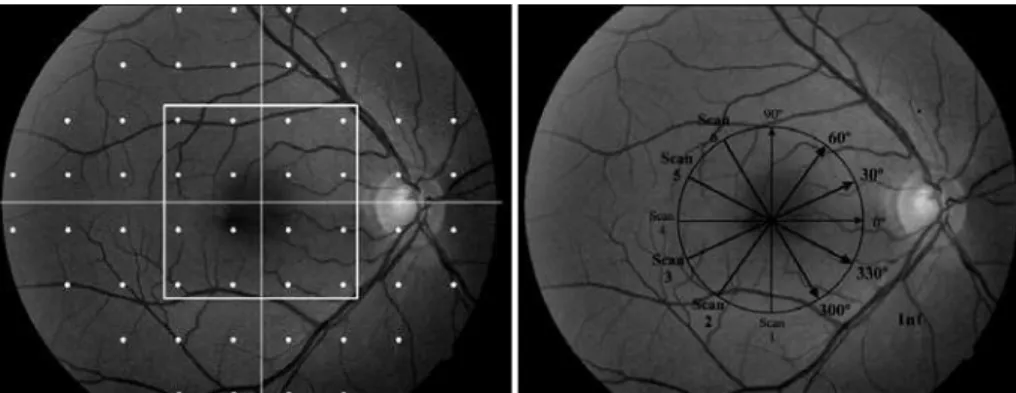
tudies evaluating the relationship between visual function and the extent of axonal loss using retinal nerve fiber layer (RNFL) and macular thickness measurements are for the important diagnosis and monitoring of anterior visual pathway diseases. A spatial correspondence between retinal ganglion cell (RGC) loss and visual field (VF) defect in patients with glau-coma has been reported by several authors(1-4). However, only acor-Figure 1. Left; demarcation of points read on 24-2 standard automated perimetry. The 16 points contained in the central square correspond to the area covered by Stratus optical coherence tomography scans. Right; schematic model showing the scanning orientation and the sequence of scans used to calculate macular thickness.
one with less than 33% fixation losses, false-positive and false negative responses. Patients with clinical signs of glaucoma or optic disc anomaly were excluded.
Patients with BA of the optic nerve had complete or partial temporal hemianopia on Humphrey perimetry, and a nasal hemifield within normal limits on both tests. Only one eye of each patient was selected for analysis. For the patients in whom both eyes fulfilled the inclusion criteria, 1 eye was randomly selected for analysis. On SAP, 18 eyes had comple-te comple-temporal hemianopia; 12 had a defect of approximacomple-tely 1 quadrant; 10 had a defect involving less than 1 quadrant of VF. The mean Humphrey VF mean deviation (MD) for the BA patients was -9.03 ± 5.09 (range, -1.09 to -15.98) and for normal control individuals was -2.71 ± 1.24 (range, 0.94 to -4.99; P<0.0001).
The extent of VFS loss was calculated by analyzing the deviation from the normal in the total deviation plot cor-responding to the 16 central points of the VF, an area roughly equivalent to the area covered by OCT macular scans. The values of the total deviation plot of the SAP 24-2 test covering these 16 test points (18º x 18º) were calculated for each qua-drant (superotemporal, inferotemporal, superonasal and infe-ronasal) and for each hemifield (central nasal and central tem-poral). Thus, each quadrant represented the average deviation of 4 VF test points, and each hemifield the average deviation of 8 VF test points (Figure 1). Deviation from normal in the total deviation plot at each test location was measured in decibels. Unlogged 1/Lambert (1/L) values were calculated for each test location by dividing decibel readings by 10 and then unlogging the quotient.
Subjects underwent ocular imaging with dilated pupil using a commercially available OCT (Stratus OCT, Carl Zeiss Meditec Inc., Dublin, CA). The fast macular thickness scan was used to obtain macular thickness measurements with OCT. Stratus OCT measurements of the macula were generated from 6 consecutive linear scans, 6 mm in length, in a spoke-like radial configuration each line 30 degrees apart and centered on the fovea (Figure 1).
Raw data files of fast macular mapping OCT images (six 6-mm radial linear scans) were exported to a removable disk using the export feature of the Stratus OCT software (version 4.0). For this study, four diagonal scans (scan # 2, 3, 5 and 6; Figure 1) and one horizontal scan (scan # 4; Figure 1) were used to calculate macular thickness. Because the inner retinal layers are absent in the fovea, in each scan the 20 centrally located A-scan points corresponding to the fovea were excluded. The vertical scan (scan # 1) was not analyzed because it would provide no data directly corresponding to the nasal and temporal retina. Macular thickness may provide important structural
para-meters to correlate with visual field sensitivity (VFS) loss in patients with anterior optic pathway diseases. Since the gan-glion cell layer and its axons account for up to 35% of the thickness in the macular area(14), estimates of macular thickness
can be used to investigate possible RGC loss. In previous studies, we showed good correlation between macular thickness in the nasal retina and VFS loss estimated from the temporal mean defect in patients with long-standing chiasmal loss, although we measured the macula according to a circular map with values presented in sectors that did not respect the vertical meridian(11,15). Therefore, the relationship between VFS loss
and macular thickness measurements could not be evaluated in different quadrants as would be desirable for evaluating structure-function relationship in patients with chiasmal syn-drome. Although the equipment output refers to a circular area, it is possible to obtain quadrantic measurements by analyzing the raw data from the individual scans of the fast OCT macular thickness protocol. Thus, the purpose of this study was (1) to evaluate the ability of quadrantic macular thickness measure-ments based on raw Stratus-OCT data to detect neuronal dama-ge and (2) to assess the correlation between such measure-ments and SAP-measured VFS in eyes with temporal field defect and BA of the optic nerve.
METHODS
This was an observational, prospective cross-sectional study that followed the principles of the Declaration of Helsin-ki. Approval from the Institutional Review Board Ethics Com-mittee was obtained and all participants gave their informed consent.
Average thickness was calculated for the inferonasal, supero-nasal, inferotemporal and superotemporal quadrants by joi-ning two half scans and averaging values from each test point within the respective quadrants. A total of 108 A-scan points per quadrant were averaged. To calculate the average thick-ness of the nasal and temporal hemiretinas, the horizontal scan was weighted-averaged with measures from the correspon-ding quadrants (inferonasal and superonsal quadrants for the nasal hemiretina; the superotemporal and inferotemporal quadrants for temporal hemiretina).
Macular thickness parameters measurements from pa-tients with BA and normal controls were compared using Student’s t test. Pearson’s correlation coefficient (r) was used to evaluate the strength of relationship between the macular thickness parameters and corresponding VFS loss. Subsequen-tly, the relationship between OCT-measured macular thick-ness and VF sensitivity loss was described with linear regres-sion analysis. VF data were treated as dependent variables and FD-OCT measurements as independent variables in all regres-sions. To evaluate the dependence between variables from a same patient and to provide valid statistical inferences, intraclass correlation coefficient (ICC) was performed(16). Values of ICC lower
than 0.3 were considered as a weak association(17). P values of less
than 0.05 were considered statistically significant.
RESULTS
A total of 40 eyes with temporal hemianopia and 40 control eyes were studied. Thirty-three patients had pituitary adenoma, four had craniopharyngioma and three had para-sellar meningioma. Table 1 shows the deviation from normal values in each quadrant and hemifield of the 16 central VF points both in dB and 1/L scale in eyes with BA. The greatest loss of sensitivity measured in dB was observed in the supero-temporal quadrant. When expressed in the 1/L scale, the inferotemporal quadrant was the most severely depressed.
The mean (SD) macular thickness in the nasal hemiretina was 231.23 (12.98) μm and 260.91 (19.34) μm in eyes with BA
and controls, respectively. Corresponding values for the temporal hemiretina was 231.71 (11.25) μm and 257.18 (19.36) μm. In eyes with BA, quadrantic values of macular thickness were 232.16 (13.69); 233.96 (13.43); 232.99 (11.92) and 231.68 (11.76) in the inferonasal, superonasal, inferotemporal and superotemporal quadrants respectively. Corresponding values for normal eyes were: 260.41 (19.02); 262.62 (19.33); 258.86 (19.91) and 256.49 (17.81), respectively. All measurements were significantly lower in eyes with BA compared to normal eyes (p<0.05 in all com-parisons). The value of ICC was 0.238 (IC 95% 0,148-0,382).
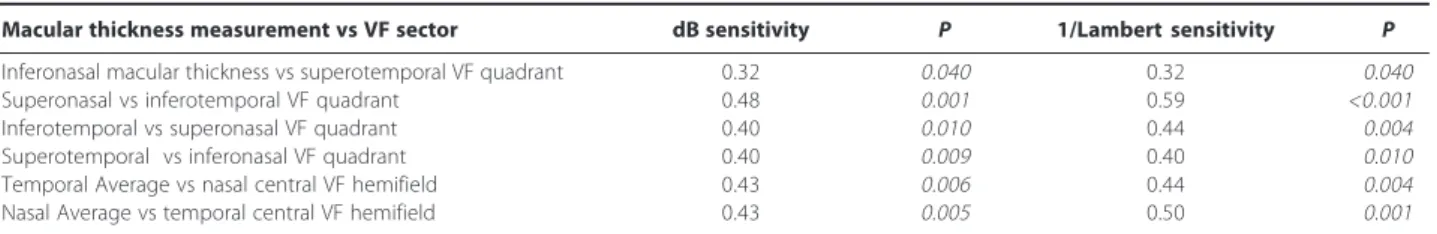
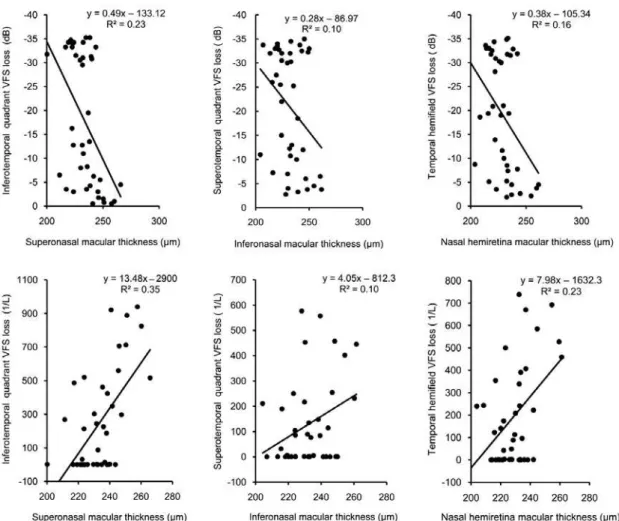
Table 2 shows the relationship between quadrantic and hemifield macular thickness parameters and the correspon-ding VF sensitivity loss. The highest Pearson’s coefficient was found between superonasal macular thickness and inferotem-poral VFS loss, in both dB and in the 1/L (R=0.48 and R=0.59, respectively). Figure 2 shows the results from the linear re-gression analysis of the best-performing macular thickness measurements and VFS loss based on the 16 central points of the VF in dB and in 1/L units. Structure-function correlation was generally greater when VFS loss was assessed in 1/L units (Figure 2). Thus, the greatest sectoral R2 was observed
bet-ween inferotemporal quadrant VFS loss and superonasal qua-drant macular thickness (R2=35%, p<0.001), followed by the
correlation between the temporal hemifield VFS loss and the nasal hemiretina macular thickness (R2=23%, p<0.001) and
between the superotemporal quadrant VFS loss and the infe-ronasal quadrant macular thickness (R2=10%, p<0.001). When
VFS loss was measured in dB, the correlation values for the corresponding parameters were 23% (p<0.001); 16% (p<0.001) and 10% (p<0.001) (Figure 2).
DISCUSSION
Since Zeimer et al.(14) proposed to use macular thickness as
an indicator of glaucoma severity, several studies have investi-gated this idea using technologies to measure retinal thick-ness such as OCT(18-24). Such studies were conducted based on
the theory that the macular thickness might be superior to circumpapillary RNFL for quantification of axonal loss, because retinal ganglion cell bodies are 10 to 20 times the diameter of their axons and because the retinal ganglion cell layer is more than one cell thick in the macula(25). However, despite the
confir-mation that macular thickness is in fact reduced in patients with glaucoma, several studies have reported circumpapillary RNFL thickness to be a more sensitive detector of glaucoma than macular thickness(19,23,26-27). This may in part be due to
limita-tions inherent in the OCT software which is restricted to analyzing macular data for the entire retina, leading to redu-ced specificity. In this context, it should be recalled that glau-coma and other optic neuropathies affect only the inner reti-nal layers whereas the outer layers merely increase measure-ment variability(28). On the other hand, technological
improve-Table 1. Central mean sensitivity in decibels (dB) and 1/Lambert (1/L) for visual field zones in the eyes with band atrophy of the optic nerve
Visual field zone dB 1/L
Superotemporal central quadrant -20.81 ± 12.03 765.28 ± 993.24 Inferotemporal central quadrant -17.65 ± 13.87 786.68 ± 1137.45 Superonasal central quadrant -0.78 ±1.94 1.27 ± 0.66 Inferonasal central quadrant -1.01 ± 1.61 1.29 ± 0.54 Temporal central 8 points -19.22 ± 12.46 616.91 ± 946.45 Nasal central 8 points -0.89 ± 1.68 1.26 ± 0.58
Table 2. Relationship between Stratus-OCT macular hickness measurements and visual field central mean sensitivity loss for each quadrant and hemifield in 40 eyes with band atrophy of optic nerve
Macular thickness measurement vs VF sector dB sensitivity P 1/Lambert sensitivity P
Inferonasal macular thickness vs superotemporal VF quadrant 0.32 0.040 0.32 0.040
Superonasal vs inferotemporal VF quadrant 0.48 0.001 0.59 <0.001
Inferotemporal vs superonasal VF quadrant 0.40 0.010 0.44 0.004
Superotemporal vs inferonasal VF quadrant 0.40 0.009 0.40 0.010
Temporal Average vs nasal central VF hemifield 0.43 0.006 0.44 0.004
Nasal Average vs temporal central VF hemifield 0.43 0.005 0.50 0.001
ments in image resolution have made segmentation and mea-surement of individual retinal layers possible improving the reliability of macular thickness measurements when compa-red to RNFL thickness measurements for detecting axonal loss in glaucoma(25,28).
In the present study, macular thickness parameters were confirmed to be significantly lower in eyes with BA of the optic nerve than in healthy control eyes(11) (Table 1). However, more
than evaluating the ability of Stratus-OCT measurements to identify eyes with BA, we assessed the correlation between such measurements and SAP-measured VFS loss in eyes with temporal field defect and BA of the optic nerve by analyzing macular thickness measurements in quadrants. These findings support the structure-function correlation in patients with chiasmal compression, as opposed to structure-function rela-tionship using VFS loss and RNFL thickness estimates. The rationale for expecting a better potential for structure-func-tion relastructure-func-tionship with macular parameters and VF sensitivity loss when compared to the RNFL thickness measurements is because of the anatomical disposition of the RNFL on the disc. With the exception of the nasal area of the disc, all other sectors receive retinal nerve fibers from both nasal and tem-poral hemiretina. The result is a lack of specificity between VF loss and optic disc sectors in patients with lesions of the optic chiasm. For example, when a VF defect affecting the supero-temporal quadrant is present, it results in RNFL loss in the
nasal, temporal and inferior regions of the optic disc. Since the inferior region of the optic disc also receives nerve fibers from the unaffected nasal VF, there is presumably a lack of specifi-city in the structure-function relationship. On the other hand, with macular thickness measurements, a superotemporal VF defect may be related to reduced macular thickness below and nasally to the fovea, with direct correspondence to the quadrantic VF defect.
Although the macula remained unsegmented in our study, macular thickness measurements were found to be as capable of discriminating eyes with BA of the optic nerve as RNFL thickness measurements were in previous studies. Conside-ring the fact that the radial scans used to obtain macular thickness parameters were not ideally designed to evaluate the macula in quadrants and that we did not use the SAP 10-2 test strategy (which would more closely match the area covered by the 6-mm scans of the Stratus-OCT scanning protocol), our results offer promising perspectives for macular thickness measurements as a quantifier of neuronal loss in anterior visual pathway diseases. More advanced scanners using Fourier-do-main OCT are likely to make OCT macular scans even more useful by obtaining thickness data in different quadrants. Our study indicated a significant structure-function correlation when assessed using the linear model evaluated by Pearson’s correlation coefficients, especially when VFS loss was expres-sed in 1/L. These findings are similar to those of previous studies on glaucoma(3,29) and other neuro-ophthalmic conditions(5-6),
suggesting the existence of a possible linear correlation bet-ween visual loss and axonal damage.
In our study, although all quadrantic measurements in BA eyes differed significantly from normals, the best structure-function correlation was found between the superonasal ma-cular thickness and inferotemporal VFS, and not between inferonasal thickness and the superotemporal VFS, the correla-tion which was smaller than expected. One possible explanacorrela-tion for this is that the VF defect was much more severe in the superior temporal quadrant than in any other segment of the VF. Thus, in the studied sample, the superior temporal VF quadrant was significantly more affected than the inferior temporal VF qua-drant (p<0.01, Student t test, Table 1). Previous studies(30-31)
have demonstrated that the structure-function relationship between RNFL thickness and VF sensitivity loss is weaker when VF defects are greater than -10 dB and almost non-existent when VF defects exceed -20 dB. We believe this may explain why the correlation observed between inferonasal macular thickness measurements and VFS loss in the superotemporal quadrant is poorer than that between superonasal macular thickness and VFS loss in the inferonasal quadrant.
CONCLUSION
In this study, Stratus-OCT macular thickness measurements divided in quadrants correlated strongly with VFS loss in eyes with temporal VF defect from chiasmal lesions. Although further studies are necessary to confirm our data, our findings suggest that macular thickness measurements may be useful for estima-ting structure-function relationship in patients with band atro-phy of the optic nerve from chiasmal compression.
ACKNOWLEDGEMENTS
Supported by grants from Fundação de Amparo a Pesqui-sa do Estado de São Paulo FAPESP (Nº 05/55326-1), São Paulo, Brazil and from Conselho Nacional de Desenvolvimento Cien-tífico e Tecnológico, CNPq (Nº 309709/2007-5), Brasília, Brazil. REFERENCES
1. El Beltagi TA, Bowd C, Boden C, Amini P, Sample PA, Zangwill LM, et al. Retinal nerve fiber layer thickness measured with optical coherence tomography is related to visual function in glaucomatous eyes. Ophthalmology. 2003;110(11):2185-91. 2. Leung CK, Chong KK, Chan WM, Yiu CK, Tso MY, Woo J, et al. Comparative study of
retinal nerve fiber layer measurement by Stratus-OCT and GDx VCC, II: structure/ function regression analysis in glaucoma. Invest Ophthalmol Vis Sci. 2005;46(10): 3702-11.
3. Garway-Heath DF, Holder GE, Fitzke FW, Hitchings RA. Relationship between electrophysiological, psychophysical, and anatomical measurements in glau-coma. Invest Ophthalmol Vis Sci. 2002;43(7):2213-20.
4. Bowd C, Zangwill LM, Medeiros FA, Tavares IM, Hoffmann EM, Bourne RR, et al. Structure-function relationships using confocal scanning laser ophthalmoscopy, optical coherence tomography, and scanning laser polarimetry. Invest Ophthal-mol Vis Sci. 2006;47(7):2889-95.
5. Danesh-Meyer HV, Carroll SC, Foroozan R, Savino PJ, Fan J, Jiang Y, et al. Rela-tionship between retinal nerve fiber layer and visual field sensitivity as measured by optical coherence tomography in chiasmal compression. Invest Ophthalmol Vis Sci. 2006;47(11):4827-35.
6. Cheng H, Laron M, Schiffman JS, Tang RA, Frishman LJ. The relationship between visual field and retinal nerve fiber layer measurements in patients with multiple sclerosis. Invest Ophthalmol Vis Sci. 2007;48(12):5798-805.
7. Danesh-Meyer HV, Carroll SC, Ku JY, Hsiang J, Gaskin B, Gamble GG, et al. Correlation of retinal nerve fiber layer measured by scanning laser polarimeter to visual field in ischemic optic neuropathy. Arch Ophthalmol. 2006;124(12):1720-6.
8. Unsold R, Hoyt WF. Band atrophy of the optic nerve. The histology of temporal hemianopsia. Arch Ophthalmol. 1980;98(9):1637-8.
9. Kanamori A, Nakamura M, Matsui N, Nagai A, Nakanishi Y, Kusuhara S, et al. Optical coherence tomography detects characteristic retinal nerve fiber layer thickness corresponding to band atrophy of the optic discs. Ophthalmology. 2004; 111(12):2278-83. Comment in: Ophthalmology. 2005;112(11):2055-6; author reply 2056-7.
10. Monteiro ML, Leal BC, Rosa AA, Bronstein MD. Optical coherence tomography analysis of axonal loss in band atrophy of the optic nerve. Br J Ophthalmol. 2004; 88(7):896-9.
11. Moura FC, Medeiros FA, Monteiro ML. Evaluation of macular thickness measure-ments for detection of band atrophy of the optic nerve using optical coherence tomography. Ophthalmology. 2007;114(1):175-81.
12. Monteiro ML, Medeiros FA, Ostroscki MR. Quantitative analysis of axonal loss in band atrophy of the optic nerve using scanning laser polarimetry. Br J Ophthalmol. 2003;87(1):32-7.
13. Monteiro ML, Leal BC, Moura FC, Vessani RM, Medeiros FA. Comparison of retinal nerve fibre layer measurements using optical coherence tomography versions 1 and 3 in eyes with band atrophy of the optic nerve and normal controls. Eye (Lond). 2007;21(1):16-22.
14. Zeimer R, Asrani S, Zou S, Quigley H, Jampel H. Quantitative detection of glauco-matous damage at the posterior pole by retinal thickness mapping. A pilot study. Ophthalmology. 1998;105(2):224-31.
15. Costa-Cunha LV, Cunha LP, Malta RF, Monteiro ML. Comparison of Fourier-domain and time-Fourier-domain optical coherence tomography in the detection of band atrophy of the optic nerve. Am J Ophthalmol. 2009;147(1):56-63 e2.
16. Murdoch IE, Morris SS, Cousens SN. People and eyes: statistical approaches in ophthalmology. Br J Ophthalmol. 1998;82(8):971-3.
17. Landis JR, Koch GG. The measurement of observer agreement for categorical data. Biometrics. 1977;33(1):159-74.
18. Greenfield DS, Bagga H, Knighton RW. Macular thickness changes in glaucoma-tous optic neuropathy detected using optical coherence tomography. Arch Ophthalmol. 2003;121(1):41-6.
19. Guedes V, Schuman JS, Hertzmark E, Wollstein G, Correnti A, Mancini R, et al. Optical coherence tomography measurement of macular and nerve fiber layer thickness in normal and glaucomatous human eyes. Ophthalmology. 2003; 110(1):177-89.
20. Lederer DE, Schuman JS, Hertzmark E, Heltzer J, Velazques LJ, Fujimoto JG, et al. Analysis of macular volume in normal and glaucomatous eyes using optical coherence tomography. Am J Ophthalmol. 2003;135(6):838-43.
21. Wollstein G, Schuman JS, Price LL, Aydin A, Beaton SA, Stark PC, et al. Optical coherence tomography (OCT) macular and peripapillary retinal nerve fiber layer measurements and automated visual fields. Am J Ophthalmol. 2004;138(2):218-25. 22. Zeimer R, Shahidi M, Mori M, Zou S, Asrani S. A new method for rapid mapping of the retinal thickness at the posterior pole. Invest Ophthalmol Vis Sci. 1996;37(10): 1994-2001.
23. Ojima T, Tanabe T, Hangai M, Yu S, Morishita S, Yoshimura N. Measurement of retinal nerve fiber layer thickness and macular volume for glaucoma detection using optical coherence tomography. Jpn J Ophthalmol. 2007;51(3):197-203. 24. Kusuhara S, Nakamura M, Nagai-Kusuhara A, Nakanishi Y, Kanamori A, Negi A.
Macular thickness reduction in eyes with unilateral optic atrophy detected with optical coherence tomography. Eye (Lond). 2006;20(8):882-7.
25. Ishikawa H, Stein DM, Wollstein G, Beaton S, Fujimoto JG, Schuman JS. Macular segmentation with optical coherence tomography. Invest Ophthalmol Vis Sci. 2005;46(6):2012-7.
26. Bagga H, Greenfield DS. Quantitative assessment of structural damage in eyes with localized visual field abnormalities. Am J Ophthalmol. 2004;137(5):797-805. 27. Medeiros FA, Zangwill LM, Bowd C, Vessani RM, Susanna R Jr, Weinreb RN.
Evaluation of retinal nerve fiber layer, optic nerve head, and macular thickness measurements for glaucoma detection using optical coherence tomography. Am J Ophthalmol. 2005;139(1):44-55.
28. Tan O, Li G, Lu AT, Varma R, Huang D. Mapping of macular substructures with optical coherence tomography for glaucoma diagnosis. Ophthalmology. 2008; 115(6):949-56.
29. Badlani V, Shahidi M, Shakoor A, Edward DP, Zelkha R, Wilensky J. Nerve fiber layer thickness in glaucoma patients with asymmetric hemifield visual field loss. J Glaucoma. 2006;15(4):275-80.
30. Hood DC, Kardon RH. A framework for comparing structural and functional measures of glaucomatous damage. Prog Retin Eye Res. 2007;26(6):688-710. 31. Hood DC. Relating retinal nerve fiber thickness to behavioral sensitivity in patients