721
CLINICS 2007;62(6):721-4
CLINICAL SCIENCE
Departament of Ophthalmology, Hospital das Clínicas – Faculdade de Medicina, Universidade de São Paulo, Brazil.
Email: [email protected] Received for publication on July 30, 2007 Accepted for publication on September 03, 2007
CONSISTENCY OF OCULAR COHERENCE
TOMOGRAPHY FAST MACULAR THICKNESS
MAPPING IN DIABETIC DIFFUSE MACULAR EDEMA
Fábio Petersen Saraiva, Patricia Grativol Costa, Daniela Lumi Inomata, Carlos Sérgio Nascimento Melo, John Helal Júnior, Yoshitaka Nakashima
Saraiva, FP; Costa, PG; Inomata, DL; Melo, CSN; Helal Jr.J; Nakashima, Y. Consistency of ocular coherence tomography fast macular thickness mapping in diabetic diffuse macular edema. Clinics. 2007;62(6):721-4.
OBJECTIVES: To investigate optical coherence tomography consistency on foveal thickness, foveal volume, and macular volume measurements in patients with and without diffuse diabetic macular edema.
INTRODUCTION: Optical coherence tomography represents an objective technique that provides cross-sectional tomographs of retinal structure in vivo. However, it is expected that poor fixation ability, as seen in diabetic macular edema, could alter its results. Several authors have discussed the reproducibility of optical coherence tomography, but only a few have addressed the topic with respect to diabetic maculopathy.
METHODS: The study recruited diabetic patients without clinically evident retinopathy (control group) and with diffuse macular edema (case group). Only one eye of each patient was evaluated. Five consecutive fast macular scans were taken using Ocular Coherence Tomography 3; the 6 mm macular map was chosen. The consistency in measurements of foveal thickness, foveal volume, and total macular volume for both groups was evaluated using the Pearson’s coefficient of variation. The T-test for independent samples was used in order to compare measurements of both groups.
RESULTS: Each group consisted of 20 patients. All measurements had a coefficient of variation less than 10%. The most consistent parameter for both groups was the total macular volume.
DISCUSSION: Consistency in measurement is a mainstay of any test. A test is unreliable if its measurements can not be correctly repeated. We found a good index of consistency, even considering patients with an unstable gaze.
CONCLUSIONS: Optical coherence tomography is a consistent method for diabetic subjects with diffuse macular edema
KEYWORDS: Diabetic retinopathy Diabética. Macula Lútea. Dabetes Mellitus. Tomography. Cnsistency of results.
INTRODUCTION
Diabetic retinopathy is an important cause of visual im-pairment.1 Slit-lamp biomicroscopy has a low sensitivity and can misdiagnose macular edema smaller than 100 µm.2 An-other well known technique is fluorescein angiography; how-ever, it provides a more qualitative rather than quantitative analysis of the retina. Therefore, it can be difficult to
evalu-ate the progression of macular edema or treatment efficacy. New imaging modalities have emerged in the past few years. A promising technology is the one described in de-tail by Hee et al. in 1995 named optical coherence tomog-raphy (OCT).2,3 It represents an objective and noninvasive technique that provides cross-sectional tomographs of reti-nal structure in vivo with a resolution of 10 µm.2,3 Other available instruments such as ultrasound and retinal thick-ness analyzers cannot provide this data.3,4,5
722
CLINICS 2007;62(6):721-4 Consistency of ocular coherence tomography fast macular thickness mapping
Saraiva, FP et al.
edema. However, focal and diffuse macular edema were not distinguished.
Since ocular motion can affect image resolution, as seen in subjects with diffuse diabetic macular edema (DME), it is expected that poor fixation ability can alter the outcome of the text.2 The aim of this study was to investigate optical coherence tomography consistency on foveal thickness, foveal volume, and macular volume measurements in pa-tients with and without diabetic diffuse macular edema (DME).
MATERIALS AND METHODS
The protocol was approved by the ethical review com-mittee of the hospital. All patients understood and signed an informed consent. The study recruited 40 type II dia-betic patients from the Hospital das Clínicas of the Uni-versity of São Paulo Medical School. Twenty patients did not have clinically evident retinopathy, and the other 20 had diffuse macular edema with no proliferative changes and no macular ischemia. The diffuse DME was characterized by generalized leakage from a dilated macular capillary bed; it was assessed by slit-lamp biomicroscopy with a Volk 78D lens and fluorescein angiography. Patients were consecu-tively enrolled over 2 months. We evaluated only one eye of each patient to avoid bias by dependent samples. If both eyes of a subject met the criteria, we randomly selected one eye. Patients who had a severe eye disease other than DME (such as glaucoma or severe hypertensive retinopathy) were excluded from the study.
Patients were divided into two different groups: (1) Case group - eyes with DME; (2) Control group - eyes without retinopathy. Five consecutive scans were taken by a trained ophthalmologist using OCT-3 (Stratus OCT ™Model 3000; Version 4.0.1; Carl Zeiss Meditec Inc. Dublin; CA, USA) after mydriasis. The fast macular scan protocol was pre-ferred, attempting to reduce errors caused by scan position-ing misalignment; this problem occurs most often when separate line scans are used. This protocol consists of six consecutive 6-mm radial line scans centered on the macula, each containing 128 A-scans, performed in 1.92 seconds. Therefore, retinal thickness is measured at a total of 768 points along these six intersecting lines. A signal strength higher than five was obtained in all scans.
The measurement analyses were done using a retinal thickness/volume tabular program. The 6 mm macular map was chosen. Consistency in measurements of foveal thick-ness, foveal volume, and total macular volume for both groups was evaluated using the Pearson’s coefficient of vari-ation (CV). The T-test for independent samples was used in order to compare measurements of both groups. A p-value smaller than 5% was considered statistically significant.
RESULTS
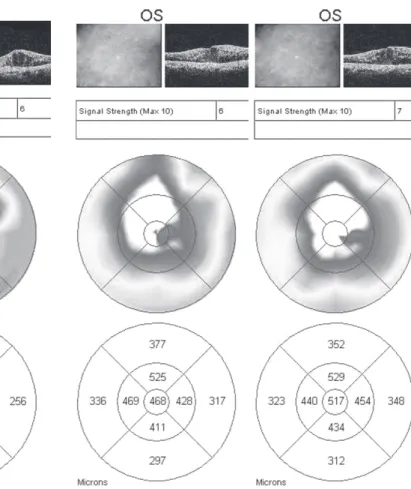
The study consisted of 40 eyes of 40 diabetic patients. Twenty patients (11 females, 9 males) had a normal fun-dus appearance and the other 20 (9 females, 11 males) were diagnosed with diffuse macular edema (DME). Mean age was 56.9 ± 8.9 years in the control group and 62.6 ± 9.85 years in the case group. The results of the measurements are shown in table 1; the mean value of the coefficient of variation (CV) is summarized in table 2. Examples of greater variation due to lack of fixation are shown in fig-ures 1 and 2.
All measurements had a CV smaller than 10%. The most consistent parameter for both groups was the total macular volume. This was the only parameter that was sta-tistically different between groups (table 2). All others val-ues were smaller in the control group but not statistically significant.
DISCUSSION
Consistency is a mainstay of any test and can be assessed by Pearson’s coefficient of variation, which is the standard deviation of the measurements divided by its mean times 100. A test is unreliable if its measurements can not be correctly repeated. Several authors have discussed OCT
reproducibil-Table 2 - Mean coefficient of variation of the foveal
thickness, the foveal volume and the total macular volume in the case and the control group.
Coefficient of Variation ± Standard Deviation (%) p-value Case group Control group
(patients with (patients without
DME*) retinopathy)
Foveal thickness 4.24 ± 3.41 2.42 ± 3.59 0.11
Foveal volume 4.24 ± 3.40 2.44 ± 3.76 0.12
Total macular volume 2.02 ± 2.36 0.79 ± 0.38 0.03 * Diffuse macular edema
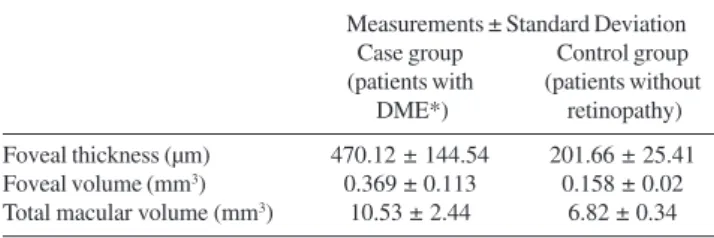
Table 1 - Mean foveal thickness, foveal volume and total
macular volume in the case group and the control group.
Measurements ± Standard Deviation Case group Control group (patients with (patients without
DME*) retinopathy)
Foveal thickness (µm) 470.12 ± 144.54 201.66 ± 25.41 Foveal volume (mm3) 0.369 ± 0.113 0.158 ± 0.02
Total macular volume (mm3) 10.53 ± 2.44 6.82 ± 0.34
723
CLINICS 2007;62(6):721-4 Consistency of ocular coherence tomography fast macular thickness mapping Saraiva, FP et al.
ity but only a few studies addressed its use with diabetic maculopathy.5,9,10 It is already known that OCT measure-ments change little in people with normal eye fixation.2,5,7 However, greater variation is likely to occur in patients with macular disease due to their reduced ability to fixate during examination;2,10 this can be visualized in figures 1 and 2, which represent two consecutive fast macular scans of two different patients with diabetic DME. Figure 1 shows that small eye movements are able to produce completely differ-ent outcomes, especially in the 1000µm inner ring where we found a difference as great as 135 µm. Gürses-Özden et al.7 studied 10 normal subjects and demonstrated a CV less than 10% in mean foveal thickness and total macular volume us-ing OCT-3. They also observed better reproducibility durus-ing macular scans than retinal nerve fiber layer thickness scans. The latter requires manual placement of the scan by the op-erator, and the former only depends upon the patient focus-ing on the instrument’s internal fixation light.
Goebel and Kretzchmar-Gross5 reported a reproducibil-ity of 2.3% in diabetic retinopathy measurements. However, it is important to note that they included all stages of dia-betic retinopathy, and they excluded patients that were not
able to maintain stable fixation. Since we cannot exclude these patients from our routine ophthalmologic practice, it is also essential to have data on OCT reproducibility in all diabetic subjects independent of fixation ability. In our study, we found a good index of consistency even consid-ering patients with an unstable gaze.
Polito and coworkers10 found similar retinal thickness results comparing undilated and dilated pupils in normal eyes and those with clinically significant macular edema. Moreover, they observed greater data variability in the outer macular areas than in the foveal region. Reduced numbers of measured points and greater distance between tomograms done in the periphery explain this variability. Schuman et al.12 studied patients in different OCT machines and found similar measurements in the studied parameters.
The mean foveal thickness of our diabetic patients with-out retinopathy was larger than published data in normal patients, similar to the results obtained by Massin et al.13 This probably happened because slit-lamp biomicroscopy is worse than OCT at detecting subtle macular edema.2 Yang et al.14 found swelling or cystoid macular edema in 58% (11/19) of diabetic eyes without ophthalmoscopic
evi-Figure 1 - Fast macular scans of a patient with diffuse diabetic macular edema obtained consecutively. Note the differences in the central macular values between scans.
724
CLINICS 2007;62(6):721-4 Consistency of ocular coherence tomography fast macular thickness mapping
Saraiva, FP et al.
dence of clinically significant macular edema.
OCT is a consistent method for retinal examination. Its consistency is high for diabetic subjects without
retinopa-thy or with diffuse macular edema. Despite the consistency of OCT, the use of more than one measurement in patients with poor fixation is recommended because reasonable vari-ation could happen in some cases.
RESUMO
macular” do aparelho de tomografia de coerência óptica. Utilizou-se o mapa macular de 6 mm. A consistência das medidas de espessura foveal, volume foveal e volume macu-lar total foi avaliada pelo teste do coeficiente de variação de Pearson. O teste T para amostras independentes foi utilizado para comparar as medidas entre os grupos.
RESULTADOS: Cada grupo consistiu de 20 pacientes.
Todas as medidas apresentaram um coeficiente de variação menor do que 10%. O parâmetro mais consistente foi o vol-ume macular total.
DISCUSSÃO: A consistência é um quesito fundamental
para qualquer teste. Caso as medidas de um determinado teste não possam ser corretamente repetidas, o resultado deste teste não pode ser considerado confiável. Nós observamos um alto índice de consistência da tomografia de coerência óptica, mesmo considerando portadores de fixação ocular instável.
CONCLUSÕES: A Tomografia de coerência óptica é um teste
consistente em portadores de edema macular difuso diabético
UNITERMOS: RetinopatiaDiabética. Macula Lútea.
Dia-betes Mellitus. Tomografia. Reprodutibilidade de resultados.
REFERENCES
1. Klein R, Klein BE, Moss SE. Visual impairment in diabetes. Ophthalmology.1984;91:1-9.
2. Hee MR, Puliafito CA, Wong C, Duker JS, Reichel E, Rutledge B, et al. Quantitative assessment of macular edema with optical coherence tomography. Arch Ophthalmol.1995;113:1019-29.
3. Hee MR, Izatt JA, Swanson EA, Huang D, Schuman JS, Lin CP, et al. Optical coherence tomography of the human retina. Arch Ophthalmol.1995;113:325-32.
4. Wakitani Y, Sasoh M, Sugimoto M, Ito Y, Ido M, Uji Y. Macular thickness measurements in healthy subjects with different axial lengths using optical coherence tomography. Retina.2003;23:177-82.
5. Goebel W, Kretzchmar-Gross T. Retinal thickness in diabetic retinopathy: a study using optical coherence tomography (OCT). Retina.2002;22:759-67. 6. Sutter FK, Simpson JM, Gillies MC. Intravitreal triamcinolone for diabetic macular edema that persists after laser treatment. Three-month efficacy and safety results of a prospective, randomized, double-masked, placebo-controlled clinical trial. Ophthalmology.2004;111:2044-9.
7. Gurses-Ozden R, Teng C, Vessani R, Zafar S, Liebmann JM, Ritch R. Macular and retinal nerve fiber layer thickness measurement reproducibility using optical coherence tomography (OCT-3). J Glaucoma.2004;13:238-44.
8. Mok KH, Lee VW, So KF. Increasing scans per examination improves the reproducibility on retinal nerve fiber layer measurements by optical coherence tomography. Optom Vis Sci.2004;81:268-71.
9. Alamouti B, Funk J. Retinal thickness decreases with age: an OCT study. Br J Ophthalmol.2003;87:899-901.
10. Polito A, Del Borrello M, Isola M, Zemella N, Bandello F. Repeatability and reproducibility of fast macular thickness mapping with stratus optical coherence tomography. Arch Ophthalmol.2005;123:1330-1337. 11. Olmedo M, Cadarso-Suarez C, Gomez-Ulla F, Val C, Fernandez I.
Reproducibility of optic nerve head measurements obtained by optical coherence tomography. Eur J Ophthalmol.15:486-92.
12. Schuman SG, Hertzmark E, Fujimoto JG, Schuman JS. Wavelength independence and interdevice variability of optical coherence tomography. Ophthalmic Surg Lasers Imaging.35:316-20.
13. Massin P, Erginay A, Haouchine B, Mehidi AB, Paques M, Gaudric A. Retinal thickness in healthy and diabetic subjects measured using optical coherence tomography mapping software. Eur J Ophthalmol.2002;12:102-8. 14. Yang CS, Cheng CY, Lee FL, Hsu WM, Liu JH. Quantitative assessment
of retinal thickness in diabetic patients with and without clinically significant macular edema using optical coherence tomography. Acta Ophthalmol Scand.2001;79:266-70.
Saraiva, FP; Costa, PG; Inomata, DL; Melo, CSN; Helal Jr.J; Nakashima, Y. Consistência da tomografia de coerência óptica no edema macular difuso diabético. Clinics. 2007;62(6):721-4.
OBJETIVOS: Investigar a consistência das medidas de
espessura foveal, volume foveal e volume macular total feitas pela tomografia de coerência óptica em pacientes com e sem edema macular difuso diabético.
INTRODUÇÃO: A tomografia de coerência óptica é uma
técnica objetiva que proporciona tomografias seccionais da estrutura retiniana in vivo, entretanto, é esperado que uma baixa capacidade de fixação ocular, assim como observado nos casos de edema macular diabético, possa prejudicar os resultados deste exame.Vários autores já discutiram sobre a reprodutibilidade da tomografia de coerência óptica, entretanto, há pouca publicação deste assunto na maculopatia diabética.
MÉTODOS: O estudo incluiu pacientes diabéticos sem