Evaluation of Accuracy of Rastreometer: A New Equipment for
Hypertension Tracking
Fernando Bitencourt and Carlos Antonio Mascia Gottschall
Instituto de Cardiologia do Rio Grande do Sul/ Fundação Universitária de Cardiologia - IC/FUC, Porto Alegre, RS, Brazil
Abstract
Background: Hypertension is one of the major cardiovascular risk factors affecting more than one billion people. The low awareness of the disease is one of the greatest difficulties related to hypertension. The population screening for hypertension is widely recognized as an effective strategy to detect new cases, but until now, there is no instrument that has become feasible for mass screening of the population.
Objective: Evaluate the accuracy and reproducibility of the Rastreometer, a new instrument for the screening of hypertension for community health agents.
Methods: Cross-sectional study with a sample of 436 individuals served by the Family Health Strategy. The evaluation was conducted comparing the results of blood pressure obtained by the oscillometric method and reading of the Rastreometer performed by community health agents.
Results: The Rastreometer presented a sensitivity of 81.3% and a specificity of 85.6% when assessed in relation to the values of systolic pressure. The operators’ performance influenced the results of the Rastreometer independently (p = 0.0001). The Rastreometer showed substantial reproducibility (Kendall’s W 0.71).
Conclusion: The Rastreometer, when operated by community health agents, showed good sensitivity, specificity and reproducibility, especially when evaluated with the values of systolic pressure, tending to confirm this new instrument as a method of screening for hypertension in primary health care. (Arq Bras Cardiol 2012;98(2):151-160)
Keywords: Hypertension / prevention; blood pressure; measurement equipment; sphygmomanometers; risk factors; diagnosis.
Mailing Address: Carlos Antonio Mascia Gottschall •
Av. Princesa Isabel, 370 U. Pesquisa, Santana - 90620-000 - Porto Alegre, RS, Brazil
E-mail: [email protected], editoracaopc@cardiologia. org.br
Manuscript received April 01, 2011; revised manuscript received July 07, 2011; accepted October 14, 2011.
be used by Community Health Agents (CHA). This means that more than 240,000 ACS10 across the country could apply this test quickly, with low costs and minimal risks, to detect suspected hypertension individuals. However, the Rastreometer has only been tested by professionals and medical students in controlled environments8,9.
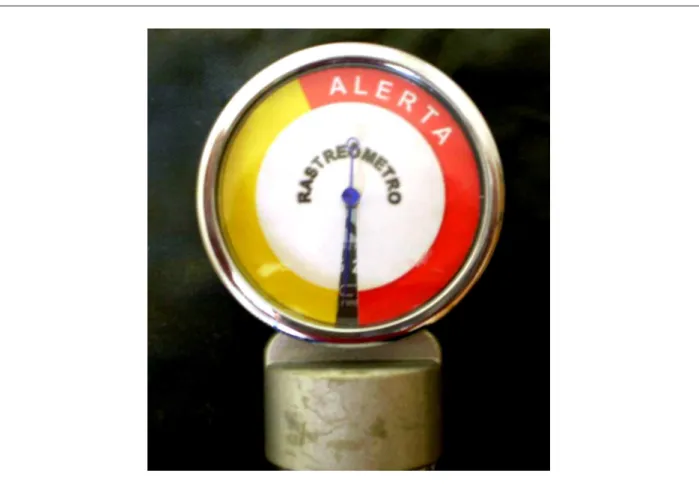
The Rastreometer (Fig. 1) is an adaptation of an aneroid sphygmomanometer in which the gauge display is covered by a sticker with two bands, one yellow indicating pressure values <140 mmHg and another red indicating values = or> 140 mmHg. The evaluation is done by reading the beginning of the oscillation of the needle gauge, being suspected of HBP that in which the oscillation of the needle start in the red band, and those with normal pressure in which oscillation starts in the yellow band. A limitation of this technique is the impossibility, a priori, to evaluate isolated changes in diastolic pressure.
This technique was developed because of the prohibition, by the Federal Nursing Council, of the CHA perform measurements of blood pressure by auscultation / oscillometric method.
The objective of this study is to evaluate the accuracy and reproducibility of the Rastreometer as a screening method for HBP when operated by community health agents.
Introduction
Hypertension (HBP) is one of the major cardiovascular risk factors and major risk factor attributed to global mortality1. Early detection is paramount in the treatment of hypertension in order to reduce cardiovascular events2. However, the low rates of knowledge of the disease are one of the greatest difficulties in its management3,4. In Brazil, it is estimated that half of hypertensive individuals know their condition5. The population screening for hypertension is recognized as an effective strategy in the detection of new cases6,7.
So far, however, does there is no instrument available that makes it feasible for mass screening of the population.
Methods
Cross-sectional study in the town of Charqueadas (RS). The study population was the inhabitants ascribed in the Unidade de Saúde da Família Sul América. Survey participants were selected by simple random probability sampling.
The sample size calculation to evaluate the accuracy of the Rastreometer was conducted based on the values of sensitivity (95%) and specificity (63.1%) presented in previous studies and on the prevalence of hypertension in the study area (21%). We allowed a margin of error of 5% and 80% power. The result of the sample calculation was 436 people.
In order to test the reproducibility of the Rastreometer, a second sample of 90 patients was evaluated. For this test, we used a convenience sample of people who sought treatment in a second Health Unit of the municipality.
Inclusion criteria were: arm circumference between 22 cm and 42 cm, regular use of antihypertensive drug therapy in patients with hypertension and aged between 20 and 80 years.
The Rastreometer method was compared with the oscillometric method, considered a reference standard in the study. The Rastreometer was made from an aneroid sphygmomanometer brand Eternum adult size (rubber bag 12 cm wide and 23 cm in length), indicated for brachial circumferences between 24 and 30 cm. As reference standard
it was used a digital oscillometric sphygmomanometer brand Microlife 3BTO-A model, validated by the British Hypertension Society11. In this device, we used two types of clamps with appropriate sizes for each arm circumference (22-32cm Standard adult and Large adult 32-42cm). This digital apparatus was used as a comparison in an attempt to avoid measurement biases12,13.
Prior to beginning work, the tools of research, which were new and certified by the National Institute of Metrology, Standardization and Industrial Quality - Inmetro - (with certification seal of May 2008), were evaluated to ascertain suitability of the calibration between sphygmomanometers. After the beginning of the survey we conducted other two calibration checks. The calibration evaluations were performed by Inmetro. In none of the assessments there was a discrepancy regarding calibration of the instruments or disapproval of any other item evaluated.
The Rastreometer was used in participants with arm circumference between 22 cm and 42 cm. To evaluate the blood pressure it was used a specific clamp for the different brachial circumferences, following the manufacturer’s specifications of the Microlife sphygmomanometer. This option for comparing a blood pressure level closest to the actual value (by the use of appropriate clamps for arm circumference) with that obtained by reading the Rastreometer (only with
adult-type device) was used to evaluate the influence of arm circumference in the accuracy of the Rastreometer, since the size of the cuff has unquestionable influence on blood pressure measurements by the indirect methods14.
The Rastreometer method was handled by four CHA and their readings were compared with the oscillometric method, whose measurements were taken using a nurse15.
All CHA used the same equipment in all phases of research. The CHA were not familiar with the new method, therefore, they received a basic training in the technique of reading the Rastreometer and later each one performed 30 measurements with the instrument in different patients.
Initially, we applied the questionnaires and obtained anthropometric measurements for each participant. The interview, anthropometric measurements and evaluation of blood pressure by the oscillometric method occurred only in the presence of the nurse in order to keep the CHA blind to the clinical characteristics and values of blood pressure. The operators of the Rastreometer and reference standard device were also blind to each other.
Each participant had their blood pressure measured twice by the oscillometric method and twice with the Rastreometer. Firstly, evaluations were made by the oscillometric method, and after, with the Rastreometer. All assessments of blood pressure followed the orientation of the V Brazilian Guidelines on Arterial Hypertension2. The evaluations were performed after an initial rest for 5 minutes and 1 minute between the first and second measurements (reference standard method) and between the third and fourth measurements (Rastreometer). Between the second and third measures there was an interval of 2 minutes2.
It was considered positive for high blood pressure using the Rastreometer if one or both of the readings taken were positive (oscillation of the needle in the red band indicating systolic blood pressure equal to or greater than 140 mmHg). To compare the results, it was considered the arithmetic mean of blood pressure values obtained with the oscillometric method. We considered high blood pressure values greater than or equal to 140 mmHg for systolic pressure and 90 mmHg for the diastolic pressure2. The regular use of drug therapy was evaluated by the Morisky-Green16 questionnaire.
To evaluate the reproducibility of the Rastreometer it was carried out a new sequence of evaluations in an independent sample. In this test, each CHA held a Rastreometer measured with an interval of one minute between each measure in the same participant. In this evaluation it was also obtained a blood pressure measurement by the oscillometric method. During the reproducibility tests, the CHA were blinded to each other, for the prior diagnosis of hypertension and blood pressure value.
We used Student’s t test to compare continuous variables and chi-square test for categorical variables. To identify the variables that independently influenced the results of the Rastreometer, we performed bivariate and multivariate analysis. Initially, all variables of interest were tested in bivariate model, as follows: age, gender, race, body mass index (BMI> 30 / BMI <30), heart rate, cuff size used in
Rastreometer (suitable / unsuitable to arm circumference), previous diagnosis of hypertension, diabetes or dyslipidemia, smoking and operator (comparison of the percentage of success among operators).
For accuracy assessments we performed analysis for sensitivity, specificity, positive and negative predictive value, pre-test probability, likelihood ratio +, likelihood ratio -, post-test probability+ and post-test probability17. To evaluate intra-observer concordance, it was used the Kappa test, and to assess the concordance between the observers it was used the Kendall’s W test. It was considered as statistical significance a p value <0.05 and it was used a range of 95%. The power of statistical tests was 80%.
The protocol was approved by the Research Ethics Committee and all participants signed an informed consent.
Results
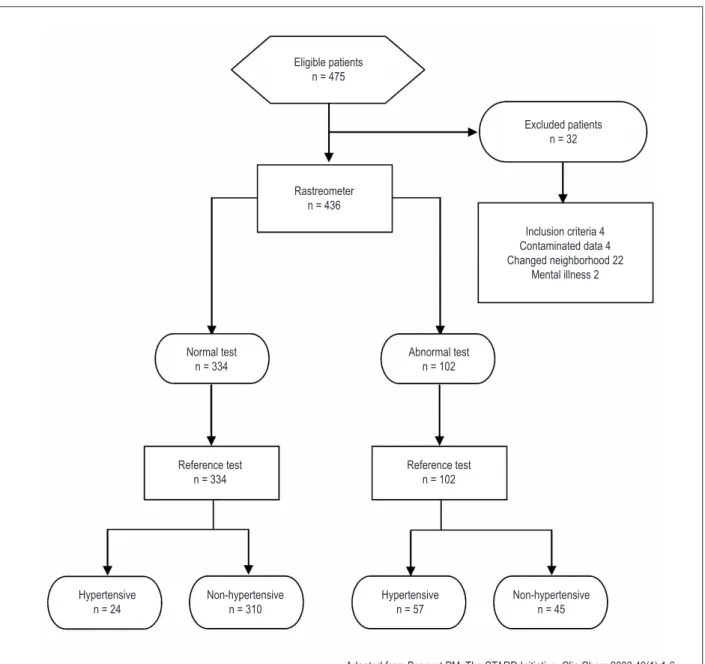
The first visit took place on 08/23/2008 and the last on 7/24/2009. The study flowchart is shown in Figure 218.
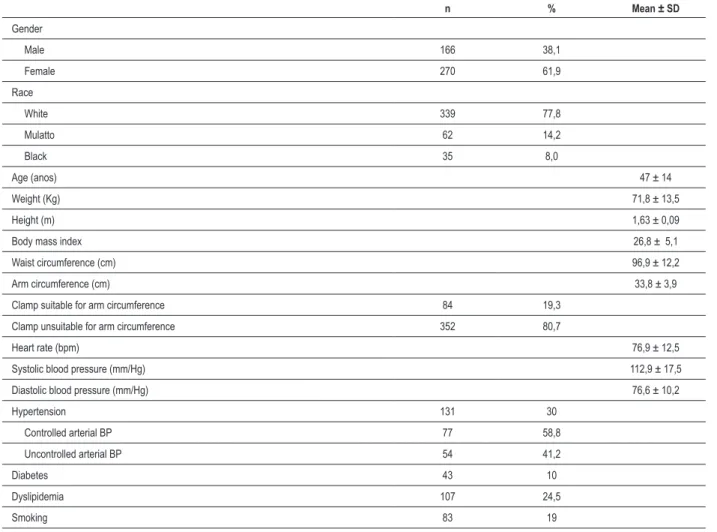
The sample was predominantly female (61.9%) and white (77.8%). The average age was 47 years. The total number of patients with a previous diagnosis of hypertension was 131, with the percentage of hypertensive patients with controlled pressure of 58%. Eighty-one patients had high blood pressure (BP) during the test. The other clinical and demographic characteristics of the sample are presented in Table 1.
Once the Rastreometer has the ability, a priori, to identify changes in the systolic component of blood pressure, allowing only the tracking of cases of isolated systolic hypertension and systolic / diastolic pressure, the results described below will be presented, first considering hypertension as the reference values of the VI Brazilian Guidelines on Arterial Hypertension5, and it will be described as assessment of systolic and diastolic pressure (ASDP) and second, considering only the value of systolic pressure equal to or greater than 140 mmHg, characterizing hypertension, discarding cases of isolated diastolic hypertension, and it will be described as Assessment of Systolic Pressure (ASP).
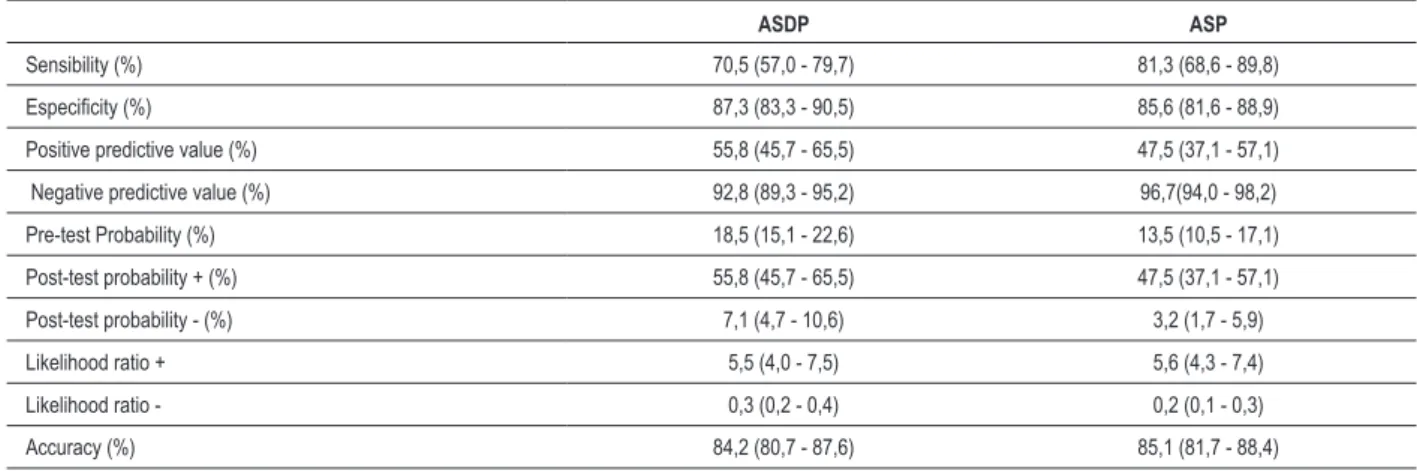
The results for ASDP and ASP are presented in Table 2. By evaluating the values of isolated systolic pressure there was an increase of 10.8% in the value of sensitivity and slight reduction in specificity (1.7%). Regarding predictive values, there was a reduction in positive predictive value (8.3%), as expected due to the reduction of prevalence, and a slight increase in the negative predictive value (3.9%). However, the likelihood for positive and negative ratio was only marginally altered, with a slight increase in ASP.
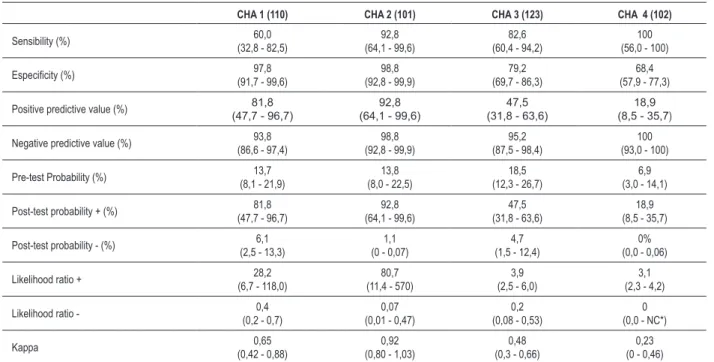
The performance of each CHA was also evaluated considering ASP and ASDP. The results are shown in Tables 3 and 4. We noted that there was an improvement in the results of sensitivity and slight reduction in specificity also in the operators’ individual results when considering the ASP. The differences between the agents, however, persisted in both evaluations.
The number of cases of isolated diastolic hypertension (22 patients had isolated elevation of diastolic pressure) and the interpretation of each CHA are presented in Table 5.
Measurements of intra-observer concordance were also performed for each CHA through the Kappa test (Tables 3 and 4). A general measure of concordance was performed to evaluate the overall Rastreometer concordance with the reference standard method of obtaining a Kappa value of 0.52 (CI 95% 0.43 to 0.62) for ASDP and Kappa of 0.51 (CI 95% 0.40 to 0.62) for ASP.
Also learning curves were generated for health agents in order to evaluate the performance of each operator throughout the study. Comparisons were made between the percentages of success between quintiles of samples from each CHA. These showed that none of the operators varied over the course of their performance evaluations (p = ns).
In the Poisson regression analysis, the only variable that independently influenced the results of the Rastreometer was the operator (p = 0.0001). The use of the sphygmomanometer cuff inadequate for arm circumference (p = 0.19) and previous diagnosis of hypertension (p = 0.10) did not influence the results of Rastreometer significantly.
Discussion
This was the first work with the Rastreometer involving community health agents to assess its accuracy as a screening test for hypertension that we know. In this study, the Rastreometer showed good sensitivity and specificity, especially when weighed against the values of systolic pressure. The use of
Figure 2 – Study Flowchart.
Reference test n = 334 Normal test
n = 334
Reference test n = 102 Abnormal test
n = 102 Rastreometer
n = 436
Inclusion criteria 4 Contaminated data 4 Changed neighborhood 22
Mental illness 2 Excluded patients
n = 32 Eligible patients
n = 475
Hypertensive n = 24
Non-hypertensive n = 310
Hypertensive n = 57
Non-hypertensive n = 45
inappropriate cuff for arm circumference in the Rastreometer (p = 0.19) and previous diagnosis of hypertension (p = 0.10) did not influence the results of the new instrument. The performance of operators (CHA) influenced the results of the Rastreometer independently (p = 0.0001). The Rastreometer showed substantial reproducibility as measured by Kendall’s W test (0.71).
This was the third study involving this new method for screening of hypertension; however, it was the first to evaluate the accuracy of the Rastreometer with CHA and in a primary care environment.
In this evaluation the Rastreometer had a sensitivity of 70.5% (CI 95% 57.0 to 79.7) and specificity of 87.3% (CI 95% 83.3 to 90.5) when evaluated regarding systolic and diastolic pressure values (ASDP). Considering only the values of systolic blood pressure (ASP) the Rastreometer increased the sensitivity to 81.3% (CI 95% 68.6 to 89.8) and had a small reduction in its specificity which has been established in 85.6% (CI 95% from 81.6 to 88.9).
Our findings corroborate the results of previous studies. In the first study8 the Rastreometer was tested by its own inventor
in a sample of 200 patients. Of these, 100 were known to be without a diagnosis of hypertension and 100 known to be hypertensive. The results of sensitivity and specificity for the group without a diagnosis of hypertension were quite high, reaching values of 96.7% to 80% for sensitivity and specificity. On the other hand, in the group diagnosed with the disease, the sensitivity was 98.7% and a specificity of 94.7%. In the second study9 the Rastreometer was tested on a sample of 268 patients, by two medical students, with results of 95.1% for sensitivity and 63.1% for specificity.
Although the results of the three studies tend to confirm the Rastreometer as a method of population screening for hypertension, some considerations are relevant.
Both previous studies were performed in secondary care environments. Thus, the results may have been overestimated by the characteristics of the populations studied, namely, higher prevalence of hypertension and the spectrum of illness of patients in these studies17. By themselves, these two factors could increase the sensitivity, due to the spectrum bias, and positive predictive value, related to higher prevalence of disease19.
Table 1 - Clinical and demographic characteristics
n % Mean ± SD
Gender
Male 166 38,1
Female 270 61,9
Race
White 339 77,8
Mulatto 62 14,2
Black 35 8,0
Age (anos) 47 ± 14
Weight (Kg) 71,8 ± 13,5
Height (m) 1,63 ± 0,09
Body mass index 26,8 ± 5,1
Waist circumference (cm) 96,9 ± 12,2
Arm circumference (cm) 33,8 ± 3,9
Clamp suitable for arm circumference 84 19,3
Clamp unsuitable for arm circumference 352 80,7
Heart rate (bpm) 76,9 ± 12,5
Systolic blood pressure (mm/Hg) 112,9 ± 17,5
Diastolic blood pressure (mm/Hg) 76,6 ± 10,2
Hypertension 131 30
Controlled arterial BP 77 58,8
Uncontrolled arterial BP 54 41,2
Diabetes 43 10
Dyslipidemia 107 24,5
Smoking 83 19
Table 3 - Results of the Rastreometer by community health agent ASDP (95%)
CHA 1 (110) CHA 2 (101) CHA 3 (123) CHA 4 (102)
Sensibility (%) 50,0
(27,8 - 72,1)
76,4 (49,7 - 92,1)
71,8 (53,0 - 85,6)
91,6 (59,7 - 99,5)
Especiicity (%) 98,8
(93,0 - 99,9)
98,8 (92,6 - 99,9)
81,5 (71,7 - 88,5)
71,1 (60,4 - 79,9)
Positive predictive value (%) 90,9 (57,1 - 99,5)
92,8 (64,1 - 99,6)
57,5 (41,0 - 72,5)
29,7 (16,4 - 47,1)
Negative predictive value (%) 89,8 % (81,6 - 94,7)
95,4 % (87,9 - 98,5)
89,2 (80,1 - 94,6)
98,4 (90,5 - 99,9)
Pre-test Probability (%) 18,3 (11,8 - 27,1)
16,8 (10,3 - 25,8)
25,8 (18,5 - 34,5)
11,7 (6,4 - 20,0)
Post-test probability + (%) 90,9 (57,1 - 99,5)
92,8 (64,1 - 99,6)
57,5 (41,0 - 72,5)
29,7 (16,4 - 47,1)
Post-test probability - (%) 10,2 (5,2 - 18,3)
4,8 (1,4 - 12,0)
10,7 (5,3 - 19,8)
1,5 (0,9 - 4,0)
Likelihood ratio + 44,5 (6,0 - 328)
64,2 (8,9 - 458)
3,8 (2,4 - 6,2)
3,1 (2,1 - 4,5)
Likelihood ratio - 0,5
(0,3 - 0,7)
0,2 (0,1 - 0,5)
0,3 (0,1 - 0,6)
0,1 (0,01 - 0,7)
Kappa 0,59
(0,38 - 0,8)
0,81 (0,65 - 0,97)
0,49 (0,33 - 0,66)
0,33 (0,16 - 0,5)
CHA - Community health agents.
The lack of blinding of the Rastreometer operators to the clinical characteristics of the participants in previous studies could also be related to the increased sensitivity of the instrument under test, since the knowledge of the patient’s diagnosis before applying the test may take, even if unconsciously, to identify patients as patients with a previously established diagnosis17,19. Another important fact was the number of patients in which the Rastreometer was applied in previous studies, which could result in random bias19.
It is worth noting that the characteristics of the operators of the three studies are fairly distinct. The Rastreometer was operated by an experienced cardiologist and inventor of the instrument
in the first study, by two medical students in the second study and, finally, four CHA with high school degree. This fact could also result in differences between the results of studies supporting the aforementioned17.
Another important factor was the diagnostic accuracy used in the different studies. In the study of Forsvall9 it was used reference standard with an accuracy of 5 mmHg. In our study, the accuracy in measurements of blood pressure was 1 mmHg. The accuracy of BP measurements in the first study was not reported.
Thus, the performance of the Rastreometer in this study is consistent with that described by Fletcher19, which reinforces that being applied in an asymptomatic population and in milder
Table 2 – Results of the Rastreometer (IC 95%)
ASDP ASP
Sensibility (%) 70,5 (57,0 - 79,7) 81,3 (68,6 - 89,8)
Especiicity (%) 87,3 (83,3 - 90,5) 85,6 (81,6 - 88,9)
Positive predictive value (%) 55,8 (45,7 - 65,5) 47,5 (37,1 - 57,1)
Negative predictive value (%) 92,8 (89,3 - 95,2) 96,7(94,0 - 98,2)
Pre-test Probability (%) 18,5 (15,1 - 22,6) 13,5 (10,5 - 17,1)
Post-test probability + (%) 55,8 (45,7 - 65,5) 47,5 (37,1 - 57,1)
Post-test probability - (%) 7,1 (4,7 - 10,6) 3,2 (1,7 - 5,9)
Likelihood ratio + 5,5 (4,0 - 7,5) 5,6 (4,3 - 7,4)
Likelihood ratio - 0,3 (0,2 - 0,4) 0,2 (0,1 - 0,3)
Accuracy (%) 84,2 (80,7 - 87,6) 85,1 (81,7 - 88,4)
cases of disease, the screening tests tend to have lower sensitivity and higher specificity than when applied to a spectrum of more severe patients, and the positive predictive value is generally low, even with high values of specificity.
The assessment carried out in relation to isolated systolic BP values is quite relevant, since the Rastreometer has an intrinsic limitation, which is the ability to evaluate only the systolic pressure gauge (start of oscillation of the needle). Systolic hypertension, however, is the most prevalent form of hypertension and the most important cardiovascular risk factor20. Nevertheless, the isolated value of the systolic blood pressure component is able to correctly identify 91% of arterial hypertension cases21.
In this study, 24 patients with abnormal blood pressure were not identified by the Rastreometer (Fig. 2), and out of these, 11 had elevated systolic BP and 13 had isolated elevation of diastolic BP. However, the Rastreometer
identified 9 patients with isolated change in diastolic BP, of a total of 22 cases, which was not expected to occur (Table 5). At first glance, the non identification of 24 suspects of hypertension could be considered significant; however, considering the context in which it is intended to use the instrument, the strategy of family health, we will understand that in cases not screened the first time may be identified following the screening, since the test can be applied monthly by community health agents.
In turn, 45 patients (Fig. 2) were identified as false-positives by the Rastreometer. It is noteworthy that the identification of false-positive cases would have a benign result; which would be the individuals going to the Health Unit for assessment of blood pressure and, if necessary, clarifying diagnosis in medical consultation.
The use of a single cuff size, regardless of arm circumference, independently did not affect the properties of the Rastreometer (p = 0.19). Reduced accuracy of the instrument in situations of inadequate cuff was expected, since the influence of cuff size on blood pressure measurement is well defined12,14,22. However, this situation can be explained in part by the fact of having been used a cuff smaller than indicated in the Rastreometer in 80.7% of the sample, which increased its sensitivity to some extent due to an overestimation of the arterial pressure14 reading and did not influence the specificity. This finding confirms the finding of Forsvall9, which also has not identified differences in accuracy of the Rastreometer when using cuffs inadequate to arm circumference, however, in that study we used identical cuffs in the Rastreometer and a reference standard.
Table 4 - Results of the Rastreometer by community health agent ASP (95%)
CHA 1 (110) CHA 2 (101) CHA 3 (123) CHA 4 (102)
Sensibility (%) 60,0
(32,8 - 82,5)
92,8 (64,1 - 99,6)
82,6 (60,4 - 94,2)
100 (56,0 - 100)
Especiicity (%) 97,8
(91,7 - 99,6)
98,8 (92,8 - 99,9)
79,2 (69,7 - 86,3)
68,4 (57,9 - 77,3)
Positive predictive value (%) 81,8
(47,7 - 96,7)
92,8 (64,1 - 99,6)
47,5 (31,8 - 63,6)
18,9 (8,5 - 35,7)
Negative predictive value (%) 93,8 (86,6 - 97,4)
98,8 (92,8 - 99,9)
95,2 (87,5 - 98,4)
100 (93,0 - 100)
Pre-test Probability (%) 13,7 (8,1 - 21,9)
13,8 (8,0 - 22,5)
18,5 (12,3 - 26,7)
6,9 (3,0 - 14,1)
Post-test probability + (%) 81,8 (47,7 - 96,7)
92,8 (64,1 - 99,6)
47,5 (31,8 - 63,6)
18,9 (8,5 - 35,7)
Post-test probability - (%) 6,1 (2,5 - 13,3)
1,1 (0 - 0,07)
4,7 (1,5 - 12,4)
0% (0,0 - 0,06)
Likelihood ratio + 28,2 (6,7 - 118,0)
80,7 (11,4 - 570)
3,9 (2,5 - 6,0)
3,1 (2,3 - 4,2)
Likelihood ratio - 0,4 (0,2 - 0,7)
0,07 (0,01 - 0,47)
0,2 (0,08 - 0,53)
0 (0,0 - NC*)
Kappa 0,65
(0,42 - 0,88)
0,92 (0,80 - 1,03)
0,48 (0,3 - 0,66)
0,23 (0 - 0,46)
NC* - Can not be calculated due to one of the matrices being zero; CHA - Community health agents.
Table 5 - Number of cases of isolated diastolic hypertension (IDH) per CHA and interpretation (n = 22)
IDH True-Positive False- Negative
CHA 1 5 1 4
CHA 2 3 0 3
CHA 3 9 4 5
CHA 4 5 4 1
Total 22 9 13
It is worth noting that the evaluation of the influence of arm circumference in the Rastreometer accuracy is impossible to achieve if using cuffs inadequate for arm circumference in the reference standard instrument, as the result obtained in this unit would not be consistent with the reality, but compatible with the Rastreometer measures. The fact that a possible overestimation of values in the Rastreometer sensitivity, by using a cuff smaller that required in the Rastreometer by far is negative, once it is expected high sensitivity values of screening tests.
In our study, the previous diagnosis of hypertension did not influence significantly either the properties of the Rastreometer (p = 0.10). However, in the work of Forsvall9, when comparing the readings altered in the Rastreometer with the results of blood pressure above 140 mmHg systolic or 90 mmHg diastolic BP, the use of medication for treatment of hypertension, which implies being hypertensive, altered the Rastreometer specificity of 77.8% in the unmedicated group to 32.7% in the medicated group. The regular use of antihypertensive medication was assessed in our study with the aim of identifying variations in drug-related accuracy by comparing hypertensive patients under pharmacological and non-pharmacological isolated treatment. However, there were no cases of non-pharmacological treatment isolated in the sample, making it impossible to evaluate the influence of the use of antihypertensive drugs.
One of the possibilities to explain this difference between studies was the lack of blinding in the diagnosis of the patient before the measurements with the Rastreometer in that study, which may have led to a tendency to recognize the test applied to patients known to be hypertensive as altered, even when they had controlled pressure, thus incurring the observed reduction in the values of specificity.
The explanation of the author to justify that difference between the results of specificity in the medicated and unmedicated groups was attributed to the lack of standardization of the beginning of the oscillations that identify the actual systolic pressure, and a better training of operators could correct this distortion. In that study, the operators of the Rastreometer reached their plateau of performance only at the end of the study. This fact is not supported by our findings, since the CHA did not change significantly their performance during data collection, showing that the agents reached a plateau of learning even in the training phase.
In turn, the operator variable was identified as an independent factor in the variation of results of the Rastreometer (p = 0.0001), showing that the CHA varied their performance amongst themselves. This marked difference between one CHA and another regarding the performance with the Rastreometer indicates that results of the instrument may be linked to the skills of each operator, since there was no difference between the blood pressure means amongst the samples of each CHA (p> 0.05).
Another hypothesis for the large variability between operators was that the gauge needle does not maintain a definite pattern of oscillation in all patients, making it difficult to pinpoint the exact moment when the blood flow starts to flow through the artery and move the gauge needle, which would be the marker of systolic pressure in the Rastreometer. This lack of a definite pattern of oscillation can be attributed to variations in the patient’s
own endogenous characteristics such as volume of blood ejected into the aorta, myocardial contractility and aortic rigidity, since these three factors are determinants of systolic blood pressure23. The lack of a definite pattern of oscillation had already been commented upon by Forsvall9. The small number of cases of high blood pressure in each sample may have emphasized the variability between the CHA by the random bias19.
Although there was variation in performance between the CHA when evaluated in independent samples, the test conducted on a second sample to determine the reproducibility of the method presented the result of substantial concordance (Kendall’s W 0.71). The fact that there is less disagreement among operators when evaluating the same patients in a convenience sample reinforces the influence of the disease spectrum in the accuracy of the instrument, since there was no difference in the mean blood pressure between the accuracy of testing samples (122.7 ± 17.5) and reproducibility (126.9 ± 20.6) with p-value = 0.04.
Evaluations of blood pressure by the methods reference standard and rastreometer performed in non-random sequence was a potential source of bias in our study, by the possibility of overestimation of the first measurements (reference standard), which would result in reduced sensitivity. However, the assessment of arterial BP made by the nurse may have minimized the white coat effect15, since there was no difference between the means of the second and the first measurements of blood pressure (p> 0.05).
Conclusion
The Rastreometer, when operated by community health agents, showed good sensitivity, specificity and reproducibility, especially when evaluated the values of systolic pressure, tending to confirm this new instrument as a method of screening for hypertension in primary health care. The Rastreometer could be used as a tool in the daily work of community health agents assisting in early identification of hypertensive patients, thus, enabling an improvement in the rates of the disease, today one of the greatest difficulties related to hypertension.
Other studies involving health agents in other contexts are needed to validate this new tool. The evaluation of the effectiveness of Rastreometer usage should also be investigated by future randomized studies.
Potential Conflict of Interest
No potential conflict of interest relevant to this article was reported.
Sources of Funding
This study was funded by CNPq, CAPES and partially funded by IC-FUC.
Study Association
References
1. World Health Organization (WHO). World Health Report 2002: reducing risks, promoting healthy life. Geneva (Switzerland); 2002.
2. Sociedade Brasileira de Cardiologia. Sociedade Brasileira de Hipertensão. Sociedade Brasileira de Nefrologia. V Diretrizes brasileiras de hipertensão arterial sistêmica. Arq Bras Cardiol. 2006;89(3):e24-e99.
3. Gus I, Harzheim E, Zaslavsky C, Medina C, Gus M. Prevalence, awareness and control of systemic arterial hypertension in the state of Rio Grande do Sul. Arq Bras Cardiol. 2004;83(5):429-33.
4. Jardim PCBV, Moreira H, Peixoto M, Monego E, Miranda A, Costa C, et al. Knowledge of hypertension and its control in the adult population of a Brazilian state. Am J Hypertens. 2003;16:210A.
5. Sociedade Brasileira de Cardiologia. Sociedade Brasileira de Hipertensão. Sociedade Brasileira de Nefrologia. VI Diretrizes brasileiras de hipertensão arterial. Arq Bras Cardiol. 2010;93(3 supl. 2):1-112.
6. Littenberg B. A practice guideline revisited: screening for hypertension. Ann Intern Med. 1995;122(12):937-9.
7. Wolff T, Miller T. Evidence for the reaffirmation of the U.S. Preventive Services Task Force recommendation on screening for high blood pressure. Ann Intern Med. 2007;147(11):787-91.
8. Gomes MAM, Gomes AMC, Vasconcelos JNG, Silva SM, Magalhães LBNC. Avaliação de método para rastreamento e controle de hipertensos. Revista baiana saúde pública. 2006;30(1):169-78.
9. Forsvall A, Oscarson M, Magalhães LB, Palmeira C, Guimarães AC, Gomes MA, et al. Avaliação do Rastreômetro, um novo equipamento para triagem populacional de pressão arterial elevada em países em desenvolvimento. Arq Bras Cardiol. 2006;87(4):480-6.
10. Ministério da Saúde. Mapas e gráficos da cobertura da estratégia saúde da família - Brasil. 2010 [Acesso em 2010 fev. 16]. Disponível em: http://dab. saude.gov.br/abnumeros.php#historico
11. Automatic Digital Blood Pressure Devices for Clinical Use and also suitable for home/self assessmen. [Acesso em 2008 jun 16]. Disponível em http:// www.bhsoc.org/bp_monitors/automatic.stm
12. Pickering TG, Hall JE, Appel LJ, Falkner BE, Graves J, Hill MN, et al. Recommendations for blood pressure measurement in humans and experimental animals: part 1: blood pressure measurement in humans:
a statement for professionals from the Subcommittee of Professional and Public Education of the American Heart Association Council on High Blood Pressure Research. Hypertension. 2005;45(1):142-61.
13. O’Brien E, Asmar R, Beilin L, Imai Y, Mallion JM, Mancia G, et al. European Society of Hypertension recommendations for conventional ambulatory and home blood pressure measurement. J Hypertens. 2003;21(5):821-48. 14. Arcuri EA. Manguito do esfigmomanômetro e diagnóstico de hipertensão arterial
sistêmica. Arq Bras Cardiol. 1989;52(4):181-3.
15. Mancia G, Parati G, Pomidossi G, Grassi G, Casadei R, Zanchetti A. Alerting reaction and rise in blood pressure during measurement by physician and nurse. Hypertension. 1987;9(2):209-15.
16. Morisky DE, Green LW, Levine DM. Concurrent and predictive validity of a self-reported measure of medication adherence. Med Care. 1986;24(1):67-74. 17. Guyatt G, Sacket D, Haynes B. Avaliando teste diagnósticos. Epidemiologia clínica: como realizar pesquisa clínica na prática. Porto Alegre: Artmed; 2006. p. 305-56. 18. Bossuyt PM, Reitsma JB, Bruns DE, Gatsonis CA, Glasziou PP, Irwig LM, et al. Towards complete and accurate reporting of studies of diagnostic accuracy: the STARD initiative. Standards for Reporting of Diagnostic Accuracy. Clin Chem. 2003;49(1):1-6.
19. Fletcher RH, Fletcher SW, Wagner EH. Diagnóstico: epidemiologia clínica: aspectos essenciais. 3ª. ed. Porto Alegre: Artes Médicas; 1996. p. 52-82. 20. Chobanian AV, Bakris GL, Black HR, Cushman WC, Green LA, Izzo JL Jr,
et al. The Seventh Report of the Joint National Commitee on Prevention Evaluation and Treatment of High Blood Pressure: the JNC 7 report. JAMA. 2003;289(19):2560-72.
21. Izzo JL Jr, Levy D, Black HR. Clinical Advisory Statement: importance of systolic blood pressure in older Americans. Hypertension. 2000;35(5):1021-4.
22. Mancia G, Backe GD, Dominiczak A, Cifkova R, Fagard R, Germano G, et al. 2007 Guidelines for the management of arterial hypertension: the Task Force for the Management of Arterial Hypertension of the European Society of Hypertension (ESH) and of the European Society of Cardiology (ESC). Eur Heart J. 2007;28(12):1462-536.