BaTiO
3(BTO)–CaCu
3Ti
4O
12(CCTO) substrates for microwave
devices and antennas
A. F. L. AlmeidaÆP. B. A. FechineÆ L. C. KretlyÆ
A. S. B. Sombra
Received: 11 August 2005 / Accepted: 15 September 2005 / Published online: 2 May 2006
Springer Science+Business Media, LLC 2006
Abstract The solid state procedure was used to produce bulk ceramics of BTO (BaTiO3), CCTO (CaCu3Ti4O12) and
BTO0.5–CCTO0.5 that were studied in the
medium-fre-quency (MF) range (100 Hz–1 MHz) and in the microwave range of frequencies. The presence of BTO is decreasing the dielectric constant (er) of the BTO–CCTO composite. The
CCTO and BTO samples present a strong tendency to the increase of the loss with frequency. The BTO substrates are presenting higher values of theerin the range of 1–4 GHz
(around 140). For pure CCTO the dielectric constant is around 37.6. Similar behaviour observed at the MF range, that the higher dielectric constant is also associated to the higher loss is also present in the microwave region. The study of a planar microstrip antenna, that uses the BTOX–
CCTO(1)X)ceramic as a highersubstrate was done.
There-fore, these measurements confirm the potential use of such materials for small high dielectric planar antennas (HDA). These materials are also very promising for capacitor applications and certainly for microelectronics, microwave devices (cell mobile phones for example), where the miniaturization of the devices is crucial.
Introduction
High dielectric constants have been found in oxides of the type CaCu3Ti4O12[1–3] (CCTO) which shows a dielectric
constant (er) at 1 kHz of about 10,000 that is nearly
con-stant from room temperature to 300 C. Oxides with the perovskite structure are well stabilised by their high dielectric constants (er) which lead these class of materials
to a big number of technological applications [4]. How-ever, this behaviour is generally associated to ferroelectric or relaxor properties. In these cases the highest value ofer
is obtained during a phase transition (as a function of temperature) presented by the material.
The existence of the transition temperature event is generally a problem when one is talking about applications of these materials. The reported results for CCTO shows that the er is high but with small dependence on the
temperature [3].
Such material is very promising for capacitor applica-tions and certainly for microelectronics, microwave devices (cell mobile phones for example), where the miniaturization of the devices are crucial.
High er ceramics make it possible to noticeably
minia-turize passive microwave devices. Their size can typically be reduced in comparing with classical resonators and filters by a factor of ffiffiffiffie
r
p
(relative dielectric constant). The structure of CCTO was previously determined from neutron powder diffraction data [5]. It belongs to space group Im3 (No. 204) [5]. Recently we propose the use of mechanical alloying to produce CCTO [6]. The mechanical alloying is proving to be a powerful technique to obtain any quantity of powder with controlled microstructure [7]. Recently a polymeric citrate precursor route was used to produce CCTO [8]. It was observed dielectric constant of 3000 and loss around 0.3–0.35 at 1 kHz.
A. F. L. AlmeidaÆP. B. A. Fechine
Departamento de Quı´mica Orgaˆnica e Inorgaˆnica, Centro de Cieˆncias, UFC, Fortaleza, Ceara´, Brazil
L. C. Kretly
Departamento de Microondas e O´ ptica (DMO), Faculdade de Engenharia Ele´trica e Computac¸a˜o (FEEC), UNICAMP, SaoPaulo, Brazil
A. S. B. Sombra (&)
ÆA. F. L. AlmeidaÆP. B. A. Fechine
Laborato´rio de Telecomunicac¸o˜es e Cieˆncia e Engenharia dos Materiais (LOCEM), Departamento de Fı´sica, UFC Campus do Pici, Caixa Postal 6030, CEP 60 455-760 Fortaleza, CE, Brazil e-mail: [email protected]
Barium titanate (BaTiO3-BTO), a well known
ferro-electric material, has a high diferro-electric constant (er) around
6000 at a fine grain size of~1lm, and of 1500–2000 at a coarse grain size [9, 10]. Theervalue of BTO at the Curie
temperature of 120C can reach a peak value as high as 10,000, but decrease as the temperature decreases. Chem-ical additives or so called shifters have been applied to BTO to move the Curie peak value towards room tem-perature to improve theervalue, and to smooth the Curie
peak to obtain a lower temperature coefficient of theer.
Dielectric properties of BTO ceramics are highly dependent upon the grain size, phase content of the ceramic body and also the type of dopants used. For BTO powder, its behavior is also related to the particle size, phase con-tent, and the dopants added. Cubic BTO (c-BTO) powder transforms to the tetragonal phase (t-BTO) if its size is larger than 30 nm [11]. Powder with a size of 40–80 nm contains a single domain. Crystallites with a size larger than 80 nm will be miltidomain t-BTO [12]. The increase of the dielectric constant is possibly caused by a summa-tion of the domain size and the stress effect [13]. It is also mentioned that the width of ferroelectric 90 domains decrease proportional to the square root of the grain diameter for grains with size <10lm [13]. The removal of grain boundaries, i.e. elimination of constrained forces from neighboring grains and a drop in domain density as the particle size decreases, may reduce theervalue of the
BTO powders. With increasing particle size, unsintered powder eventually becomes a ceramic-like body and pos-sesses similar properties as the ceramics [14]. Therefore, ceramics and powders of BTO can show a different dielectric behavior, depending on the particle size.
In this paper we report the preparation of the composite ceramic of BTOX–CCTO1)X(withX = 0, 0.5 and 1 where
it represents the presence of each phase (100·%)) through the solid state route and use the bulk ceramic as a substrate for a planar microwave antenna application. The produced samples were studied using X-ray diffraction and the dielectric constant and loss were also studied in the MF range (100 Hz to 1 MHz) and in the microwave range.
The production, and the study of the properties of the BTO–CCTO ceramics is important in view of possible applications as bulk devices like microwave resonators and oscillators, thick and thin higherfilms.
Experimental procedure
Sample preparation
Commercial oxides Ca(OH)2 (Vetec, 97% with 3% of
CaCO3), titanium oxide (TiO2) (Aldrich, 99%), CuO
(Aldrich, 99%) were used in the CCTO preparation. The
material was ground on a Fritsch Pulverisette 6 planetary mill with the proportionality of Ca(OH)2–3CuO–4TiO2.
Milling was performed in sealed stainless steel vials and balls under air. Mechanical alloying was performed for 1 h of milling. In this case the milling was used only to give a good homogeneity of the powder. However, we already showed in the literature that for 100 h of milling the complete production of CCTO is possible [6]. The reaction occurring during milling can be summarised as:
CaðOHÞ2þ3CuOþ4TiO2 ! Impacts
CaCu3Ti4O12þH2O
The ceramic was submitted to calcination and sintering in air in the range of 900–1100C for 12 h. This ceramic is called CCTOCS (calcination + sintering). The pellets were then sintered at 1050C for 24 h. The denomination for these samples will be CCTO (see Table 1).
BTO powder preparation
The used BTO powder was a commercial product (BaTiO3
-Aldrich). This ceramic is called BTO.
In this paper one has three types of bulk ceramics: BTO (100% BTO), CCTO (100% CCTO) and BTO0.5–CCTO0.5
(In this ceramic one has 50% of each component) where the percentage is given in weight %. The BTO bulk cera-mic was prepared from the commercial powder and the ceramic was sintered at 980 C for 24 h. For the composite ceramic (BTO0.5–CCTO0.5) the samples were also sintered
at 980 C for 24 h.
XRD
The X-ray diffraction (XRD) patterns were done using a Siemens D5000 equipment with CuKa radiation in a
Bragg–Brentano geometry at room temperature (300 K) by step scanning using powdered samples. We used five seconds for each step of counting time, with a CuKatube at
40 kV and 25 mA.
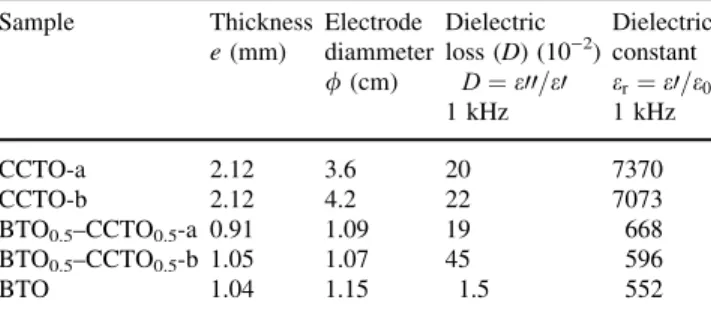
Table 1 Medium frequency(MF) measurements of the dielectric constant and dielectric loss of the samples(f=1 kHz)
Sample Thickness
e(mm)
Electrode diammeter
/(cm)
Dielectric loss (D) (10)2)
D¼e00=e0
1 kHz
Dielectric constant
er¼e0=e0
1 kHz
CCTO-a 2.12 3.6 20 7370
CCTO-b 2.12 4.2 22 7073
BTO0.5–CCTO0.5-a 0.91 1.09 19 668
BTO0.5–CCTO0.5-b 1.05 1.07 45 596
Electrical measurements
The dielectric and loss measurements were obtained from a HP 4291A Impedance Analyzer, which cover the region of 100 Hz–1 MHz. The dielectric permittivity (er) and
dielectric loss (D) measurements, were performed using a parallel plate capacitor arrangement. The samples were formed into thin circular disks with diameter around / = 1–5 cm and thickness around e= 0.9–2.2 mm (see Table 1). The Ag (circular electrodes) were screen printed at each surface and fired at 400C for 1 h.
The resonance measurements in the range of 9 kHz– 4 GHz range was done in a conventional set up, measuring the S11parameter using a HP 8714 ET or ZVRE (Rohde &
Schwarz) Network Analyzers.
The used samples for the low frequency region (100 Hz–1 MHz) and for the microwave region are described in Tables 1 and 2. For the three different sam-ples: BTO, CCTO and BTO0.5–CCTO0.5, one has different
geometries for the measurements. For the samples in the same phase, the preparation procedure was the same. The only difference is associated to the sample geometry (like CCTO-a and CCTO-1).
In the low frequency region we have samples CCTO-a, and CCTO-b, BTO0.5–CCTO0.5-a, BTO0.5–CCTO0.5-b and
BTO (see Table 1). For the microwave region we have samples CCTO-1, 2 and 3 and BTO0.5–CCTO0.5-1, 2, 3 and
BTO-1, 2, 3 (see Table 2).
Model for microstrip radiator
The test structure used for dielectric constant measure-ments is a resonant-style radiator shown in Fig. 1a, b. The patch antenna is fed by a microstrip line in direct contact to the patch conductor of lengthLand widthW. There are several models related to the planar patch antenna analysis. Among them are: transmission line model, cavity model and full-wave analysis [12]. Microstrip antennas resemble dielectric loaded cavities. A well accepted model detailed in [12, 13]. Due to the field configuration at the edges, the antenna has two radiation
edges and two resonant edges. The radiation of the an-tenna takes place from the two slots comprising between the W edges and ground plane. The L edges are the res-onant dimensions (see Fig. 1a). The transmission line model approaches the microstrip antenna as two slots separated by a low impedance transmission line (the patch) of length L. For the dominant mode TM010 which
is the dominant mode with the lowest frequency, the resonant frequency is given by [13]
fr¼
c 2ðLþ2DLÞ ffiffiffiffiffiffiffiffie
reff
p ð1Þ
where DL is the additional line length to account the fringing fields which has a practical approximation given by [13]:
Table 2 Microwave
measurements of the samples Planar antenna
measurements
Thickness
e(mm)
Sample diameter/(cm)
Resonant
frequency—fR(GHz)
eeff er Q
)1(10)2)
Samples
CCTO)1 2.61 4.7 2.95 30.8 41.6 10
CCTO-2 2.29 4.7 2.9 25 33.7 3
BTO0.5–CCTO0.5-1 2.47 4.63 1.93 60.4 80 13.9
BTO0.5–CCTO0.5-2 2.46 4.66 2.02 55.1 73 20.7
BTO0.5–CCTO0.5-3 2.53 4.68 1.87 64.3 85.5 13
BTO-1 2.44 4.98 1.29 135.2 179.3 113
BTO-2 2.3 5 1.55 93.6 123.2 172
BTO-3 2.46 4.98 1.59 88.9 118 167
Feed point
L
L
r W
W
Radiating slot a
b
h ε
Microstrip Antenna
CCTO Substrate
0 5 cm
SCALE
DL
h ¼0:412
ereffþ0:3
ð Þ W
h þ0:264
ereff0:258
ð Þ W
h þ0:8
ð2Þ
and the ereff is the effective dielectric constant (where
effective means: a composite value of the overall dielec-trics in the system which involves the dielectric constant of material itself and the air). In general 1<ereff <er, the
fringing effects on the microstrip gives:
ereffðWÞ ¼
erþ1
2 þ
er1
2 FðW=hÞ ð3Þ
and
FðW=hÞ ¼ ð1þ12h=WÞ
1=2
þ0:04 1ð W=hÞ2 W=h1 1þ12h=W
ð Þ1=2 W=h1 (
ð4Þ
For the measurements in this work we have used a square microstrip antenna withW= L= 1 cm.
The resonant frequency is precisely measured using a Network Analyser and measuring the return loss (in dB) through the S11 scattering parameter of the antenna under
test. The very precise resonant frequency identification is done trough the lowermost point in the S11 curve (see
Fig. 2). The S11 test is the main test for antennas. This
parameter shows the reflections of the signal at the feeding point, the entrance of the antenna. High negative values (typically between )12 and )40 dB) in the dip (see
Fig. 3a–c) indicate that the electromagnetic waves were not reflected. It means that the antenna is radiating. In the )10 dB line, there is an antenna bandwidth, BW, (almost
equal to VSWR : 2:1). With this data the antenna personnel might be able to estimate the radiation performance to a certain degree.
The er value is extracted from the expressions above
with the correction related to the fringing fields. There are other methods for er measurements but this one is
straightforward because the test structure is close to the final application structure.
Essentiallyeris determined from the resonant frequency
at fR and Q
)1
(the loss factor) is determined from Df/fR, where Df (BW) is the 10 dB bandwidth of the resonance (see Table 1).
Results and discussion
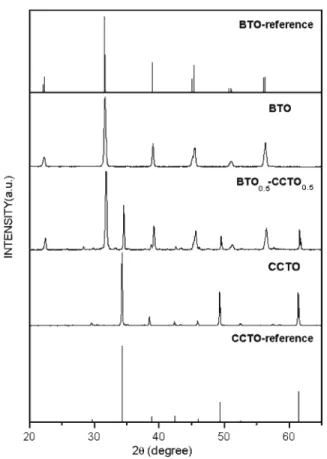
Figure 4 shows the X-ray diffraction (XRD) patterns of the substrates BTO, CCTO and BTO0.5–CCTO0.5together with
the XRD of the references (JCPDS), obtained from the literature. In the same figure one starts with the XRD of the BTO substrate. For sample BTO0.5–CCTO0.5the presence
of BTO and CCTO is easily identified and for the ceramic CCTO, the presence of CCTO is quite clear
In Figs. 5 and 6 one has the dielectric permittivity (er)
of all the samples (CCTO-1,CCTO-2, BTO0.5–CCTO0.5-a,
BTO0.5–CCTO0.5-b, and BTO) in the range of 100 Hz–
1 MHz. For all the samples there is a decrease of the er
value for this range of frequency. For the CCTO-1 and CCTO-2 samples, the dielectric constant is high. For samples CCTO-1 and CCTO-2 the value at 100 Hz, er
~10,000 decreases to 4000 at 1 MHz. In Fig. 7 one has
the dielectric loss for these two samples. At low fre-quencies (1 kHz) the samples CCTO-1 and CCTO-2 present the loss tangent (D) around 0.2 (see also Table 1). The loss is increasing with the frequency and is around 0.35 and 0.6 for the same samples around 1 MHz. The increase of the loss for the CCTO samples with frequency was reported in the literature by others authors [8]. In Table 1 one has the dielectric constant and loss for all the samples at 1 kHz.
In Fig. 6 one has the dielectric permittivity (er) of the
samples (BTO0.5–CCTO0.5-a, BTO0.5–CCTO0.5-b, and
BTO) in the range of 100 Hz to 1 MHz. One can observe that for the BTO sample the dielectric constant (er) is quite
stable with frequency. It is around 552 at 1 kHz. However, for the samples where the BTO and CCTO form a com-posite ceramic, the dielectric constant is also decreasing with frequency. One can conclude that the presence of the BTO is decreasing the dielectric constant (see Table 1) for f= 1 kHz. However, the presence of BTO is giving to the Fig. 2 Dielectric permittivity for 1 kHz and in the microwave range.
CCTO a low decrease rate for the dielectric constant with frequency. Around 10 kHz there is an inversion of values forer. The BTO values are higher compared to the BTO–
CCTO samples for higher frequencies. One can expect that at higher frequencies the BTO values should be bigger.
This kind of behavior will be very critical at higher frequencies (microwave range).
In Fig. 8 one has the dielectric loss for these three samples. At low frequencies the samples BTO0.5–CCTO0.5
-a -and BTO0.5–CCTO0.5-b present higher loss compared to
Fig. 3 (a) The resonant frequency of the microstrip antenna of sample CCTO-1, measured trough the S11parameter (return loss).
The bandwidth is obtained at )10 dB which correspond to
VSWR < 2:1. (b) The resonant frequency of the microstrip antenna of sample BTO0.5 CCTO0.5-3, measured trough the S11 parameter
(return loss). The bandwidth is obtained at)10 dB which correspond to VSWR < 2:1. (c) The resonant frequency of the microstrip antenna of sample BTO-1, measured trough the S11parameter (return loss).
The bandwidth is obtained at )10 dB which correspond to
the BTO sample. However, the previous behavior obtained for the CCTO samples where the loss was increasing with frequency is no longer observed.
The loss tangent (D) is decreasing with the frequency for samples BTO0.5–CCTO0.5-a and BTO0.5–CCTO0.5-b. The
BTO sample present the lowest loss obtained for all the samples, it is around 0.015 at 1 kHz. However, there is a little tendency of increasing with frequency. Comparing the BTO sample and the BTO–CCTO samples, one can expect
that at higher frequencies the BTO substrate could have higher loss compared to the composite ceramic.
In Table 1 one has the dielectric constant and loss for all the samples at 1 kHz. In summary one can say that the presence of BTO is decreasing the dielectric constant (er)
from an average value of 7222 (CCTO) to an intermediate value of 632(BTO0.5–CCTO0.5), and finally to 552(BTO).
The CCTO samples present a strong tendency to the increase of the loss with frequency, which is also happen to the BTO sample however with much lower velocity and from very low values of this loss. The composite ceramic (BTO0.5–CCTO0.5) is presenting a tendency to decrease the
loss with frequency, which seems to be a mixing effect of the two phases.
To investigate the potential application of the BTOX–
CCTO1)Xmaterials for microwave planar devices, a series Fig. 4 Comparison of the XRD of the samples BTO, CCTO and
BTO0.5–CCTO0.5with the BTO and CCTO references
Fig. 5 Dielectric constant (er) of samples CCTO-a and CCTO-b in
the frequency range of 100 Hz–1 MHz
Fig. 6 Dielectric constant (er) of samples BTO0.5CCTO0.5-a, BTO0.5
CCTO0.5-b and BTO in the frequency range of 100 Hz–1 MHz
of planar microstrip antennas were done. The demand for new mobile communication systems will push hard to miniaturization and low volume devices and equipment. Due to these requirements in portable, or repeater stations in a mobile communication for cellular systems, for example, high dielectric constant materials can be used to effectively reduce the size of planar microstrip antennas [11].
The performance of a planar antenna is related to theL andWdimensions of the patch and the dielectric constante of the substrate. For the best compromise between antenna gain, efficiency, bandwidth and volume, an adequate material with a highemust be found for low volume. Of course, there is a trade off: high dielectric constant mate-rials give a low volume antenna but it imposes low band-width and gain. Moreover, there is a demand for monolithic integration of antennas and associated circuitry and these requirements claim compatible high dielectric constant materials.
The simple rectangular antenna prototypes were designed on substrate samples with nominally 4–5 cm in diameter and 2–3 mm thick (see Table 2 and Fig. 1a, b). The resonant frequency (fR) was obtained in the range of 1–
4 GHz, based on the dielectric constant available data [1–3, 8]. One of the experimental antennas is shown in Fig. 1b (sample CCTO).
All the samples show the electromagnetic radiator potential properties, that is, antenna. This is proved when the dips in the S11 measurements reach lower values than
)10 dB. The )10 dB point in the S11 parameter corre-sponds to a VSWR of 2:1. The S11 parameters for the
antennas (return loss) were measured, and the results are
shown in Fig. 3a–c for the CCTO-1, BTO0.5–CCTO0.5 -3
and BTO-1 antennas (as examples of all the eight studied antennas). The VSWR < 2:1 ()10 dB line) criterion was used to identify the antenna bandwidth and the dip in the S11measurement below)10 dB is a preliminary indicator
of the electromagnetic radiation properties of the device. In Table 2 one has the general characteristics of all the studied antennas. In this table one can find the geometry of the substrate (eight samples). In Table 2 one has also the values of the er (in the microwave region),eeff (effective
dielectric constant), and the loss factorQ)1(obtained from the S11and is given byQ=fR/BW).
From Table 2 one can conclude that the higher values of theerin the range of 1–4 GHz antennas is presented by the
BTO substrates. For the three BTO samples the average value foreris around 140. With the presence of CCTO in
the samples (BTO0.5–CCTO0.5) this average value of theer
decrease to 79.5. For pure CCTO the dielectric constant is around 37.6. The highest value for the dielectric constant was obtained for the BTO-1 sample, which was around 179. The lowest one was obtained for the CCTO-2 sample (33.7), see Table 2. This sample also presents the lowest value of the loss factor (Q)1) which is around 3Æ10)2.
It was observed that the highest value for the dielectric constant is also associated with high loss factor (Q)1). The highest loss factor (Q)1) was obtained for the BTO-2 sample, which is around 172Æ 10
)2
(see Table 2). Similar behaviour observed at low frequencies, that the higher dielectric constant is also associated to the higher loss is also present in the microwave region.
The higher value forerobtained for the BTO substrate
compared to the BTO–CCTO substrate is in agreement with the low frequency measurements (see Fig. 6) where the BTO value for er was bigger compared to the BTO–
CCTO substrate for frequencies over~10 kHz. The higher value obtained for the loss factor (Q)1) obtained for BTO compared to the BTO–CCTO substrates is also in agree-ment to the low frequency measureagree-ments that shows a tendency of increasing and decreasing loss (D) with frequency, for BTO and BTO–CCTO, respectively.
One can conclude that the presence of CCTO in the BTO ceramic is presenting quite distinct behaviour when one compares the MF range and microwave regions of the spectra. In the low frequency region the increase of the CCTO presence is increasing the dielectric constant (up to 1 kHz frequency). However, in the microwave region one has the opposite behaviour. The presence of the CCTO phase is decreasing the ervalue (see Tables 1 and 2) and
the loss factor.
We have to emphasize that the loss factor obtained in the present device is associated to an open cavity. In this case the substrate loss and the radiating loss are operating together.
Fig. 8 Dielectric loss (D=tga) of samples BTO0.5 CCTO0.5-a,
BTO0.5 CCTO0.5 -b and BTO in the frequency range of 100 Hz–
The classic treatment applied for two or more phases present in a dielectric are associated to the dielectric mixing rules that fix a limit to the dielectric constant that can be achieved with the mixed phase. The empirical logarithmic rule for the dielectric constant (er) and the
dielectric constants (erI) of the individual phases is given by
[14]
loger¼
X
I
VIlogerI ð5Þ
In Fig. 2 one has the plot of the dielectric constant as a function of the substrate composition for the microwave region and forf= 1 kHz, based in Eq. 5.
The dotted line and continuous line are associated to the value of er obtained from Eq. 5, at 1 kHz and in the
microwave region, respectively.
The experimental points of the samples are also indi-cated in the figure. One can easily conclude that the addition of CCTO is increasing theerof the substrate at 1
of frequency. However, forx= 0.5 the experimental value of the dielectric constant is much lower than (average value ofer~ 632) compared to the expected value suggested in
Eq. 5 (er~2021). This is an unexpected behaviour. It means
that the composite is not following the linear regime of the model.
However, in the microwave range the addition of CCTO is decreasing theervalue and all the samples are in good
agreement with the proposed model in the composite ceramic substrate (see Eq. 5 and Fig. 2).
In summary, three different substrates of BTO, CCTO and BTO0.5–CCTO0.5 were studied in the medium
frequency (MF) and microwave range of frequencies. The dielectric permittivity (er) of all the samples in the
range of 100 Hz–1 MHz were studied (MF). For all the samples there is a decrease of theervalue with frequency
for this range of studied frequencies. For samples CCTO-1 and CCTO-2 the value at 100 Hz,er~10,000 decreases to
4000 at 1 MHz. At low frequencies these samples present the loss tangent (D) around 0.2. The loss is increasing with the frequency and is around 0.35 and 0.6 for the same samples around 1 MHz.
The dielectric permittivity (er) of the samples (BTO0.5–
CCTO0.5-a, BTO0.5–CCTO0.5-b, and BTO) were studied in
the range of 100 Hz to 1 MHz. One can observe that for the BTO sample the dielectric constant (er) is quite stable with
frequency. It is around 552 at 1 kHz. However, for the samples where the BTO and CCTO form a composite ceramic, the dielectric constant is also decreasing with frequency. One can conclude that the presence of the BTO is decreasing the dielectric constant for f= 1 kHz. However, the presence of BTO is giving to the CCTO a lower decrease rate for the dielectric constant with
frequency. Around 10 kHz there is an inversion of values for er. The BTO values are higher compared to the BTO–
CCTO samples.
The dielectric loss for the samples BTO0.5–CCTO0.5-a
and BTO0.5–CCTO0.5-b are higher compared to the BTO
sample.
Comparing the loss behavior with frequency for the BTO and the BTO–CCTO samples, one can expect that at higher frequencies the BTO substrate could have higher loss compared to the composite ceramic.
From the analysis of the antenna operation of the sam-ples, one can conclude that the higher values of theerin the
range of 1–4 GHz antennas is presented by the BTO sub-strates. For the three BTO samples the average value forer
is around 140. With the presence of CCTO in the samples (BTO0.5–CCTO0.5) this average value of theerdecrease to
79.5. For pure CCTO the dielectric constant is around 37.6. The highest value for the dielectric constant was obtained for the BTO-1 sample, which was around 179. The lowest one was obtained for the CCTO-2 sample (33.7). This sample also presents the lowest value of the loss factor (Q)1) which is around 3Æ 10
)2
.
The amazing result of this series is that the highest value for the dielectric constant is also associated with high loss factor (Q)1). Similar behaviour observed at low frequen-cies, that the higher dielectric constant is also associated to the higher loss is also present in the microwave region.
Considering the classic treatment applied for two or more phases present in a dielectric and the empirical log-arithmic rule for the dielectric constant (er) and the
dielectric constants (erI) of the individual phases one
con-clude that in the microwave region of the spectra the value of the dielectric constant is in good agreement with the rule. However, in the low frequency region of the spectra the deviation is quite strong.
Conclusions
In conclusion, the traditional ceramic procedure was used to produce bulk ceramics of BTO (BaTiO3), CCTO
(Ca-Cu3Ti4O12) and BTO0.5–CCTO0.5and were studied in the
MF and microwave range of frequencies.
For all the samples there is a decrease of the er value
with frequency for the MF range of the of studied fre-quencies. For samples CCTO-1 and CCTO-2 the value at 100 Hz, er ~10,000 decreases to 4000 at 1 MHz. At low
at 1 kHz. However, for the samples where the BTO and CCTO form a composite ceramic, the dielectric constant is also decreasing with frequency. One can conclude that the presence of the BTO is decreasing the dielectric constant forf= 1 kHz. However, the presence of BTO is giving to the CCTO a lower decrease rate for the dielectric constant with frequency. Around 10 kHz there is an inversion of values forer. The BTO values are higher compared to the
BTO–CCTO samples. The dielectric loss for the samples BTO0.5–CCTO0.5-a and BTO0.5–CCTO0.5-b are higher
compared to the BTO sample.
From the microstrip antenna operation of the samples, the highest value for the dielectric constant was obtained for the BTO-1 sample, which was around 179. The lowest one was obtained for the CCTO-2 sample (33.7). This sample also presents the lowest value of the loss factor (Q)1) which is around 3Æ10
)2
.
One can say that the presence of CCTO in the BTO ceramic is presenting quite distinct behaviour when one compares the MF range and microwave regions of the spectra. In the low frequency region the increase of the CCTO presence is increasing the dielectric constant (up to 1 kHz frequency). However, in the microwave region one has the opposite behaviour. The presence of the CCTO phase is decreasing theervalue and the loss factor.
In summary the performance of a planar microstrip antenna, that uses the BTOX–CCTO(1)X)ceramic as a high
ersubstrate was examined. Therefore, these measurements
confirm the potential use of such materials for small high dielectric planar antennas (HDA). These materials are also very promising for capacitor applications and certainly for
microelectronics, microwave devices (cell mobile phones for example), where the miniaturization of the devices is crucial.
Acknowledgments This work was partly sponsored by Ericsson EDB, Ericsson Research Center Brazil, under contracts Ericsson/ UFC-06 and UNI.15/00 and by FUNCAP,FINEP, CNPq, CAPES (Brazilian agencies).
References
1. Subramanian MA, Li D, Duran N, Reisner BA, Sleight AW (2000) J Sol State Chem 151:323
2. Ramirez AP, Subramanian MA, Gardel M, Blumberg G, Li D, Vogt T, Shapiro SM (2000) Solid State Commun 115:217 3. Subramanian MA, Sleight AW (2002) Solid State Sci 4:347 4. Setter N, Colla EL (1993) Ferroelectric ceramics. Birkhauser
Verlag
5. Bochu B, Deschizeaux MN, Joubert JC (1979) J Solid State Chem 29:291
6. Almeida AFL, de Oliveira RS, Go´es JC, Sasaki JM, Mendes Filho J, Sombra ASB (2002) Mat Sci Eng B 96:275
7. de Figueiredo RS, Messai A, Hernandes AC, Sombra ASB (1998) J Mat Sci Lett 17:449
8. Jha P, Arora P, Ganguli AK (2002) Mat Lett 4179:1
9. Kolev N, Bontchev RP, Jacobson AJ, Popov VN, Hadjiev VG, Litvinchuk AP, Iliev MN (2002) Phys Rev B 66:132102 10. Music S, Gotic M, Ivanda M, Popovic S, Turkovic A, Trojko R,
Sekulic A, Furic K (1997) Mat Sci Eng B 47:33
11. Lee B, Harackiewicz FJ (2002) IEEE Trans Antennas Propaga-tion 50(8):1160
12. Balanis EA (1997) Antenna theory—analysis and design, 2nd edn. John Wiley & Sons
13. Garg R, Bhartia P, Bahl I, Ittipiboon A (2001) Artech House 14. In: Buchanan RC (ed) (1991) Ceramic materials for electronics.