ENERGY EFFICIENCY IMPROVEMENT BY
GEAR SHIFTING OPTIMIZATION
by
Ivan A. BLAGOJEVI]a*, Goran S. VOROTOVI]a, Gradimir S. IVANOVI]a,
Slobodan P. JANKOVI]b, and Vladimir M. POPOVI]a aFaculty of Mechanical Engineering, University of Belgrade, Belgrade, Serbia bFaculty of Technical Science “Mihajlo Pupin”, University of Novi Sad, Zrenjanin, Serbia
Original scientific paper DOI: 10.2298/TSCI120129035B
Many studies have proved that elements of driver’s behavior related to gear selec-tion have considerable influence on the fuel consumpselec-tion. Optimal gear shifting is a complex task, especially for inexperienced drivers. This paper presents an imple-mented idea for gear shifting optimization with the aim of fuel consumption minimization with more efficient engine working regimes. Optimized gear shifting enables the best possible relation between vehicle motion regimes and engine work-ing regimes. New theoretical-experimental approach has been developed uswork-ing on-board diagnostic technology which so far has not been used for this purpose. The matrix of driving modes according to which tests were performed is obtained and special data acquisition system and analysis process have been developed. Functional relations between experimental test modes and adequate engine work-ing parameters have been obtained and all necessary operations have been con-ducted to enable their use as inputs for the designed algorithm. The created model has been tested in real exploitation conditions on passenger car with Otto fuel in-jection engine and on-board diagnostic connection without any changes on it. The conducted tests have shown that the presented model has significantly positive ef-fects on fuel consumption which is an important ecological aspect. Further devel-opment and testing of the model allows implementation in wide range of motor ve-hicles with various types of internal combustion engines.
Key words: gear shifting, optimization, on-board diagnostic, motor vehicles, fuel consumption, engine working parameters
Introduction
Results of more studies [1, 2] with arguments point out that manual gear shifting may be considered as an automatic process performed routinely but only for experienced drivers. Un-like them, for drivers who have just been granted driving license this process requires a mental effort. Automation is therefore acquired through experience which is mostly independently ac-quired by a driver, without any subsequent suggestions based on facts.
In addition, by detailed analysis of the relation between driver’s behavior and fuel con-sumption [3-5] it was proved that those elements of driver’s behavior, related to gear selection, driving speed and acceleration, and/or deceleration have the largest influence on the fuel con-sumption. The fuel consumption at the same average driving speed can be increased up to 20% only due to difference in the manner of gear shifting [6].
Very picturesque overview of the effect of gear selection on the fuel consumption at some driving speeds can be observed in the shown graph (fig. 1) as the result of investigations carried out by Volkswagen with a passenger car [7]. The in-crease of fuel consumption in percentages when driving in third and fourth gear is shown relative to the fuel consumption when driving in fifth gear at speed of 50 km/h and 90 km/h (fuel consumption in fifth gear at speed of 50 km/h was accepted as the reference value – 100%). When differences in fuel consumption in different gears at the same conditions are perceived, it can be concluded that
significant savings in fuel consumption can be achieved by adequate selection, which has both large economic and environmental significance.
For resolving the issue of timely gear shift to the large extent would contribute the de-vices in the vehicle gear shift indicator (GSI) which would unequivocally indicate to drivers, both inexperienced, and experienced which gear they should use, and in which moment [8-11].
A group of experts from Germany [12] submitted to the Economic Commission for Europe, namely to its Working Party on Pollution and Energy (GRPE) a proposal of amend-ments to the Regulation No. R83 with 05 series of amendamend-ments in which they proposed changes in testing procedure by using so called special gear shifting strategy which defines gear shift points. They start their proposals of amendments by introducing a new paragraph proposing the definition: “Technical gear shift instrument means an information device or display, clearly per-ceptible (visible or acoustic) to the driver, which indicates proposed gear shifts in the case of special gear shifting strategy according to the manufacturer's instructions”. In this way, the ex-perts from Germany as the proposers try to introduce for the first time the concept of gear shift indicator in some regulation relating to motor vehicles.
Taking into account everything laid down in connection with the presented issue, to the authors of this paper was imposed the subject of investigation which represents a study of timely and optimal gear shift from the aspect of decreasing fuel consumption. At the same time, the functional dependence of some operating parameters of internal combustion (IC) engine and output vehicle performances in some gears of transmission in real service conditions, as well as the possibility of their optimization was included. Objective of the investigation is the model of gear shifting optimization of motor vehicle with manual transmission aiming at achieving the minimum fuel consumption for the required performances while using on-board diagnostic (OBD) system in vehicle, thus improving the energy efficiency in road transport.
Experimental monitoring and investigation of characteristic parameters in different driving modes
Selection of characteristic parameters
which in passenger vehicles has been mandatory for a longer time period (USA since 1996, EU since 2001 for Otto engines). In this way, the subsequent fitting of new data acquisition systems into vehicles is avoided. Also, it was taken into account that characteristic parameters belong to the group of so called standard parameters of OBD system to which the access is enabled in all vehicles if the application is mandatory. The investigations are limited to a passenger vehicle with fitted Otto engine and electronic fuel injection system. Group of selected characteristic pa-rameters includes:
(a) calculated load value –L[%]; Represents the ratio of current intake air flow and maximum possible intake air flow at the appropriate engine speed. This means that for readout value of e.g. 33% at certain engine speed it can be said that the engine at such engine speed was loaded only one third of the maximum possible load;
(b) mass air flow – MAF [gs–1]; Represents intake air mass flow based on which value and the
need for stoichiometric combustion is determined the required fuel quantity. This indicates the fact that apart from modes at which additional mixture enrichment is performed the current fuel consumption can be perceived through the value of mass air flow. In this respect, the monitoring of this parameter is of a particular significance since it enables perceiving the differences in fuel consumption at different modes, and its values have comparative character and were not used for the calculation of absolute values of current consumption which were not of importance in the investigation;
(c) throttle position –Ø[%]; Defines the degree of throttle opening, and can be approximated by the position of accelerator pedal;
(d) O2 sensor voltage – O2 [V]; Classification of this parameter in so called characteristic parameters is for the purpose of perceiving the modes which require additionally enriched mixtures (whereat mixture composition is not stoichiometric);
(e) engine speed –n[rpm], and (f) vehicle speed –v[kmh–1].
In the group of characteristic parameters, but only as a control parameter since it can-not be considered as sufficiently precise, is also included parameter of the average fuel con-sumption –lmean[l·(100 km)–1] which can be monitored through vehicle on-board computer.
Obtaining the data in real time at different driving modes
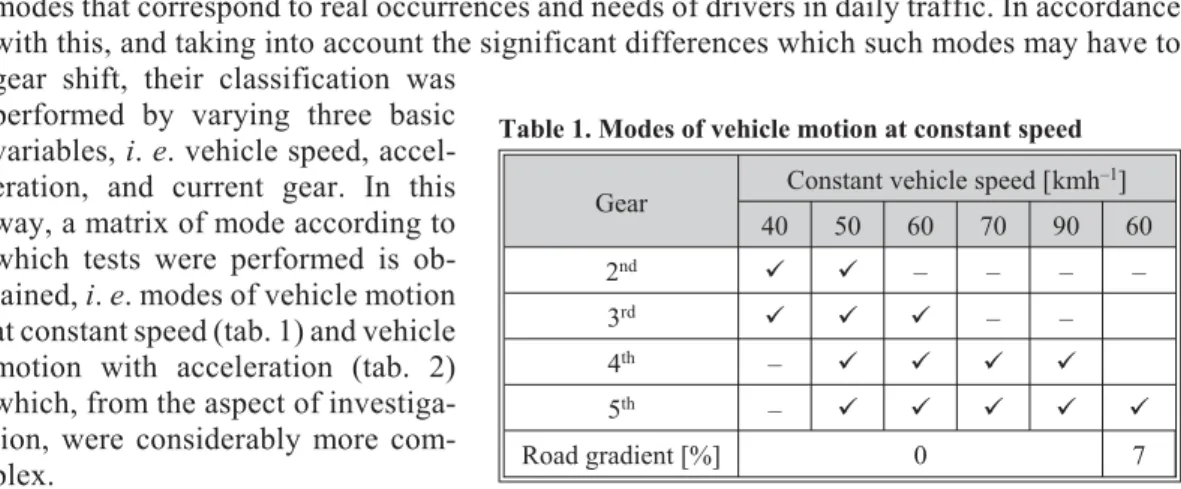
Basic condition to obtain the database of selected parameters of the vehicle opera-tion, and its engine is the implementation of experimental testing of the vehicle concerned in modes that correspond to real occurrences and needs of drivers in daily traffic. In accordance with this, and taking into account the significant differences which such modes may have to gear shift, their classification was
performed by varying three basic variables,i.e. vehicle speed, accel-eration, and current gear. In this way, a matrix of mode according to which tests were performed is ob-tained,i.e. modes of vehicle motion at constant speed (tab. 1) and vehicle motion with acceleration (tab. 2) which, from the aspect of investiga-tion, were considerably more com-plex.
Table 1. Modes of vehicle motion at constant speed
Gear Constant vehicle speed [kmh
–1]
40 50 60 70 90 60
2nd ü ü – – – –
3rd ü ü ü – –
4th – ü ü ü ü
5th – ü ü ü ü ü
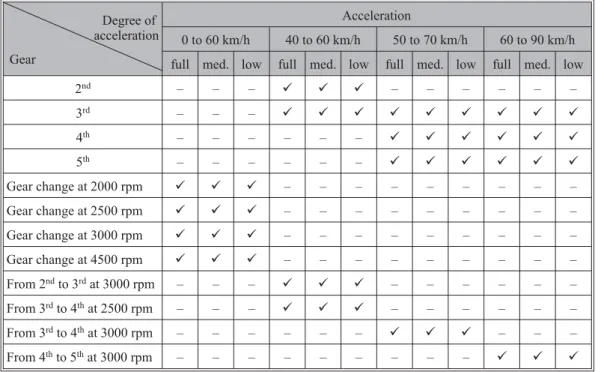
Table 2. Modes of vehicle motion with acceleration
Degree of acceleration
Gear
Acceleration
0 to 60 km/h 40 to 60 km/h 50 to 70 km/h 60 to 90 km/h
full med. low full med. low full med. low full med. low
2nd – – – ü ü ü – – – – – –
3rd – – – ü ü ü ü ü ü ü ü ü
4th – – – – – – ü ü ü ü ü ü
5th – – – – – – ü ü ü ü ü ü
Gear change at 2000 rpm ü ü ü – – – – – – – – –
Gear change at 2500 rpm ü ü ü – – – – – – – – –
Gear change at 3000 rpm ü ü ü – – – – – – – – –
Gear change at 4500 rpm ü ü ü – – – – – – – – –
From 2ndto 3rdat 3000 rpm – – – ü ü ü – – – – – –
From 3rdto 4that 2500 rpm – – – ü ü ü – – – – – –
From 3rdto 4that 3000 rpm – – – – – – ü ü ü – – –
From 4thto 5that 3000 rpm – – – – – – – – – ü ü ü
Specific significance in modes with acceleration was dedicated to the intensity, and degree of acceleration by which a driver’s need with respect to time needed for reaching the de-sired speed is defined. In this respect, three degrees or levels of acceleration were adopted which were expressed through the position of accelerator pedal, and more precisely said the range of throttle position changes in engine intake manifold expressed in percentage, and which can be monitored as a datum (throttle position –Ø[%]):
– “full throttle” – degree of acceleration defined by maximum position of accelerator pedal, and/or degree of throttle opening which changes within the limits of over 70%; this level of acceleration corresponds to the driver’s need for maximum acceleration performances, and/or minimum time required in situations of critical vehicle overtaking,
– “medium throttle” – degree of acceleration defined by mid position of accelerator pedal, and/or throttle position varying within the limits from 30% to 70%; this level of acceleration corresponds to the average driver’s needs during overtaking, or reaching higher speed of motion, and
– “low throttle” – degree of acceleration defined by throttle position varying within the limits up to 30%; this level of acceleration corresponds to the increase of vehicle speed due to change of traffic flow speed, or reaching higher constant permissible speed.
The vehicle in which the investigation was carried out was Toyota Yaris 1.0 produc-tion year 2001 (engine type 1SZ-FE, 998 cm3, 50 kW). It is important to mention that tests in all
modes were carried out under the same weather conditions.
During testing, the time of commence-ment and completion of each of commence-mentioned modes was recorded in order to locate it in time database as soon as possible in later analysis. So formed unique database en-abled the obtaining of new, derived data-bases containing additional data required for investigation such as minimum, maxi-mum, and average parameter values for each mode, speed of parameter change, mode duration, as well as mutual ratios of
individual parameters, and their numeric values as additional indicator. In this way was formed the valueL/Ørepresenting the ratio of engine calculated load valueL(in percentage) and throt-tle openingØ(in percentage) which, during the testing, seemed particularly interesting.
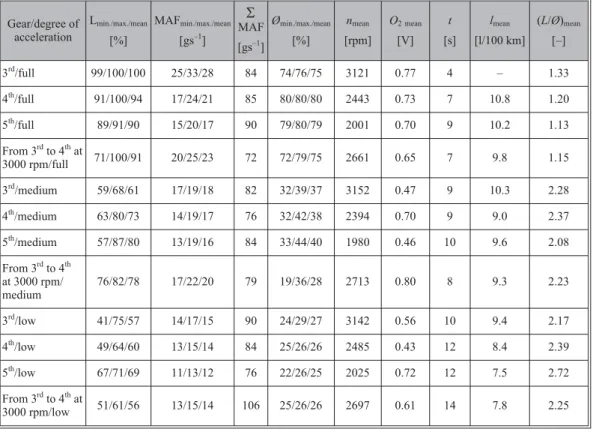
As an example of obtained data processing in the paper is presented the case of accel-eration from 50 to 70 km/h which was considered through twelve modes: four gears (3rdgear, 4th
gear, 5thgear, and shifting from 3rdto 4thgear at 3000 rpm) multiplied by three degrees of
accel-eration (“full throttle”, “medium throttle”, and “low throttle”). Overview of obtained character-istic parameters and their minimum, maximum, and mean values during this acceleration (where applicable) for all modes is given in tab. 3.
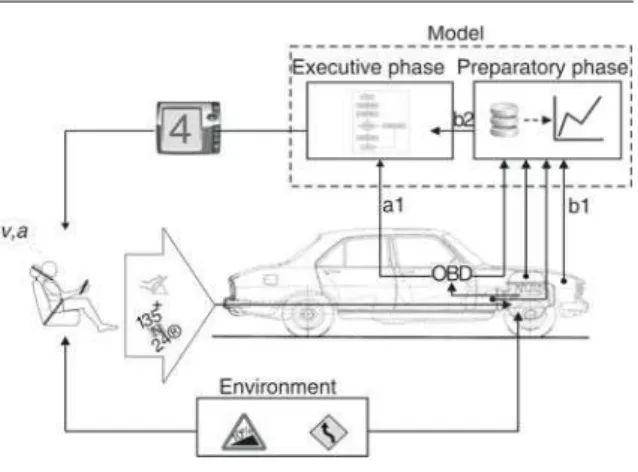
Figure 2. Data flow
Table 3. Overview of obtained characteristic parameters during acceleration from 50 to 70 km/h for all modes
Gear/degree of acceleration
Lmin./max./mean
[%]
MAFmin./max./mean
[gs–1]
S
MAF
[gs–1]
Ømin./max./mean
[%]
nmean
[rpm]
O2 mean
[V]
t
[s]
lmean
[l/100 km]
(L/Ø)mean
[–]
3rd/full 99/100/100 25/33/28 84 74/76/75 3121 0.77 4 – 1.33
4th/full 91/100/94 17/24/21 85 80/80/80 2443 0.73 7 10.8 1.20
5th/full 89/91/90 15/20/17 90 79/80/79 2001 0.70 9 10.2 1.13
From 3rdto 4that
3000 rpm/full 71/100/91 20/25/23 72 72/79/75 2661 0.65 7 9.8 1.15
3rd/medium 59/68/61 17/19/18 82 32/39/37 3152 0.47 9 10.3 2.28
4th/medium 63/80/73 14/19/17 76 32/42/38 2394 0.70 9 9.0 2.37
5th/medium 57/87/80 13/19/16 84 33/44/40 1980 0.46 10 9.6 2.08
From 3rdto 4th at 3000 rpm/ medium
76/82/78 17/22/20 79 19/36/28 2713 0.80 8 9.3 2.23
3rd/low 41/75/57 14/17/15 90 24/29/27 3142 0.56 10 9.4 2.17
4th/low 49/64/60 13/15/14 84 25/26/26 2485 0.43 12 8.4 2.39
5th/low 67/71/69 11/13/12 76 22/26/25 2025 0.72 12 7.5 2.72
From 3rdto 4that
The first group of modes which was analyzed was the one with maximum degree of ac-celeration designated as “full throttle”. Calculated loads in all gears were close to maximum, and exceed 90%, although it should be mentioned that in third gear the entire acceleration pro-cess took place at maximum load of 100%, and maximum torque, which resulted in maximum acceleration performances, and considerably less time consumption in comparison with other modes. The average values of mass air flow decreased with the increase of gear. While the total consumption, and the sum of mass air flows was increasing with the increase of gear, which could be explained by effects of acceleration duration (shorter acceleration time with larger av-erage consumption in final calculation may give less total consumption). Real proof is the mode in third gear which at the largest average mass air flow reaches the most favorable total con-sumption in the shortest time period. Consequently, it can be considered as the best solution for the given conditions, which describes the largest value of parameter (L/Ø)mean= 1.33 relative to other modes. In fifth gear the maximum engine load could not be utilized at “full throttle” and maximum throttle opening, which eliminates it, due to the largest consumption, and due to less torque reserve which can be used for acceleration needs. The mode with gear shifting at engine speed of 3000 rpm is in this respect considerably more favorable, but to realize the given accel-eration it needs 3 seconds more relative to the “fastest” third gear.
Increased values ofO2parameter are noticeable which indicate richer mixture (over 0.7 V) in all “full throttle” modes and they do not disturb brought conclusions. On the contrary, if some modes were characterized with very rich mixture and other not, more essential differ-ences could occur in comparison of mass air flows and fuel consumption.
Modes associated with “half throttle” degree of acceleration were characterized with calculated load values which increase with the increase of gear and the average values vary from 61% for third gear to 80% for fifth gear which is characterized with the largest throttle opening (in average 40%). While the average values of mass air flow increase with gear decrease, mini-mum cumulative flow is achieved in fourth gear. Parameter (L/Ø)meanagain confirmed the most optimal selection of gear, since it reached maximum value (2.37) for the mode in fourth gear rel-ative to modes in other gears at the same acceleration level. Fifth gear also represents a favorable selection, although the measured acceleration duration is by the whole second longer (which is not a critical criterion for the degree of acceleration not being the maximum – “full throttle”).
Modes characterized by small degree of acceleration – “low throttle” are most similar to the modes of constant motion speed, and in this respect optimum selection tends to gears with minimum possible engine speed, which was confirmed by analysis of acceleration modes at “low throttle” of 50 to 70 km/h. In support of this also are shown numeric data: minimum value of both the average and total mass air flow, acceleration time of 12 seconds which is satisfactory relative to other modes, but also the ratio (L/Ø)meanwhich reached the highest value (2.72) in this mode relative to other modes with such degree of acceleration, by which the role of the men-tioned parameter as one of the criteria when selecting the optimum gear was proved.
Acceleration mode with gear shift from third to fourth gear at 3000 rpm which proved as being unfavorable at small acceleration should also be pointed out, as well as the use of third gear. Basic reason lies in the fact that without need for higher torque the areas of higher engine speeds are used in a longer time interval characteristic for this type of acceleration. Therefore, in case of gear shift, due to mode nature, 3000 rpm was reached, and in third gear even the maximum of 3140 rpm.
Optimization model
Model criteria
The concept of gear shifting optimization of motor vehicle transmission means timely continuous determination of gear which satisfies set criteria. Basic criterion for which opted the authors of the paper was the criterion of minimum fuel consumption for current conditions im-posed by driver-vehicle-environment system.
Additional criterion is associated with the maximum acceleration modes, at which minimum acceleration time should be provided, and conditions for this. This criterion was im-posed by needs of drivers that may affect the traffic safety (mostly related to overtaking pro-cess), and as such it becomes primary in specified cases.
Impacts of driver-vehicle-environment system to the model
Relevant factors for gear shifting in different modes imposed by driver-vehicle-envi-ronment system may be quantitatively expressed through the values of one or more characteris-tic parameters or data which at the same time represent input data required for the process of optimization.
It is important to mention the fact that the model has the task to respond to input param-eters and data reported by driver-vehicle-environment system with the recommended gear, and to potentially correct driver’s behavior only in this segment. Although the conclusions on econ-omy of individual modes irrespectively of gear (e.g. motion at lower speed reduces fuel con-sumption or gradual acceleration is more economic than very intensive acceleration), the Model does not provide such type of information. Hence, the model does not comment the imposed conditions, but can mitigate their consequences by its recommendation.
Driver: Conditions imposed by driver can be observed as his/her desires transmitted to the vehicle through appropriate controls. Basic measurable data directly affected by the driver are vehicle speed and degree of acceleration. In addition, current position of clutch and trans-mission control,i.e. gear selection is also a datum determined by the driver.
Vehicle: A vehicle determines a group of data expressed through its technical charac-teristics, primarily engine and transmission. Such data include: number of gears, gear ratios, fi-nal drive ratio, dynamic rolling radius, characteristic parameters that can be read through vehi-cle OBD system, but also engine characteristics (such as principle of operation, manner of engine operation control and providing mixture – carburetor or fuel injection, torque curves and diagrams of specific fuel consumption) which have effect on the manner of changing character-istic parameters and their minimum, maximum and mean values, depending on the mode being implemented. These data can be considered as invariable only in case of the same vehicle brand and type, with the same type of engine and transmission.
Environment: Environment factors having effect on optimization of gear shift are ex-pressed through motion resistance. By their effects, gradient resistance and air resistance which increases with square of velocity are pronounced. In both cases, changes in their values directly reflect on engine load value, but also on the values of other characteristic parameters if some of them are not maintained constant (vehicle speed, engine speed, throttle opening).
Model structure – preparatory and executive phase
pre-paratory phase and executive phase (fig. 3), which was conditioned by the previous division of the data and parameters used by the model at:
(a) a group of parameters which are readout in real time by OBD system, whose values are changing and depend on the driver’s requirements and road resistance. These parameters fall into group of characteristic parameters that were used during the implemented investigation, and they are (a1):
– calculated load valueL, – throttle openingØ, – engine speedn, and – vehicle speedv.
Acquired values of the mentioned parameters, describing current mode of motion, are used directly by the model algorithm in order to recommend the optimum gear.
(b) group of the data and criterion parameters that are determined by the technical characteristics of vehicle, its engine, transmission and OBD system, and which affect, directly or indirectly, the values of criteria which are an integral part of the algorithm structure. The data refer to the values declared by a manufacturer and are considered as constants not derived, and they are (b1):
– gear ratiosii, – final drive ratioio,
– dynamic rolling radiusrd, and
– list of characteristic parameters provided by OBD system of the significance for the model.
Criterion parameters are, on the contrary, the values which are not declared (except nimin.,nMemax.) but are derived on the basis of investigations that should be implemented (see secion Experimental monitoring and investigation of characteristic parameters in different driving model) in order to reach their numeric values used by the model algorithm. Such crite-rion parameters include (b2):
– minimum engine speed for each gearnimin.,
– engine speed at which the maximum torque is reachednMemax.,
– initial throttle position (corresponding to the initial position of accelerator pedal) Ø0, – maximum calculated load value Liconst at maximum value of throttle opening Øiconst
indicating the constant speed driving mode in each gear,
– minimum calculated load valueLamax.at minimum throttle opening valueØamax.indicating the maximum acceleration driving mode,
– limit values of derived valueL/Øfor each gear for acceleration modes which exclude top gear (L/Ø)imin.,
– engine speed-vehicle speed ratio relative to transmission ratioic, and – transmission ratios intervals for determining current gear [iimin.,iimax.].
The model executive phase uses only parameters as the inputs,i.e. two groups; the first comes from vehicle OBD system and represents the group of parameters (a1), while the second group of so called criterion parameters (b2) is obtained di-rectly from preparatory phase (fig. 3). The group of criterion parameters (b2) is required prior to the beginning of down-loading parameters (a1), in order to be integrated into algorithm and its criteria. Integration of parameters (b2) is per-formed by software, whereat the user should enter the required values into ap-propriate fields (see fig. 5).
Down-loading the group of data (a1) from vehicle OBD system is automatically performed in real time, whereat for this is foreseen specific software part whose task is to process the obtained data and adjust them to the algorithm input. The core of executive phase is optimization algorithm which provides the result of the entire model in the form of recommended gear (fig. 3).
Model algorithm
The essence of the model of optimization is the algorithm which as the result should express the recommended gear. Input parameters of vehicle operation in real time, expressed through characteristic parameters, circulate through the algorithm structure comparing them-selves with set criteria which direct them toward recommended gear. The mentioned algorithm criteria will be explained in detail through the description of its structure which follows.
Algorithm structure is shown in fig. 4(a) and fig. 4(b). Its elements are marked by let-ters,i.e. I – input, D – if-then statement, P – assignation or computation procedure, O – output.
Algorithm begins with the I which collects and enters the required parameters. As al-ready explained, there are two groups of input parameters in algorithm, as follows: the group of parameters (a1) which are downloaded from vehicle OBD system and represent the vehicle op-eration parameters in real time (L,Ø,n,v) and the group of criterion parameters (b2) represent-ing the result of the Model preparatory phase and used for the criteria and required computations (Liconst,Øiconst,Lamax.,Øamax., (L/Ø)imin.,ic, [iimin.,iimax.]).
If-then statement P0 determines whether the vehicle is in stationary position (n= 0) or in motion (n¹0). If vehicle is not in motion, the procedure returns to the beginning, because in case of stationary vehicle it is not necessary to determine gear. If the vehicle is in motion, then follows the procedure P0 by which transmission ratio is computed based on engine speed, vehi-cle speed and parameteric, as follows:
i=ic n n
(1)
wheren,n, andicare obtained in preparatory phase by the equation:
i r
i c =
3600 1000 30
p d
o
(2)
whererdis the dynamic rolling radius andiois the final drive ratio.
Upon the computation of gear ratio, follow a series of if-then statements (D1, D2, D3, D4, D5) in which it is determined which gear is engaged. Due to dynamism of the process of read-ing parameters of engine speed and vehicle speed, the obtained gear is not compared with dis-crete values of gear defined by the manufacturer, but some deviations defined by interval [iimin., iimax.] obtained in preparatory phase are permissible. If the obtained transmission ratio belongs to interval for certain gear, in the next procedure (P2 to P5) values used in further process are as-signed,i.e. to parameter current gear (CG), and to parametersLconst,Øconstand,nminthe appropri-ate values of these parameters for this gearLiconst,Øiconstandnimin.. ParametersLconst,Øconstand, nmindetermine one by one the maximum calculated engine load value for the constant speed driv-ing mode, maximum throttle opendriv-ing value for the same mode and minimum recommended en-gine speed at which the enen-gine can provide the torque. If first gear is engaged (P1: CG = 1) then follows if-then statement D6 on exceeding the engine speed in first gear (adopted engine speed at which the maximum torque is reached taking into account that first gear is exclusively intended for start and overcoming large gradients). If the engine speed is exceeded, the second gear is rec-ommended by the output O1.
If it is determined by if-then statements D1 to D5 that no gear is currently engaged, by if-then statement D7 shall be determined whether this is a case of higher motion speed (higher than 40 km/h) or less at the minimum throttle opening (which excludes short-time gear shift). If the speed is less than 40 km/h, no gear is recommended (RG= 0) by the output O2, otherwise, it is the operating mode in which fuel is unnecessarily spent and so follows the recommendation O3 with the highest possible gear computed by the procedure P6.
If some of gears is engaged (2nd, 3rd, 4th, or 5th) then follows if-then statements D8
which checks whether throttle is in idle position and whether accelerator pedal is pressed by comparison of throttle openingØwith the initial positionØ0. For a positive answer follows the output O4 according to which current gear is retained. Otherwise, follows if-then statement D9 by which checks whether the mode of motion is with (approximately) constant speed, by com-parison with the both appropriate limit valuesLconst,Øconstobtained by analysis in preparatory phase. In case that the mode of uniform motion is recognized, first is performed check D10 whether the engine speed is less than the minimum for such gear (n<nimin.). For a positive an-swer follows the output O5 which instructs shifting to lower gear (except for second gear which remains the same), and for a negative answer, through the procedure for computing the highest possible gear P6 such gear is obtained at the output O3.
If it is not the mode of (approximately) uniform motion speed, it is checked whether this is the mode of maximum acceleration D11, by comparing current parameters of calculated load value and throttle opening with limit values for such modeLamax.andØamax.. For second gear the comparison ofØ withØamax. is not foreseen, because by analysis in preparatory phase it was proved that at the maximum acceleration in this gear large values are often not reachable due to short duration of acceleration. For detected maximum acceleration mode follows a recommenda-tion of gear which is by the engine speed most close to the one corresponding to the maximum en-gine torquenMemax.which is computed by procedure P7, and displayed by output O6.
throttle opening value (L/Ø) and satisfying the criterion that this ratio is higher than its minimum value for this gear (L/Ø)imin., which is the condition that gear need not be shifted.
For vehicle speeds less than 50 km/h second or third gear are available for recommen-dation whereat third gear is preferential if it is according to D14 (L/Ø) > (L/Ø)3min., and if the en-gine speed in third gear is greater than the minimum one D15. Otherwise, second gear is recom-mended.
Confirmation of developed model
The developed model was tested in real service conditions, and driving the experimen-tal vehicle Toyota Yaris, since for it was carried out the investigation for different driving modes, representing the mandatory part of preparatory phase of the model.
The course of the model implementation can be presented in the following sequence: – collecting the group (b1) parameters and data,
– application of presented method of theoretical-experimental investigations by which the values of characteristic parameters are collected, their statistical processing and analysis is carried out (see sectionExperimental monitoring and investigation of characteristic parameters in different driving model),
– based on the implemented method, the appropriate conclusions should be drawn with regard to the values of group (b2) parameters and the same should be entered using appropriate software user interface (fig. 5), and – upon entering the group (b2) data and
parameters, the same are automati-cally positioned in the algorithm which can be started by software aid. Previously, computer,i.e. hardware should be connected with the appro-priate vehicle OBD system interface, by which the reading of characteristic parameters in real time of vehicle service is enabled.
Figure 6 represents software output window which, in addition to recom-mended gear in the form of the most no-ticeable number, for the needs of this ex-perimental investigation displayed all relevant parameters in order to perform control of the algorithm operation in real conditions.
The developed model was tested in real exploitation conditions, and driving the experimental vehicle Toyota Yaris. More than noticeable fuel consumption reductions were recorded. For the same road conditions and same sections of
Figure 5. Software user interface
road, measured fuel savings ranged from 5% for the drivers with economical driving style up to 35% for the drivers with aggressive driving style. It must be taking into account their relative significance with respect to the value and composition of statistical sample.
Conclusions
Issues of gear shifting optimization still represent actual challenge to scientific-expert po-tential in the field of motor vehicles. This paper presents implemented idea on how it is possible to perform gear shifting optimization for the purpose of reducing fuel consumption. Originality can be perceived in the approach of solving the issue, whereat the work has not been done to im-prove existing models and the manner how they can be reached, but a new theoretical experi-mental approach to investigation has been developed, with use of OBD technology which so far has not been used for this purpose, and which, for the needs of the developed model, can be used in vehicle daily service without any changes in it. Verification of the model has been realized through its implementation into experimental vehicle with significant fuel savings. Final verifi-cation of results comes with decrease of fuel consumption through objective perceiving of test results in a large and diverse specimen of drivers. Also, driver training schools should not be for-gotten, where the application of the model would also have educational character with the aim of achieving ecological driving, which will eventually lead to more energy efficient road transport. There is a significant space for further investigations in the sphere. This primarily re-fers to the implementation of presented theoretical and experimental investigations and to the potential modification of the model for different categories of motor vehicles, both passenger and freight vehicles and buses. In addition, it is necessary to investigate the behavior of vehicles with fitted diesel engines and to perceive possible differences in the given modes. Also, space for further investigation is left in the domain of transmission with larger number of gears (in pas-senger vehicles there are transmissions with six gears, while in freight vehicles and buses this number is much larger).
Specific group of investigation should be carried out for the verification of the model efficiency in fuel saving and preparation costs. Confirmation of the model with respect to fuel saving requires complex tests which would mean very precise modes of motion implemented by statistically valid number of different drivers by more criteria (professionals-amateurs, young-old, inexperienced-experienced, etc.). Investigations referring to the effects that the model has to exhaust emission also should not be forgotten.
References
[1] Shinar, D.,et al., How Automatic is Manual Gear Shifting?,Human Factors, 40(1999), 4, pp. 647-654 [2] Groeger, J. A., Clegg, B. A., Automaticity and Driving: Time to Change Gear Conceptually, in: Traffic
and Transport Psychology: Theory and Application (Ed. V. E. Carbonell, T. Rothengatter), Pergamon Press, Oxford, UK, 1997
[3] De Vlieger, I.,et al., Environmental Effects of Driving Behaviour and Congestion Related to Passenger Cars,Atmospheric Environment, 34(2000), 27, pp. 4649-4655
Nomenclature
L – calculated load value, [%]
lmean – average fuel consumption, [l·(100 km)–1]
MAF – mass air flow, [gs–1]
n – engine speed, [rpm]
O2 – O2sensor voltage, [V]
Ø – throttle position, [%]
rd – dinamic rolling radius, [m] v – vehicle speed, [kmh–1]
Acronym
[4] Hooker, J. N., Optimal Driving for Single-Vehicle Fuel Economy,Transportation Research Part A, 22 (1988), 3, pp. 183-201
[5] Van Mierlo, J.,et al., Driving Style and Traffic Measures – Influence on Vehicle Emissions and Fuel Con-sumption,Proceedings, IMechE, Part D:Journal of Automobile Engineering, 218(2004), N1, pp. 43-50 [6] ***, National Research Council, Automobile Fuel Economy – How Far Should We Go?, National
Acad-emy Press, Washington D. C., USA, 1992
[7] Schindler, K. P., Fuel Savings by Car. Presented at the Strategies for Promoting Fuel Saving On-Board Technologies – OPET Workshop, Brussels, 2003
[8] Van der Voort, M.,et al., A Prototype Fuel-Efficiency Support Tool,Transportation Research Part D, 9 (2001), 4, pp. 279-296
[9] Decicco, J., Ross, M., Recent Advances in Automotive Technology and the Cost-Effectiveness of Fuel Economy Improvement,Transportation Research Part C, 1(1996), 2, pp. 79-96
[10] Vanke, J., Techniques for Influencing Driving – The Driver’s View, Presented at the ECMT Expert Work-shop on In-Car Technology, Delft, The Netherlands, 1996
[11] ***, Gear Shift Indicator System – Toyota Technical Documentation, Toyota Motor Corporation, Toyota City, 2009
[12] ***, Experts from Germany, Proposal for Draft Amendment to the 05 Series of Amendments to Regula-tion No. 83 (Emissions of M1 and N1 Categories of Vehicles), to: Economic Commission for Europe, In-land Transport Committee, World Forum for Harmonization of Vehicle Regulation (WP.29), Working Party on Pollution and Energy (49thGRPE), 2004
[13] Blagojevi}, I., Vorotovi}, G., The Possibilities for Acquisition and Usage of Data Concerning a Large Number of Vehicles Functioning, in Real Terms of Exploitation Using OBD Technology, Conference on Virtual Product Development in Automotive Engineering, Graz, Austria, 2004, pp. 28-29