American Journal of Applied Sciences 7 (3): 438-441, 2010 ISSN 1546-9239
© 2010Science Publications
Corresponding Author: Tien-Hui Chen, Department of Tourism Management, Far-East University, No.49, Jhonghua Rd., Hsin-Shih, Tainan County 744, Taiwan, ROC
438
Efficiency Decomposition with Enhancing Russell Measure in Data Envelopment Analysis
1
Tien-Hui Chen, 2Chiao-Pin Bao, 3Chi-Ming Huang and 4I-Chiang Wang
1
Department of Tourism Management, Far-East University, No.49, Jhonghua Rd., Hsin-Shih, Tainan County 744, Taiwan, ROC
2
Department of Industrial Engineering and Management, I-Shou University, No.1, Sec. 1, Syuecheng Rd., Dashu Township, Kaohsiung County, Taiwan, ROC
3
Department of Leisure and Sports Management, Far-East University, No.49, Jhonghua Rd., Hsin-Shih, Tainan County 744, Taiwan, ROC
4
Department of Marketing and Logistics Management, Southern Taiwan University, No.1 NanTai St., YongKang City, Tainan County, Taiwan ROC
Abstract: Problem statement: Most studies about the application of Data Envelopment Analysis (DEA) follow the concept of radial and non-radial efficiency measures. Because of some difficulties with the measure of weights, Russell measure utilizes the mean of all input/output efficiency measurements as the efficiency score of a specific business unit. However, this may render bias. Approach: This study provided a reasonable mechanism in the determination of user-specified weights for inputs to enhance the Russell measure which avoids the computational and interpretative difficulties. Results: Additionally, it can assist the decision maker in determining the relative importance of factors to improve the discrimination level of business unit efficiencies. Conclusion: The major advantages of the proposed technique are that it can not only provide a reasonable mechanism in the determination of user specified weights but also enhance the Russell measure. In addition, it can assist the decision maker in determining the relative importance of factors to improve the discrimination level of DMUs efficiencies and ensure the optimal scores of DMUs as the CCR efficiency.
Key words: Data envelopment analysis, dual, efficiency, Russell measure INTRODUCTION
The measurement of technical efficiency, first implemented by Farrell (1957), has motivated many scholars to develop new measures or to extend the existing ones. Charnes et al. (1978) first applied DEA to relative efficiency measurement, which stemmed from the Farrell efficiency concept. DEA is a methodology that uses multiple inputs and outputs to measure relative efficiencies within a group of Decision Making Units (DMUs), such as bank branches, engineering teams, hospitals and schools. The relative efficiency of a Decision Making Units (DMUs) within the DEA framework is defined as the ratio of multiple weighted outputs to multiple weighted inputs. Given the restriction that no DMU can exceed 100% efficiency, the weights are chosen to give as much efficiency as possible to a specific DMU.
If we use s outputs and m inputs to evaluate n DMUs, with yik denoted as the observed level of output i and xrk as that of input r of DMUk, the efficiency
measurement for DMUj is the optimal value of the objective function of the following Linear Programming (LP) model, referred to as the CCR model (Charnes et al., 1978):
s j i ij
i 1 Max h u y
=
=
∑
(1a)m r rj r 1 s.t. v x 1
= =
∑
(1b)s m
i ik r rk i 1 r 1
i r
u y v x 0, k 1, 2, , n
u , v 0, i 1, 2, ,s r 1, 2, , m
= =
− ≤ =
≥ ε > = =
∑
∑
…… …
(1c)
Where:
ui and vr = Decision variables associated with output i and input r, respectively
Am. J. Applied Sci., 7 (3): 438-441, 2010
439 Fig. 1: Efficiency points and the frontier
Constraint (1b) is referred to as the normalizing equation (Dyson et al., 2001). Model (1) is an input-oriented DEA model, since it assumes that inputs are under the control of DMUj, which aims to maximize its outputs and it adopts a radial efficiency measurement. If hj is equal to one, then DMUj is classified as efficient and inefficient otherwise.
The CCR model assumes that the production function exhibits constant returns-to-scale. Banker et al. (1984) added an additional constant variable in order for it to permit variable returns-to-scale and this is known as the BCC model. It should be noted that CCR and BCC models are based on the radial measure. A radial efficiency measurement uses a line in input space from the origin O to the point P being evaluated. If P is not efficient then this line will cross the frontier at P’ and the ratio of OP'/OP gives the efficiency score (Fig. 1). DMUs that lie on the surface determine the envelope and are deemed efficient, whilst those that do not are deemed inefficient. A DEA measurement that is not from the origin O is referred to as non-radial efficiency measure.
MATERIALS AND METHODS
Russell measure: Russell (1985) incorporated radial and non-radial efficiency models in performance evaluation called the Russell measure. Model (2) shows the original formula in input oriented form:
m r r 1
n rj rj k rk
k 1 n
k ik ij k 1
r k
Min θ
s.t.θ x x 0, r 1, 2, , m
y y , i 1, 2, ,s
0 1, 0 , i 1, 2, ,s, r 1, 2, , m, k 1, 2, , n
=
=
=
− λ ≥ =
λ ≥ =
≤ θ ≤ ≤ λ =
= =
∑
∑
∑
…
…
…
… …
(2)
Where:
θr and λk = Dual variables DMUj = Efficient if and only if
m r r 1
1
= θ =
∑
Later, Fare et al. (1985) extended the Russell measure in an additive way, shown as Model (3) and referred to as the “Russell graph measure”, which simultaneously minimizes the input efficiency measure and maximizes the output inefficiency measure as follows:
m s
m s
r i
r 1 i 1 r
i r 1 i 1
n rj rj k rk
k 1 n ij ij k ik
k 1
r r k
θ φ
1 Min R( θ, φ)
m s
s.t.θ x x , r 1, 2, , m
φy y , i 1, 2, ,s,
0 1, 1 φ, 0 ,
i 1, 2, ,s, r 1, 2, , m, k 1, 2, , n
= =
= =
=
=
+ =
+
≥ λ =
≤ λ =
≤ θ ≤ ≤ ≤ λ
= =
=
∑
∑
∑ ∑
∑
∑
…
…
… …
…
(3)
The variables θrj and ϕij represent the measures of input efficiency and output inefficiency of DMUj, respectively (Cooper et al., 2007).
The basic concept of Russell measure is that it assumes the weights (coefficients) are all the same for each input (output), i.e., 1
m+sand therefore it utilizes the mean of all input/output efficiency scores as the efficiency index of DMUj. However, this efficiency
measurement is subjective and may render bias. This study enhances the Russell measure by decomposing the normalizing equation.
A non-radial measurement: If we decompose the normalizing Eq. 1b into m components, i.e.,
1 1j 1 2 2 j 2 m mj m
v x = α, v x = α , ..., v x = α and let
∑
mr 1=α =r 1,then each input will be associated with a different dual variable and Model (1) can be converted into Model (4) as a non-radial DEA model:
s j i ij
i 1 r rj r
s m
i ik r rk i 1 r 1
i r r
Max e u y
s.t. v x , r 1, 2, , m
u y v x 0, k 1, 2, , n
u , v 0 , 0, i 1, 2 ,s,
r 1, 2, , m
=
= =
=
= α =
− ≤ =
≥ α ≥ =
=
∑
∑
∑
…
… … …
Am. J. Applied Sci., 7 (3): 438-441, 2010
440 where,
m r r 1
1
= α =
∑
. The dual problem of Model (4) is shown as Model (5):m j r r
r 1 n r rj k rk
k 1 n
k ik ij k 1
r k
Min f θ
s.t. θx x 0, r 1, 2, , m
y y 0, i 1, 2, ,s
unrestricted, 0, k 1, 2, , n, r 1, 2 , m
=
=
=
= α
− λ ≥ =
λ − ≥ =
θ λ ≥ =
=
∑
∑
∑
…
…
… …
(5)
Zhou et al. (2007) stated that αr, r=1, 2,…, m, are the normalized user-specified weights for adjusting the rth input. Based on this argument, αr'sare decision
variables when incorporated into the non-radial DEA model and their linear combination should be equal to one. However, this may result in infinitely many solutions in solving Models (4) and (5) and thus this study proposed the following procedure to provide a reasonable mechanism in the determination of αr’s:
Step 1: Run the CCR model to obtain the values of r
*
v , r=1, 2,…, m
Step 2: Calculate the value of αr by letting r
* r v xrj
α =
Step 3: Run Model (5)
The major characteristic of the procedure is that it applies the radial model to obtain the best weights of inputs for each DMU and thus the decision maker can utilize these to specify the αr values in the non-radial DEA model. Chen and Ali (2004) argued that the efficiencies between Models (1), (2), (4) and (5) are the same and thus the procedure provides a reasonable mechanism to determine the αr values.
Here αr is the weighted volume of input r and r
* r
α θ
can thereby be interpreted as the contribution to the current efficiency of input r. Therefore, r
*
θ is the efficiency index of input r. In other words, the efficiencies of DMUs enable the decision maker to decompose them, in a way similar to the Russell measure. Based on the proposed procedure, one can
attain the explicit efficiency index and mitigate the shortcoming of Russell measure.
RESULTS AND DISCUSSION
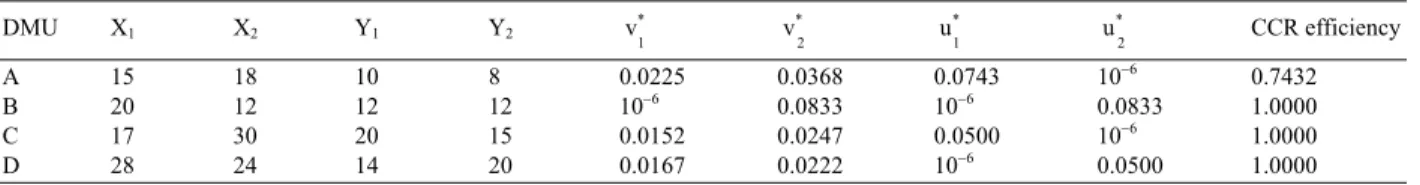
An illustration: The purpose of this illustration is to demonstrate the proposed technique and point out the bias of efficiency evaluation by the Russell measure. Suppose there are four evaluated DMUs with two inputs and two outputs (Table 1).
For DMUA, the efficiency score by using Model (1) is *
A
h =0.7432, where *1
v =0.0255 and *2
v =0.0368.
Hence, *1
1 15v 0.3376
α = = , *2
2 18v 0.6624
α = = ,
1 1.1111
θ = and θ =2 0.5556. By utilizing Russell
measure, the efficiency of DMUA is equal to 0.8334 (Min RA = (1.1111+0.5556)/2 = 0.83335). It is obvious that the Russell measure render bias since the efficiency score of DMUA is different from that by the CCR model. Additionally, based on the proposed technique, we present three findings.
Finding 1: In Russell measure, it assumed that the coefficients of the efficiency indices are the same. However, it is not necessary that all efficiency indices correspond to equivalent weights. By utilizing the proposed technique, decision makers can determine the best weight for each input (output) and therefore identify the outstanding input (output) according to the efficiency indices. As can be seen in the illustration, the efficiency index of input X2 is superior to that of X1 for DMUA,sinceθ =2 0.8421 is larger than θ =1 0.6232.
Finding 2: The characteristic of DEA is that it allows DMUs to select the factor weights which are the most favorable for them in calculating their efficiency scores. This flexibility generally classifies many DMUs as efficient. Based on the marginal efficiency indices of inputs (or outputs), decision makers can determine the relative importance of factors and incorporate the relative importance relationships into the DEA model as constraints to attain a higher discrimination level.
Table 1: Data of the illustration
DMU X1 X2 Y1 Y2 *
1
v *
2
v *
1
u *
2
u CCR efficiency
A 15 18 10 8 0.0225 0.0368 0.0743 10−6 0.7432
B 20 12 12 12 10−6 0.0833 10−6 0.0833 1.0000
C 17 30 20 15 0.0152 0.0247 0.0500 10−6 1.0000
Am. J. Applied Sci., 7 (3): 438-441, 2010
441 Finding 3: To obtain the values of *r
v , r=1, 2,…, m, it is usually found that some *
r
v ’s are equal to zero and thus the marginal efficiencies of these inputs are of zero. To avoid this situation, decision makers can utilize assurance region (Thompson et al., 1990) in the CCR model.
CONCLUSION
This study is concerned with the measurement of efficiency from a DEA perspective. Because of the similarity to the Russell measure, we have called it the enhanced Russell measure. Using Russell measure may render bias when measuring efficiency by means of inputs/outputs efficiencies. To avoid this situation, this study applies the non-radial DEA model to obtain the efficiency indices through identifying the αr values. The major advantages of the proposed technique are that it can not only provide a reasonable mechanism in the determination of αr’s but also enhance the Russell measure. In addition, it can assist the decision maker in determining the relative importance of factors to improve the discrimination level of DMUs efficiencies and ensure the optimal scores of DMUs as the CCR efficiency.
REFERENCES
Banker, R.D., A. Charnes and W.W. Cooper, 1984. Some models for estimating technical and scale inefficiencies in data envelopment analysis. Manage. Sci., 30: 1078-1092.
Chen, Y. and A.I. Ali, 2004. DEA Malmquist productivity measure: New insights with an application to computer industry. Eur. J. Oper. Res., 159:239-249. Cooper, W.W., Z. Huang, S.X. Li, B.R. Parker and J.T.
Pastor, 2007. Efficiency aggregation with enhanced Russell measures in data envelopment analysis. Socio-Econ. Plan. Sci., 41: 1-21.
Charnes, A., W.W. Cooper and E. Rhodes, 1978. Measuring the efficiency of decision making units. Eur. J. Oper. Res., 2: 429-444.
Dyson, R.G., R. Allen, A.S. Camanho, V.V. Podinovski and C.S. Sarrico et al., 2001. Pitfall and protocols in DEA. Eur. J. Oper. Res., 132: 245-259.
Fare, R., S. Grosskopf and C.A.K. Lovell, 1985. The Measurement of Efficiency of Production. Springer, New York, pp: 216.
Farrell, M.J., 1957. The measurement of productive efficiency. J. R. Stat. Soc., Ser. A, A120: 253-281. Russell, R.R., 1985. Measures of technical efficiency. J.
Econ. Theory, 35: 109-126.
Thompson, R.G., L.N. Langemeier, C.T. Lee and R.M. Thrall, 1990. The role of multiplier bounds in efficiency analysis with application to Kansas farming. J. Econ., 46: 93-108.