Subcutaneous Fat Patterns in Athletes and Non-Athletes
Renate Kruschitz1,2,3,7, Sandra J. Wallner-Liebmann2*, Michael J. Hamlin4, Maximilian Moser5, Bernhard Ludvik1, Wolfgang J. Schnedl6, Erwin Tafeit7
1Medical University Vienna, Clinic for Internal Medicine III, Department of Endocrinology and Metabolism, Vienna, Austria, 2Medical University Graz, Inst. of Pathophysiology and Immunology, Graz, Austria,3SIPCAN Special Institute for Preventive Cardiology and Nutrition, Salzburg, Austria,4Lincoln University, Environment Society and Design Faculty, Christchurch, New Zealand,5Medical University Graz, Inst. of Physiology, Graz, Austria,6Practice for General Internal Medicine, Bruck/Mur, Austria,7Medical University Graz, Inst. of Physiological Chemistry, Graz, Austria
Abstract
We aimed to describe the relationship between BMI and the subcutaneous adipose tissue topography within young athletes and non-athletic controls, to comparatively evaluate the diagnostic powers of subcutaneous adipose tissue thicknesses at different body sites, furthermore to explore appropriate cut-offs to discriminate between athletes and controls. Measurements were determined in 64 males and 42 females, who were subsequently separated into two even groups (athletes and non-athletes). The optical device LIPOMETER was applied at standardised body sites to measure the thickness of subcutaneous adipose tissue layers. To calculate the power of the different body sites and the BMI to discriminate between athletes and non-athletes, receiver operating characteristic curve analysis was performed. In men, the neck (optimal cut-off value 2.3 mm) and trunk (optimal cut-off value 15.5 mm) provided the strongest discrimination power: with 90.6% (58 of 64) of the subjects being correctly classified into athletes or non-athletes. Discrimination power of the BMI values was 64.1% (41 of 64 were correctly classified). In women, the upper back (optimal cut-off value 3.3 mm) and arms (optimal cut-off value 15.9 mm) provided the strongest discrimination power with 88.1% (37 of 42 being correctly classified). When using BMI to discriminate between athletes and non-athletes only 52.4% (22 of 42) were correctly classified. These results suggest that compared to BMI levels, subcutaneous fat patterns are a more accurate way of discriminating between athletes and non-athletes. In particular the neck and the trunk compartment in men and the upper back and arms compartment in women, were the best sites to discriminate between young athletes and non-athletes on the basis of their fat patterns.
Citation:Kruschitz R, Wallner-Liebmann SJ, Hamlin MJ, Moser M, Ludvik B, et al. (2013) Detecting Body Fat–A Weighty Problem BMI versus Subcutaneous Fat Patterns in Athletes and Non-Athletes. PLoS ONE 8(8): e72002. doi:10.1371/journal.pone.0072002
Editor:Andrej A. Romanovsky, St. Joseph’s Hospital and Medical Center, United States of America ReceivedMay 4, 2013;AcceptedJuly 10, 2013;PublishedAugust 26, 2013
Copyright:ß2013 Kruschitz et al. This is an open-access article distributed under the terms of the Creative Commons Attribution License, which permits unrestricted use, distribution, and reproduction in any medium, provided the original author and source are credited.
Funding:The Lipometer is used exclusively for research without commercial interest. Therefore there are no conflicts of interest and funding to declare. These authors have no support or funding to report.
Competing Interests:The authors have declared that no competing interests exist. * E-mail: Sandra.wallner@medunigraz.at
Introduction
Since James S. Garrow proposed the body mass index (BMI, kg/m2) as a measure of fatness in 1985 [1], its use in science and within clinical practice has risen exponentially over the years. Especially in sports science the BMI and assessment of body fat to determine optimal body weight has increased [2]. Body weight and body composition are important performance factors in many sports [3]. A centralized subcutaneous fat distribution has been associated with decreased aerobic capacity in men [4]. In both athletic and non-athletic populations the estimates of body composition characteristics are used to identify health status [5]. Nevertheless the use of body weight by itself and/or BMI has been criticized, particularly in athletic populations [6–8]. The BMI indicates a somewhat stronger yet still moderate association with body fat and disease risk compared to estimates based on stature and body mass [9,10]. Although BMI is correlated (r = 0.60–0.82) with percentage total body fat (TBF%) [11], there is a lack of research regarding the usefulness of BMI as a surrogate for TBF%, especially in young adults and athletes. The BMI does not discriminate between the different components of the body and
cannot describe the fat distribution over the body. Individuals with high fat-free mass (FFM) relative to height, like athletes and younger adults, might have a high BMI but they are not necessarily obese [2,6,8].
In general, there is little consensus on the use of body fat percentage criteria to define obesity or excess body fat levels [12]. The American College of Sports Medicine (ACSM) [13] recommended on the basis of data reported by Gallagher and colleagues [14] a TBF% over 33% in women and 20% in men as acceptable cut-points for overfatness, corresponding to a BMI of 25 kg/m2, in athletes. Recently published TBF% cut-offs from Heo et al. [15] which are comparable with those of Gallagher et al. [14] tend to be higher, especially in younger groups regardless of age, sex and ethnicity. Heo et al. [15] assume that 35–37% TBF% in women and 23–25% TBF% in men corresponds to a BMI of 25 kg/m2in young African Americans and white adults (aged 18–29).
important in assessing the health risks of excessive fat stores is the distribution of fat over the body [17]. Therefore, the use of TBF% and subcutaneous fat patterns may be more effective than BMI in assessing fatness and obesity in physically active individuals and young adults.
The computerized optical device named the Lipometer (Moeller Messtechnik, Graz, EU patent number 0516251) allows a non-invasive, quick, precise and safe determination of the thickness of subcutaneous adipose tissue (SAT) layers at any chosen site of the human body.
As far as we know there has been no study that has assessed the relationship between BMI and SAT-Top in young athletes and non-athletes. Therefore the purpose of this study was to prove our hypothesis that compared to BMI levels the subcutaneous fat patterns are a better screening tool to characterize fatness in athletes compared to non-athletes. A secondary aim of this study
was to provide appropriate subcutaneous adipose tissue measuring points and cut-offs that allow in a quick and precise way to discriminate between athletes and non-athletic controls.
Subjects and Methods
Subjects
In this cross-sectional study the age, height, weight, BMI and SAT-Top were determined in 64 men (32 athletes and 32 non-active controls matched in age, height, weight and BMI) and 42 women (21 athletes and 21 non-active controls with comparable age and height). The female athletes had a significantly higher weight and BMI compared to the control females. Subjects wore light clothing (e.g. shorts and a light top) and no shoes during the measurements. Standing height was measured to the nearest 0.1 cm using a portable calibrated stadiometer (SECAH-220, Hamburg, Germany). Body mass was measured to the nearest Table 1.Descriptive statistics of the two male groups.
Personal parameters Male non-athletes (n = 32) Male athletes (n = 32) Significance of differences1
Age (y) 25.865.6 (22.1–27.7) 23.0613.2 (17.8–31.0) n.s.2
Height (m) 1.8060.1 (1.75–1.82) 1.860.1 (1.75–1.84) n.s.3
Weight (kg) 72.368.7 (66.3–75.0) 72.068.5 (66.3–74.8) n.s.3
BMI (kg/m2) 22.4
61.4 (21.6–23.0) 21.862.3 (20.7–23.0) n.s.3 SAT-Top4
Neck 3.763.7 (2.5–6.2) 1.260.6 (1.0–1.6) p,0.001
Triceps 4.963.0 (3.5–6.5) 2.161.9 (1.5–3.4) p,0.001
Biceps 3.061.6 (2.1–3.7) 1.560.6 (1.2–1.8) p,0.001
Upper back 3.662.3 (2.5–4.8) 1.561.0 (1.1–2.1) p,0.001
Front chest 3.862.9 (2.8–5.7) 1.861.2 (1.3–2.5) p,0.001
Lateral chest 4.263.2 (2.7–5.9) 1.760.9 (1.1–2.0) p,0.001
Upper abdomen 5.464.5 (3.5–8.0) 2.161.4 (1.6–3.0) p,0.001
Lower abdomen 5.665.5 (3.6–9.1) 2.562.6 (1.4–4.0) p,0.001
Lower back 6.464.9 (3.8–8.7) 4.763.6 (3.0–6.6) p,0.013
Hip 6.364.3 (4.5–8.8) 2.563.7 (1.7–5.4) p,0.001
Front thigh 3.262.3 (2.5–4.8) 1.961.0 (1.4–2.4) p,0.001
Lateral thigh 4.062.4 (3.1–5.5) 1.761.2 (1.3–2.5) p,0.001
Rear thigh 3.562.4 (2.4–4.8) 1.761.6 (1.4–3.0) p,0.001
Inner thigh 4.964.0 (3.8–7.8) 2.861.3 (2.1–3.4) p,0.001
Calf 3.061.7 (2.2–3.9) 1.660.9 (1.3–2.2) p,0.001
Compartments (mm)
Arms5 7.5
64.0 (5.6–9.6) 3.762.0 (3.2–5.2) p,0.001
Legs6 19.3
68.0 (15.8–23.8) 10.163.9 (8.5–12.4) p,0.001
Abdomen7 24.9
618.8 (17.1–35.9) 12.168.7 (8.5–17.2) p,0.001
Trunk8 14.6610.9 (11.5–22.4) 6.562.2 (5.6–7.8) p,0.001
Total SAT9 68.3
636.6 (52.9–89.5) 33.8613.4 (26.5–39.9) p,0.001
TBF% 15.464.7 (12.8–17.5) 10.262.9 (8.5–11.4) p,0.001
Data is Median6interquartile range (1stto the 3rdquartile). 1By Mann-Whitney U test.
2Not significant (p
.0.05). 3By t-test for independent samples. 4SAT thickness of 15 body sites in mm. 5Body sites biceps
+triceps.
6Body sites front thigh
+lateral thigh+rear thigh+inner thigh+calf.
7Body sites upper abdomen
+lower abdomen+lower back+hip. 8Body sites neck
+upper back+lateral chest+front chest. 9Body sites 1–15.
0.01 kg using calibrated electronic scales (SoehnleH 7700, Mur-rhardt, Germany) and BMI was calculated as body mass (kg) divided by height (m) squared. To record the extent of training and competition load in individuals, structured questionnaires were used from which training volume in kilometres and hours per week was calculated. Descriptive characteristics of the groups are presented in Table 1 and 2.
The participants provided their written informed consent to the study after receiving a thorough explanation of the study and its requirements. For participants under the age of 18, two informed consents were provided, one for their caretaker and one for themselves, as required by the local ethics committee. The procedures used in this study were in accordance with the Declaration of Helsinki and were approved by the ethics committee of the medical university of Graz (IRB00002556) (EC-number 19-054 ex 07/08).
Athletes
Twenty-three swimmers (8 females, 15 males) and 30 triathletes (13 females, 17 males) were recruited from triathlon and swimming clubs in Graz (Austria) and Christchurch (New Zealand). They were between the ages of 15 and 30 years with at least 3 years training experience. The training and competition frequency was at least 2 hr/day, 6 days/week. In a pre-test we investigated differences in body composition between swimmers and triathletes. We found no significant differences between the two groups, with the exception of the rear thigh measurement in women. Therefore we merged swimmers and triathletes to one group of athletes.
Non-athletes
Non-athletes were recruited via an advertisement. The subjects of the athletic group were aged between 15 and 30 years,
non-Table 2.Descriptive statistics of the two female groups.
Personal parameters Female non-athletes (n = 21) Female athletes (n = 21) Significance of differences1
Age (y) 24.862.6 (23.6–26.2) 21.7616.1 (17.1–33.2) n.s.2
Height (m) 1.6660.1 (1.62–1.71) 1.760.1 (1.64–1.73) n.s.3
Weight (kg) 54.066.8 (52.0–58.8) 60.068.0 (55.0–63.0) p,0.05
BMI (kg/m2) 19.9
61.0 (19.7–20.7) 20.862.1 (20.0–22.1) p,0.05 SAT-Top4
Neck 5.863.6 (4.0–7.6) 2.462.1 (1.5–3.6) p,0.001
Triceps 12.564.4 (9.9–14.3) 7.962.0 (7.0–9.0) p,0.001
Biceps 5.363.6 (4.0–7.6) 3.262.0 (2.2–4.2) p,0.0013
Upper back 4.962.6 (3.7–6.3) 2.361.4 (1.7–3.1) p,0.001
Front chest 8.665.9 (4.4–10.3) 2.762.6 (1.8–4.4) p,0.001
Lateral chest 6.365.4 (4.6–10.0) 2.263.3 (1.4–4.7) p,0.001
Upper abdomen 7.465.2 (5.5–10.7) 3.865.1 (2.6–7.7) p,0.01
Lower abdomen 10.266.9 (6.0–12.9) 6.364.7 (4.2–8.9) n.s.3
Lower back 11.465.2 (8.6–13.8) 9.163.8 (7.2–11.0) p,0.053
Hip 8.566.6 (5.4–12.0) 7.167.7 (3.4–11.1) n.s.3
Front thigh 10.363.5 (8.0–11.5) 6.963.6 (4.6–8.2) p,0.001
Lateral thigh 10.462.8 (9.9–12.7) 8.063.4 (6.5–9.9) p,0.013
Rear thigh 7.261.9 (6.1–8.0) 5.862.7 (5.0–7.7) n.s.3
Inner thigh 11.262.8 (9.8–12.6) 7.465.0 (5.4–10.4) p,0.0013
Calf 6.362.3 (4.8–7.1) 3.562.8 (2.5–5.3) p,0.0013
Compartments (mm)
Arms5 17.4
65.2 (15.7–20.9) 11.162.3 (10.1–12.4) p,0.0013
Legs6 46.6
69.1 (40.2–49.3) 30.9616.1 (24.2–40.3) p,0.0013
Abdomen7 40.5
621.4 (25.7–47.1) 26.5623.2 (16.4–39.6) p,0.053
Trunk8 25.6
617.1 (17.1–34.2) 10.266.4 (7.8–14.2) p,0.001
Total SAT9 133.7
648.6 (102.1–150.7) 78.8642.1 (62.8–104.9) p,0.0013
TBF% 30.265.5 (27.2–32.7) 26.964.7 (24.8–29.5) p,0.013
Data is Median6interquartile range (1stto the 3rdquartile). 1By Mann-Whitney U test.
2Not significant (p
.0.05). 3By t-test for independent samples. 4SAT thickness of 15 body sites in mm. 5Body sites biceps
+triceps. 6Body sites front thigh
+lateral thigh+rear thigh+inner thigh+calf. 7Body sites upper abdomen
+lower abdomen+lower back+hip.
8Body sites neck
+upper back+lateral chest+front chest. 9Body sites 1–15.
smokers, were currently taking no medication and performing no more than one hour of exercise per week.
Measurement of SAT-Top
The optical Lipometer device was applied to measure the thickness of SAT in millimetres at 15 well-defined body sites distributed from neck to calf (see Figure S1). Measurements were Figure 1. Receiver-operator characteristics (ROC) curve for BMI, neck measurement site and trunk compartment of men.The curve describes the association between sensitivity and specificity at different thresholds. ROC curves that approach the upper leftmost corner represent highly accurate classifiers.
doi:10.1371/journal.pone.0072002.g001
Figure 2. Receiver-operator characteristics (ROC) curve for BMI, upper back measurement site and arms compartment of women.
The curve describes the association between sensitivity and specificity at different thresholds. ROC curves that approach the upper leftmost corner represent highly accurate classifiers.
performed on the right side of the body while subjects were in an upright standing position by a qualified technician. This set of measurement points defines the SAT-Top of each subject. The complete SAT-Top measurement cycle for one subject lasts about two minutes. The sensor head of the optical Lipometer device consists of a set of light emitting diodes as light sources and a photodetector. During measurement, the sensor head is held perpendicular to the selected body site. The diodes illuminate the SAT-layer and the photodetector measures the corresponding light intensities back-scattered. The resulting light pattern values of a measured body site were calculated to absolute SAT layer thickness (in mm) using computer tomography (CT) as the reference method. The level of agreement between CT and the Lipometer has been found to be very high (correlation coefficient of r = 0.99, with a regression line y = 0.97x+0.37, and no
systematic deviation of the Lipometer measurements from the CT results [Bias = 0.0]) [18,19]. In adults the reliability of the SAT-Top method produced coefficients of variation ranging from 1.9% (front chest) to 12.2% (rear thigh) [20].
Statistics
Statistical calculations were performed by SPSS for Windows (version 16.0). Due to the distribution of the data the median, 1stQuartile (Q1), 3rdQuartile (Q3) and interquartile range (IQR = Q3–Q1) were used for the descriptive analysis of the various variables. The normal distribution of the variables was tested using the Shapiro-Wilk test and the Kolmogorov-Smirnov test. Differences in the distributions of variables between athletes and non-athlete controls was tested by a Student’s t-test for 2 independent samples (in case of normally distributed variables) Table 3.Area indices and optimal cut-off values obtained from ROC curve analysis for height, weight, BMI, 15 specified SAT-layers, 4 Compartments, Total SAT, and TBF% of 32 male athletes and 32 male non-athletes.
Personal
parameters Area index1 P Optimal cutoff2 Sensitivity Specificity
Correctly classified cases
H0: small H0: large [mm] [%] [%]
Height (m) 0.552 n.s.3
Weight (kg) 0.527 – n.s.
BMI (kg/m2) 0.623 – n.s. 21.9 56.3 71.9 64.1% (41 of 64)
TBF% 0.903 – ,0.001 11.5 78.1 93.8 85.9% (55 of 64)
Total SAT9 0.914 –
,0.001 51.7 93.8 78.1 85.9% (55 of 64)
SAT-Top4
Neck 0.952 – ,0.001 2.3 96.9 84.4 90.6% (58 of 64)
Triceps 0.853 – ,0.001 3.3 75.0 87.5 81.3% (52 of 64)
Biceps 0.901 – ,0.001 2.1 87.5 81.3 84.4% (54 of 64)
Upper back 0.929 – ,0.001 3.0 100.0 65.6 82.8% (53 of 64)
Front chest 0.889 – ,0.001 2.4 75.0 90.6 82.8% (53 of 64)
Lateral chest 0.914 – ,0.001 2.7 90.6 81.3 85.9% (55 of 64)
Upper abdomen 0.882 – ,0.001 4.2 96.9 68.8 82.8% (53 of 64)
Lower abdomen 0.844 – ,0.001 5.2 93.8 59.4 76.6% (49 of 64)
Lower back 0.698 – ,0.01 7.5 87.5 46.9 67.2% (43 of 64)
Hip 0.809 – ,0.001 4.2 68.8 81.3 75.0% (48 of 64)
Front thigh 0.831 – ,0.001 2.5 78.1 84.4 81.3% (52 of 64)
Lateral thigh 0.925 – ,0.001 2.8 87.5 87.5 87.5% (56 of 64)
Rear thigh 0.815 – ,0.001 2.1 56.3 93.8 75.0% (48 of 64)
Inner thigh 0.865 – ,0.001 3.7 81.3 81.3 81.3% (52 of 64)
Calf 0.821 – ,0.001 2.2 71.9 78.1 75.0% (48 of 64)
Compartments
Arms5 0.907 –
,0.001 5.4 87.5 81.3 84.4% (54 of 64)
Trunk6 0.960 –
,0.001 15.5 84.4 96.9 90.6% (58 of 64)
Abdomen7 0.836 – ,0.001 19.8 84.4 75.0 79.7% (51 of 64)
Legs8 0.910 –
,0.001 8.2 93.8 78.1 85.9% (55 of 64)
1There are two possible hypotheses (H
0): that either small/large values provide stronger evidence for positivity. 2Optimal cut-off value estimated by Youden-Index (Youden, 1950).
3Not significant (p
.0.05).
4SAT thickness of 15 body sites in mm. 5Body sites biceps
+triceps. 6Body sites front thigh
+lateral thigh+rear thigh+inner thigh+calf. 7Body sites upper abdomen
+lower abdomen+lower back+hip. 8Body sites neck
+upper back+lateral chest+front chest.
9Body sites 1–15.
and by a Mann-Whitney U-test for 2 independent samples (if variables were not normally distributed).
The 15 individual SAT-Top body sites listed in Table 1 and 2 have been described previously [21] (see Figure S1) and can be summed to estimate regional fat mass (e.g. arms [biceps+triceps], trunk [neck+upper back+lateral chest+front chest], abdomen [upper abdomen+lower abdomen+lower back+hip] and legs [front thigh+lateral thigh+rear thigh+inner thigh+calf]).
To give information about the total amount of subcutaneous fat in these two groups, all 15 SAT layer thicknesses were summed (Total SAT). Furthermore, TBF% was calculated by equations developed in a former study [22], using dual-energy x-ray absorptiometry (DXA) as reference method. To estimate Lip-ometer TBF% stepwise multiple regression analysis was applied, using the calculated DXA TBF% as dependent variable. Using the
15 Lipometer SAT thicknesses together with age, height, weight and BMI as independent variables provided the best estimations of Lipometer TBF% for both genders with strong correlations to DXA TBF% (R = 0.99 for males and R = 0.95 for females). The limits of agreement were 22.48% to +2.48% for males and 24.28% to+4.28% for females. For both genders a bias of 0.00% was determined [22].
The selectivity of measurement points was detected by receiver operating characteristic (ROC) curve analysis, which is a useful method for organizing classifiers and visualizing their performance [23,24]. Two different a priori hypotheses were specified: that either smaller or larger parameter values are associated with stronger evidence of positivity ( = group of athletes). The area under the ROC curve is calculated and the result is expressed as an Area Index (AI). The higher sensitivity ( = the test’s ability to identify positive results) Table 4.Area indices and optimal cut-off values obtained from ROC curve analysis for height, weight, BMI, 15 specified SAT-layers, 4 Compartments, Total SAT and TBF% of 21 female athletes and 21 female non-athletes.
Personal
parameters Area index1 P Optimal cutoff2 Sensitivity Specificity
Correctly classified cases
H0: small H0: large [mm] [%] [%]
Height (m) 0.595 n.s.3
Weight (kg) 0.728 ,0.05 66.0 95.2 9.5 52.4% (22 of 42)
BMI (kg/m2) 0.717
,0.05 18.8 4.8 100.0 52.4% (22 of 42)
TBF% 0.757 – ,0.01 30.5 100.0 47.6 73.8% (31 of 42)
Total SAT9 0.866 –
,0.001 83.6 61.9 100.0 81.0% (34 of 42)
SAT-Top4
Neck 0.901 – ,0.001 4.8 90.5 71.4 81.0% (34 of 42)
Triceps 0.908 – ,0.001 10.4 95.2 76.2 85.7% (36 of 42)
Biceps 0.853 – ,0.001 3.8 71.4 85.7 78.6% (33 of 42)
Upper back 0.888 – ,0.001 3.3 81.0 95.2 88.1% (37 of 42)
Front chest 0.881 – ,0.001 4.1 76.2 85.7 81.0% (34 of 42)
Lateral chest 0.866 – ,0.001 3.3 71.4 95.2 83.3% (35 of 42)
Upper abdomen 0.746 – ,0.01 4.7 57.1 85.7 71.4% (30 of 42)
Lower abdomen 0.663 – n.s.
Lower back 0.689 – ,0.05 11.6 85.7 47.6 66.7% (28 of 42)
Hip 0.616 – n.s.
Front thigh 0.859 – ,0.001 9.5 90.5 66.7 78.6% (33 of 42)
Lateral thigh 0.824 – ,0.001 9.1 71.4 95.2 83.3% (35 of 42)
Rear thigh 0.641 – n.s.
Inner thigh 0.842 – ,0.001 9.6 71.4 85.7 78.6% (33 of 42)
Calf 0.825 – ,0.001 5.6 85.7 66.7 76.2% (32 of 42)
Compartments
Arms5 0.923 –
,0.001 15.9 100.0 76.2 88.1% (37 of 42)
Trunk6 0.909 –
,0.001 13.9 76.2 95.2 85.7% (36 of 42)
Abdomen7 0.707 – ,0.05 34.9 71.4 66.7 69.0% (29 of 42)
Legs8 0.854 –
,0.001 44.5 90.5 66.7 78.6% (33 of 42)
1There are two possible hypotheses (H
0): that either small/large values provide stronger evidence for positivity. 2Optimal cut-off value estimated by Youden-Index (Youden. 1950).
3Not significant (p
.0.05).
4SAT thickness of 15 body sites in mm. 5Body sites biceps
+triceps. 6Body sites front thigh
+lateral thigh+rear thigh+inner thigh+calf. 7Body sites upper abdomen
+lower abdomen+lower back+hip. 8Body sites neck
+upper back+lateral chest+front chest.
9Body sites 1–15.
and specificity ( = the test’s ability to identify negative results), the more the ROC-Curve shifts into the upper left corner of the graph (high discriminating power) (see Figure 1) and the AI moves towards 1.0, consequently the selectivity between the groups is strong.
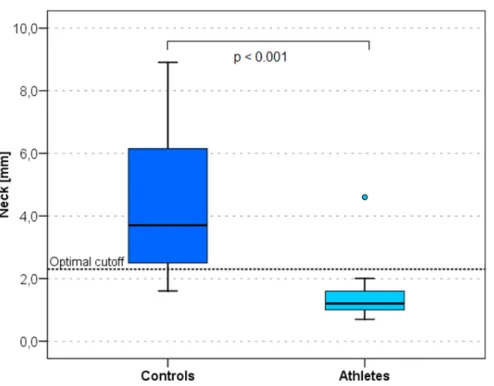
Generally the AI can reach from 0.0 to 1.0 ( = strongest selectivity). If the curve is near the diagonal ( = AI 0.5) the selectivity is weak. An AI ,0.5 shows that the a priori hypothesis should be changed (see BMI in Figure 2). In the ROC curve, the x coordinate represents the Figure 3. Box plots of the neck measurement site in athletes and controls.The neck is the body site with the highest discriminating power in men. The black horizontal lines represent the median, the box represents the 1stand 3rdquartile, the whiskers the 5thand 95thpercentiles. Outliers
are represented by dots. Optimal cutoff is marked by a dotted horizontal line. doi:10.1371/journal.pone.0072002.g003
Figure 4. Box plots of the upper back measurement site in athletes and controls.This is the body site with the highest discriminating power in women. The black horizontal lines represent the median, the box represents the 1stand 3rdquartile, the whiskers the 5thand 95th
sensitivity and the y coordinate shows the specificity. The highest sensitivity and specificity were obtained at the optimal cut-off point estimated by the Youden index [25]. This optimal cut-off value provides the best discriminating power between the group of athletes and their controls, whereby smaller values are associated more strongly with the group of athletes.
Results
Male athletes and non-athletes were similar in terms of age, height, weight and BMI, however, male athletes showed a 50.5% lower Total SAT thickness (33.8613.4 mm) compared to male non-athletes (68.3636.6 mm, p,0.001). All SAT layer thicknesses at the 15 body sites from neck to calf were significantly lower in the male athletes compared to the male non-athletes (Table 1). This was also the case for the additional variables (the four compart-ment measurecompart-ments and TBF %).
Even though the female athletes had significantly higher BMI (p = 0.016) and weight (p = 0.011), their Total SAT thickness was 41.1% lower (78.8642.1 mm) compared to their non-athlete counterparts (133.7648.7 mm, p,0.001). SAT at all measured body sites, for all body compartments and TBF% was significant lower in the female athletes compared to the non-athletes except for the lower abdomen, hip and rear thigh ( = gynoid fat pattern) (Table 2).
ROC curves and the corresponding area indices were calculated for height, weight, BMI, TBF%, Total SAT, SAT-layer thick-nesses at all 15 body sites and for the 4 compartments. The optimal cut-off values were analysed for body sites with a p-value of#0.05 and BMI. Results are presented in Table 3 and 4, and show the area indices for these variables one of the two assumptions that either small or large values provide stronger evidence for positivity ( = athletes).
The best discriminators between male and female athletes and non-athletes are presented as ROC curves in Figure 1 and 2 respectively. In men the neck (Figure 3) measurement (AI = 0.952, sensitivity = 96.9%, specificity = 84.4%, optimal cut-off value 2.3 mm) and the trunk compartment (AI = 0.960, sensitivi-ty = 84.4%, specificisensitivi-ty = 96.9, optimal cut-off value 15.5 mm) provided the strongest discrimination power (90.6% [ = 58 of 64 of the subjects were correctly classified as athletes or controls]). The data showed no significant difference between the BMI of athletes and non-athletes (AI = 0.623, discrimination power: 64.1% [41 of 64 correctly classified subjects]) (Table 3). In women the upper back (Figure 4) measurement (AI = 0.888, sensitivi-ty = 81.0%, specificisensitivi-ty = 95.2%, optimal cut-off value 3.3 mm) and the arms compartment (AI = 0.923, sensitivity = 100.0%, specific-ity = 76.2%, optimal cut-off value 15.9 mm) provided the strongest discrimination power (88.1% [ = 37 of 42 correctly classified subjects]). Female athletes had significantly higher BMI, never-theless the BMI AI was low (AI = 0.717, discrimination power: 52.4% [ = 22 of 42 correctly classified subjects]) (Table 4).
Discussion
Our data shows that athletes and non-athletes of both sexes can be distinguished very clearly by their subcutaneous fat patterns. In spite of comparable BMI in the males, and even significantly higher BMI in the female athlete group, the measured SAT-Top values were significantly lower in the athletes compared to non-athletes in both groups. Male and female athletes showed approximately 50–60% lower Total SAT thickness compared to non-athletes. The ability of BMI to accurately reflect the amount of body fat across athletic and non-athletic populations has been assessed previously [6,26]. Nevill et al. [6] report a 5–32% lower total skinfold thickness (measured by
callipers) in male and 5–29% lower skinfold thickness in female athletes compared to their non-athletic controls. Furthermore, when Witt and Bush [26] examined the relationship between BMI and body fat in college athletes, the authors found that only 20% of women and 4% of men with BMI$25 kg/m2were above the 85th percentile for skinfold measurements. Ode and colleagues [7] analysed the sensitivity, specificity, and predictive values for BMI as a measure of body fatness (measured via air displacement plethysmography) and found low sensitivity between BMI and body fat percentage for athletic populations.
Other investigators have examined the diagnostic ability of BMI in relation to TBF% in adults [11,24,27–32]. Our data as well as results of previous researchers show that BMI is a relatively poor indicator for the amount of body fat in young athletes and non-athletes. However, because of the lack of an established TBF% criterion for health status and the differences in study design, it is difficult to compare the results of our study with this previous research. Many of these studies used different methods for measuring TBF%, including DXA [27,28,30] skinfolds [29] and hydrodensitometry [11,31,32]. The different TBF% cut points used to identify over fatness included 25% [11,28], 30% [29,31], 33% [32], 35% [30] and 38% [27] for females, and either 20% [11,28] or 25% [29,30,32] for males. With the exception of one study that assessed postmenopausal women [27], each study assessed both males and females. The majority of studies included young, middle-aged and older adults [11,28–31], whereas an additional study focused primarily on young and middle-aged adults [32]. Within the postmenopausal women, BMI seemed to be a good diagnostic test for overfatness [27], however, the remaining research consistently indicated BMI had low sensitivity (0.06–0.60) and high specificity (0.86–1.0) as a measure of TBF% in both males and females [11,28–32].
expensive (nuclear magnetic resonance, CT, air displacement plethysmography) [36]. The Lipometer offers a new practical approach for body fat measurement.
Perspectives
We have found that the subcutaneous fat patterns are a useful screening tool for (risk-) phenotypes in adults [19,35,37–40] and in children [41]. Whether the subcutaneous fat patterns are also useful for assessing risky phenotypes in adolescent and physically active young people is a subject of further investigation. However, to date, there is no adequate measurement system for a rapid, inexpensive, precise, portable, and safe determination of SAT distribution. SAT-Top as measured by the Lipometer meets these criteria. Based on the good discrimination results obtained from
the present dataset, Lipometer SAT-Top measurements are likely to contribute to this interesting field in further studies.
Supporting Information
Figure S1 Specified body sites employed for LIP-OMETER measurements of SAT thickness[21].
(TIF)
Author Contributions
Conceived and designed the experiments: RK SWL WS ET. Performed the experiments: RK MH MM WS. Analyzed the data: RK BL ET. Contributed reagents/materials/analysis tools: SWL MM ET. Wrote the paper: RK SWL BL ET.
References
1. Garrow JS, Webster JD (1985) Quetelet’s index (W/H2) as a measure of fatness. Int J Obes 9: 147–153.
2. Torstveit M, Sundgot-Borgen J (2012) Are Under- and Overweight Female Elite Athletes Thin or Fat? A Controled Study. Med Sci Sports Exerc 44: 949–957. 3. Rodriguez NR, DiMarco NM, Langley S (2009) Nutrition and athletic
performance. J Am Diet Assoc 109: 509–527.
4. Mueller WH, Deutsch MI, Malina M, Bailey DA, Mirwald RL (1986) Subcutaneous fat topography: age changes and relationship to cardiovascular fitness in Canadians. Hum Biol 58: 955–973.
5. Moon JR, Eckerson JM, Tobkin SE, Smith AE, Lockwood CM, et al. (2009) Estimating body fat in NCAA Division I female athletes: a five-compartment model validation of laboratory methods. Eur J Appl Physiol 105: 119–130. 6. Nevill AM, Stewart AD, Olds T, Holder R (2006) Relationship between
adiposity and body size reveals limitations of BMI. Am J Phys Anthropol 129: 151–156.
7. Ode JJ, Pivarnik JM, Reeves MJ, Knous JL (2007) Body mass index as a predictor of percent fat in college athletes and nonathletes. Med Sci Sports Exerc 39: 403–409.
8. Prentice AM, Jebb SA (2001) Beyond body mass index. Obesity reviews 2: 141– 147.
9. Calle EE, Thun MJ, Petrelli JM, Rodriguez C, Heath CW (1999) Body-mass index and mortality in a prospective cohort of U.S. adults. N Engl J Med 341: 1097–1105.
10. James PT, Rigby N, Leach R (2004) The obesity epidemic, metabolic syndrome and future prevention strategies. Eur J Cardiovasc Prev Rehabil 11: 3–8. 11. Smalley KJ, Knerr AN, Kendrick ZV, Colliver JA, Owen OE (1990)
Reassessment of body mass indices. Am J Clin Nutr 52: 405–408.
12. Ho-Pham LT, Campbell LV, Nguyen TV (2011) More on body fat cut-off points. Mayo Clin Proc 86: 584.
13. ACSM (2006) ACSM’s Guidelines for Exercise Testing and Prescription; ACSM, editor. Baltimore: Wiliams&Wiliams. 57–66.
14. Gallagher D, Heymsfield SB, Heo M, Jebb SA, Murgatroyd PR, et al. (2000) Healthy percentage body fat ranges: an approach for developing guidelines based on body mass index. Am J Clin Nutr 72: 694–701.
15. Heo M, Faith MS, Pietrobelli A, Heymsfield SB (2012) Percentage of body fat cuttoffs by sex, age, and race-ethnicity in the US adult population from NHANES 1999–2004. Am J Clin Nutr 95: 594–602.
16. Ogden CL, Carroll MD, Curtin LR, McDowell MA, Tabak CJ, et al. (2006) Prevalence of overweight and obesity in the United States, 1999–2004. JAMA 295: 1549–1555.
17. Seidell JC, Hautvast JGAJ, Deurenberg P (1989) Overweight: Fat Distribution and Health Risks. Epidemiological Observations. Transfusion Medicine and Hemotherapy 16: 276–281.
18. Jurimae T, Sudi K, Jurimae J, Payerl R, Tafeit E (2005) Validity of optical device lipometer and bioelectric impedance analysis for body fat assessment in men and women. Coll Antropol 29: 499–502.
19. Tafeit E, Horejsi R, Pieber TR, Roller RE, Schnedl WJ, et al. (2008) Subcutaneous Fat Patterns in Type-2 Diabetic Men and Healthy Controls. Coll Antropol 32: 607–614.
20. Sudi KM, Tafeit E, Mo¨ller R, Reiterer E, Gallistl S, et al. (2000) Relationship between different Subcutaneous Adipose Tissue Layers, Fat Mass, and Leptin in Respons to Short-Term Energy Restriction in Obese Girls. Am J Hum Biol 12: 803–813.
21. Mo¨ller R, Tafeit E, Pieber TR, Sudi K, Reibnegger G (2000) Measurement of subcutaneous adipose tissue topography (SAT-Top) by means of a new optical device, Lipometer, and the evaluation of standard factor coefficients in healthy subjects. Am J Hum Biol 12: 231–239.
22. Tafeit E, Greilberger J, Cvirn G, Lipp RW, Schnedl WJ, et al. (2009) Estimating DXA Total Body Fat Percentage by Lipometer Subcutaneous Adipose Tissue Thicknesses. Coll Antropol 33: 391–396.
23. Tafeit E, Mo¨ller R, Sudi K, Reibnegger G (2000) ROC and CART analysis of subcutaneous adipose tissue topography (SAT-Top) in type-2 diabetic women and healthy females. Am J Hum Biol 12: 388–394.
24. Vikram NK, Misra A, Pandey RM, Dudeja V, Sinha S, et al. (2003) Anthropometry and body composition in northern Asian Indian patients with type 2 diabetes: receiver operating characteristics (ROC) curve analysis of body mass index with percentage body fat as standard. Diabetes Nutr Metab 16: 32– 40.
25. Youden WJ (1950) Index for rating diagnostic tests. Cancer 3: 32–35. 26. Witt KA, Bush EA (2005) College athletes with an elevated body mass index
often have a high upper arm muscle area, but not elevated triceps and subscapular skinfolds. J Am Diet Assoc 105: 599–602.
27. Blew RM, Sardinha LB, Milliken LA, Teixera PJ, Going SB, et al. (2002) Assessing the validity of body mass index standards in early postmenopausal women. Obes Res 10: 799–808.
28. Curtin F, Morabia A, Pichard C, Slosman DO (1997) Body mass index compared to dual-energy x-ray absorptiometry: evidence for a spectrum bias. J Clin Epidemiol 50: 837–843.
29. Dudeja V, Misra A, Pandey RM, Devina G, Kumar G, et al. (2001) BMI does not accurately predict overweight in Asian Indians in northem India. Br J Nutr 86: 105–112.
30. Goh VH, Tain CF, Tong TY, Mok HP, Wong MT (2004) Are BMI and other anthropometric measures appropriate as indices for obesity? A study in an Asian population. J Lipid Res 45: 1892–1898.
31. Hortobagyi T, Israel RG, O’Brien KF (1994) Sensitivity and specifity of the Quetelet index to assess obesity in men and women. Eur J Clin Nutr 48: 369– 375.
32. Wellens RI, Roche AF, Khamis HJ, Jackson AS, Pollock ML, et al. (1996) Relationships between the Body Mass Index and body composition. Obes Res 4: 35–44.
33. Heymsfield SB, Scherzer R, Pietrobelli A, Lewis CE, Grunfeld C (2009) Body mass index as a phenotypic expression of adiposity: quantitative contribution of muscularity in a population-based sample. Int J Obes 33: 1363–1373. 34. Malina M, Mueller WH, Bouchard C, Shoup RF, Lariviere G (1982) Fatness
and fat patterning among athletes at the Montreal Olympic Games 1976. Med Sci Sports Exerc 14: 445–452.
35. Tafeit E, Mo¨ller R, Pieber TR, Sudi K, Reibnegger G (2000) Differences of subcutaneous adipose tissue topography in type-2 diabetic (NIDDM) women and healthy controls. Am J Phys Anthropol 113: 381–388.
36. Heymsfield SB, Lohman TG, Wang Z, Going SB (2005) Human Body Composition. Champaign: Human Kinetics. 33–108.
37. Horejsi R, Mo¨ller R, Pieber TR, Wallner S, Sudi K, et al. (2002) Differences of subcutaneous adipose tissue topography between type-2 diabetic men and healthy controls. Exp Biol Med (Maywood) 227: 794–798.
38. Tafeit E, Mo¨ller R, Rackl S, Giuliani A, Urdl W, et al. (2003) Subcutaneous adipose tissue pattern in lean and obese women with polycystic ovary syndrome. Exp Biol Med 228: 710–716.
39. Tafeit E, Mo¨ller R, Sudi K, Reibnegger G (1999) The determination of three subcutaneous adipose tissue compartments in non-insulin-dependent diabetes mellitus women with artificial neural networks and factor analysis. Artif Intell Med 17: 181–193.
40. Wallner SJ, Luschnigg W, Schnedl WJ, Lahousen T, Sudi K, et al. (2004) Body fat distribution of overweight females with a history of weight cycling. Int J Obes Relat Metab Disord 28: 1143–1148.