Application of adiposity indices to a sample of physically
active individuals living in the city of Ribeirão Preto, São
Paulo, Brazil
Mirele Savegnago MialichI, Ana Maria AielloI, Bruna Ramos SilvaI, Alceu Afonso JordãoI
DOI: 10.5935/MedicalExpress.2018.mo.004
I Universidade de São Paulo, Faculdade de Medicina de Ribeirão Preto, Departamento de Clínica Médica, Ribeirão Preto, SP, Brazil.
OBJECTIVE: To compare adiposity indexes in physical activity individuals to evaluate behavior, diagnostic ability and to determine which parameter best reflects and diagnoses body fatness.
METHODS: A cross-sectional study was performed on 100 physically active individuals (59% female). The participants were submitted to anthropometric and body composition evaluation; we measured weight, height, circumferences, blood pressure and bioelectrical impedance analysis. A physical activity questionnaire (IPAQ, short version) was applied, as well as a questionnaire about the possible use of nutritional supplementation. The data were statistically analyzed, with significance level set at p <0.05.
RESULTS: Mean age, height, weight and BMI were 24.2 ± 6.65 years, 169.5 ± 8.94 cm, 69.1 ± 14.83 kg and 23.9 ± 4.19 kg/m2 , respectively, with a significant difference between the genders, except for age. Most of the subjects
were in the normal weight range, with a BMI of 18.5 to 24.9 kg/m2, and were very active. BMIfat correlated better
with body fat for males (r = 0.896) and females (r = 0.935), followed by BMI (0.689 and 0.767, respectively) and BAI (0.590 and 0.718).
CONCLUSIONS: Adiposity indexes are viable alternatives for the diagnosis of obesity and should be more explored as fast, practical and low cost measures in clinical practice.
KEYWORDS: Body composition, Fat mass, Adiposity index, Body mass index, Physically active individuals
Mialich MS, Aiello AM, Silva BR, Jordão AA. Application of adiposity indices to a sample of physically active individuals living in the city of Ribeirão Preto, São Paulo, Brazil. MedicalExpress (São Paulo, online). 2018;5:mo18004
Received for Publication on February 21, 2018; First review on March 26, 2018; Accepted for publication on April 14, 2018; Online on June 3, 2018
E-mail: [email protected]
■
INTRODUCTIONObesity is a complex morbidity caused by different types of aetiology such as genetic, environmental,
behavioural, social and emotional causes.1 In Brazil,
according to the data of the latest VIGITEL (Surveillance of risk factors and protection against chronic disease by telephone inquiry), the frequency of obesity is 16.8%, with a higher prevalence among men aged up to 44 years, and the condition is also associated with a lower
educational level.2
Although the BMI is one of the indices most extensively used for the diagnosis of obesity, it does not
assess body composition.3 Therefore, it is of fundamental
importance to use methods with a greater ability to
Copyright © 2016 MEDICALEXPRESS. This is an open access article distributed under the terms of the creative commons attribution Non-Commercial License (creativecommons.org/licenses/by-nc/4.0/) which permits unrestricted non commercial use, distribution
diagnose body fat in order to select parameters for a more accurate diagnosis of obesity.
The practice of physical activity is of extreme importance not only for energy expenditure, but also
for the modification of body composition since physical
study was conducted at each selected gym by means of pamphlets and oral explanation and the subjects interested
in participating in the study received clarifications from the
principal investigator for later scheduling of data collection. For the execution of the measurements, the subjects were asked to fast for at least 4 hours, not to have practiced any strenuous physical activity during the last 12 hours, to have abstained from alcoholic drinks or drinks containing caffeine for the previous 24 hours, and to wear light clothing. Two questionnaires were then applied to the participants:
the International Physical Activity Questionnaire (IPAQ)8,
short version, and a food supplementation questionnaire elaborated by the investigators themselves. All procedures were approved by the local Ethics Committee (case # 1955/2010).
Procedures. Weight, height, and waist, hip and arm circumferences were measured by the same examiner in triplicate. Weight was measured with the electronic scale BC-558 Ironman Segmental Body Composition Monitor (Tanita Corp., Tokyo, Japan), with a maximum capacity of 150 kg and precision of 0.01 kg. All subjects were barefoot and wore light clothing, with no accessories. Height
was measured by the method of Heymsfield9 and the
circumferences were measure by the method of Lohman et al.10
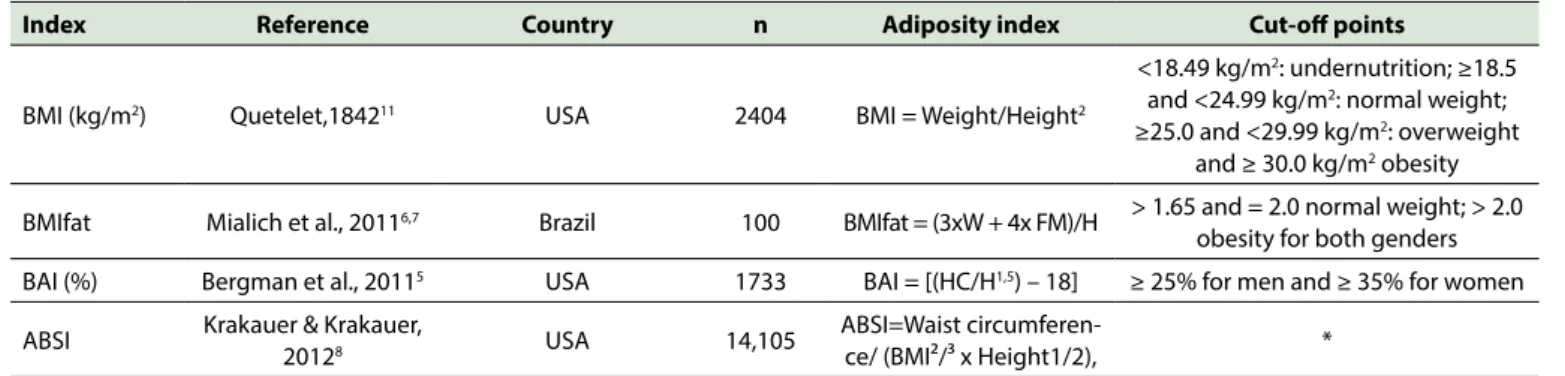
Fat-free mass (FFM) and fat mass (FM) were measured with the bioelectrical impedance analysis instrument BC-558 Ironman Segmental Body Composition Monitor (Tanita Corp., Tokyo, Japan). For this exam, the subject wore no socks or shoes and wore light clothing. Care was taken to make sure that their heels were correctly aligned with the electrodes of the measuring platform. The adiposity indices were calculated after the anthropometric measurements and the BIA test. Table 1 presents the
formulae for the calculation and classification of the indices.
The short version of the IPAQ8 was used to assess
physical activity. This questionnaire analyses the physical activities performed by the subjects during the day, divided into blocks: light, moderate and vigorous activities. The questionnaire also concerns the period of time the subject body fat percentages highly compatible with the biotype of
athletes of some sports modalities.4
Since it is extremely important to find methods
that will analyse body composition, especially in active individuals who somehow have the opportunity to modulate their body composition by means of physical exercise, some authors have proposed new adiposity indices such as the
Body Adiposity Index (BAI),5 BMI adjusted for fat mass
(BMIfat)6,7 and A Body Shape index (ABSI).3 These indices
are based on equations that provide a different approach to measurement, thus representing a new option for the
diagnosis and classification of body composition.
Because BAI, BMIfat and ABSI have only been recently proposed, few studies have been conducted to test the new indices, mainly in a population of physically active individuals in order to determine which one best
reflects and diagnoses body adiposity. Table 1 shows the
mathematical equations for each of these adiposity indices described. Thus, the objective of the present study was to compare adiposity indices in persons practicing physical activity in order to assess the behaviour, diagnostic capacity and possible limitations of each index and to determine a
more efficient method for the analysis of body composition
in physically active subjects.
■
METHODSSubjects. The study sample comprised 100 Brazilian individuals (Females/Males = 59/41) frequenting gyms in the city of Ribeirão Preto, São Paulo (population 600,000 inhabitants, HDI 0.800). After giving written informed consent to participate in the study, the subjects were submitted to anthropometric measurements such as arm, waist and hip circumference, weight, height, bioelectrical impedance analysis, and blood pressure. Exclusion criteria were age of less than 18 years and amputated or
immobilised limbs due to the difficulty in performing the
measurements. Also excluded were persons wearing a heart pacemaker, aneurysm clip or metal implants of any type (metal wire, plate or screw). A presentation of the
Table 1. Description of the study related to the development of the new adiposity indices.
Index Reference Country n Adiposity index Cut-off points
BMI (kg/m2) Quetelet,184211 USA 2404 BMI = Weight/Height2
<18.49 kg/m2: undernutrition; ≥18.5
and <24.99 kg/m2: normal weight;
≥25.0 and <29.99 kg/m2: overweight
and ≥ 30.0 kg/m2 obesity
BMIfat Mialich et al., 20116,7 Brazil 100 BMIfat = (3xW + 4x FM)/H > 1.65 and = 2.0 normal weight; > 2.0
obesity for both genders BAI (%) Bergman et al., 20115 USA 1733 BAI = [(HC/H1,5) – 18] ≥ 25% for men and ≥ 35% for women
ABSI Krakauer & Krakauer,
20128 USA 14,105
ABSI=Waist
spends sitting during one day of the week and one day of the weekend.
A food supplementation questionnaire elaborated by the investigators themselves was applied in order to determine the possible use of such supplementation. When the response was positive, the subject was asked to report the type, time of use, adherence to the guidelines of the label and indication of the supplementation, as well as who had prescribed it.
For the measurement of blood pressure using an automated digital device (G-TECH, Model MA 100), the subjects were instructed to rest a few minutes after arriving at the gym. The participants remained sitting, with arms and legs stretched and were instructed to remain silent while systolic arterial pressure (SAP) and diastolic arterial pressure (DAP) were measured.
Statistical Analysis. Descriptive analysis expressed as mean and standard deviation was carried out and comparison between two means was performed by the
Student t-test. Pearson correlation was calculated to
determine the adiposity index (BMI, BMIfat, BAI and
ABSI) that best correlated with body fat obtained by BIA.
Sensitivity, specificity, 95%CI were calculated for the
analysis of the diagnostic performance of the adiposity indices and receiver operating characteristic (ROC) curves were constructed for the detection of the areas under the curve. All analyses were carried out with the aid of the SAS
software, version 9.0. with the level of significance set at
p<0.05.
■
RESULTSThe total sample consisted of 100 individuals, 41 makes and 59 females. Table 2 presents the anthropometry, body composition and blood pressure data. It can be seen that mean weight, height, BMI and arm and waist circumferences were higher for males (p<0.001), while age (p=0.808) and hip circumference (p=0.005) did not differ
significantly between genders.
The data obtained by bioelectrical impedance analysis showed mean values of 63.47±6.78 kg and 41.91±3.62 kg for FFM (p<0.001), 16.73±5.51% and 26.09±6.97% for FM (p<0.001), and 59.88±4.68% and 54.68±4.97% for total body water (p<0.001) for men and women, respectively. Mean SAP was also higher for men (124.8±11.69 versus 108.75±19.12; p<0.001), whereas DAP did not differ between genders. Analysis of the adiposity indices showed that only BMI and BAI differed significantly between genders.
A classification of nutritional status based on BMI
showed that most participants were in the normal weight
range (18.5 – 24.9 kg/m2), i.e., 72.8% of the women and
51.2% of the men, whereas 39.0% of the men were in the overweight range, as shown in Figure 1.
Table 2. Anthropometric and body composition characterization and adiposity indices for the sample as a whole and divided by gender.
Variable Whole
sample Males Females P value
N 100 41 59
-Age (years) 24.2±6.65 23.95±5.59 24.68±7.20 0.8081 Weight (kg) 69.1±14.83 80.66±11.26 60.99±11.05 <0.001* Height
(cm) 169.5±8.94 177.24±6.58 164.07±5.73 <0.0001* AC (cm) 30.8±5.12 34.87±3.87 28.03±3.81 <0.0001* WC (cm) 81.6±9.86 86.70±8.31 78.14±9.22 <0.0001* HC (cm) 101.3±8.02 103.45±6.67 99.83±8.47 0.0051 FM (%) 22.2±7.93 16.73±5.51 26.09±6.97 <0.0001* FFM (kg) 50.8±11.85 63.47±6.78 41.91±3.62 <0.0001* TBW (%) 56.8±5.51 59.88±4.68 54.68±4.97 <0.0001* SAP
(mmHg) 115.3±18.75 124.80±11.69 108.75±19.72 <0.0001* DAP
(mmHg) 69.5±11.56 71.44±8.72 68.19±12.92 0.1674 BMI 23.9±4.19 25.64±3.00 22.73±4.44 <0.0001* BAI 28.1±4.39 25.88±2.67 29.60±4.65 <0.0001* BMIfat 1.7±0.33 1.74±0.27 1.75±0.36 0.8719 ABSI 0.1±0.01 0.07±0.00 0.08±0.01 0.1582
AC: arm circumference, WC: waist circumference, HC: hip circumference, FM: fat mass, FFM: fat-free mass, TBW: total body water, SAP: systolic arterial pressure, DAP: diastolic arterial pressure, BMI: body mass index, BAI: body adiposity índex, BMIfat: body mass index adjusted for fat mass, ABSI: a new body shape índex.
. * Data displayed as mean ± standard deviation and p values calculated by the Student t-test, with p< 0.05 considered to be a significant difference between males and fenales.
Figure 1. Subject classification according to body mass index values for each gender.
Considering the pattern of physical activity included participants, most subjects were found to be very active (70.7% of the men and 32.3% of the women), followed by active subjects (2.3% for men and 35.5% for women). This
was expected according to the profile of the study sample,
classified as irregularly active and a small portion of the
women as sedentary (1.7%), as illustrated in Figure 2. Fo r t y- t h re e s u b j e c t s u s e d s o m e t y p e o f supplementation (43%), 53.5% of them males and 46.5% females, while 57 subjects did not use supplementation (57%). The subjects who stated that they took some type of supplementation were asked to provide additional information such as 1) the type(s) used. In most cases, they reported the use of exclusively protein supplements (69.8%) while 30.2% reported the use of carbohydrate supplements. 2) Regarding time of use, most subjects (32.5%) reported 1 to 3 months and 28% reported more than 12 months. 3) When asked if they followed the guidelines of the label, 70% responded that they did not, only 25.5% reported prescription by a nutritionist and 23.2% by physical educators, while large part of the subjects (51.1%) reported that they took supplements based on their own knowledge.
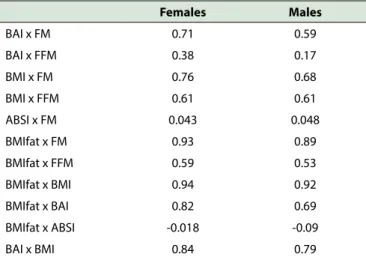
Pearson correlation analysis (Table 3) revealed that, for the sample as a whole, fat mass obtained by bioelectrical impedance analysis was strongly and positively correlated with BAI (r=0.747) and BMIfat (r=0.760), only moderately and weakly correlated with BMI (r=0.368) and not correlated at all with ABSI (r=0.119). When considering only females, BMIfat (r=0.935) was superior to BAI (r=0.718) and BMI (r=0.767). Finally, for men, there was a strong and positive correlation between FM and BMI (r=0.689) and FM and BMIfat (r=0.896), a moderate to high correlation between FM and BAI (r=0.590), and no correlation between FM and ABSI. Direct analysis of the correlation between adiposity indices, with the inclusion of FM and FFM, revealed that, even though BMIfat was strongly correlated with BMI (r=0.94 for females and r=0.92 for males), it had a greater capacity of predicting FM (r=0.93) compared to BMI (r=0.89) for both genders.
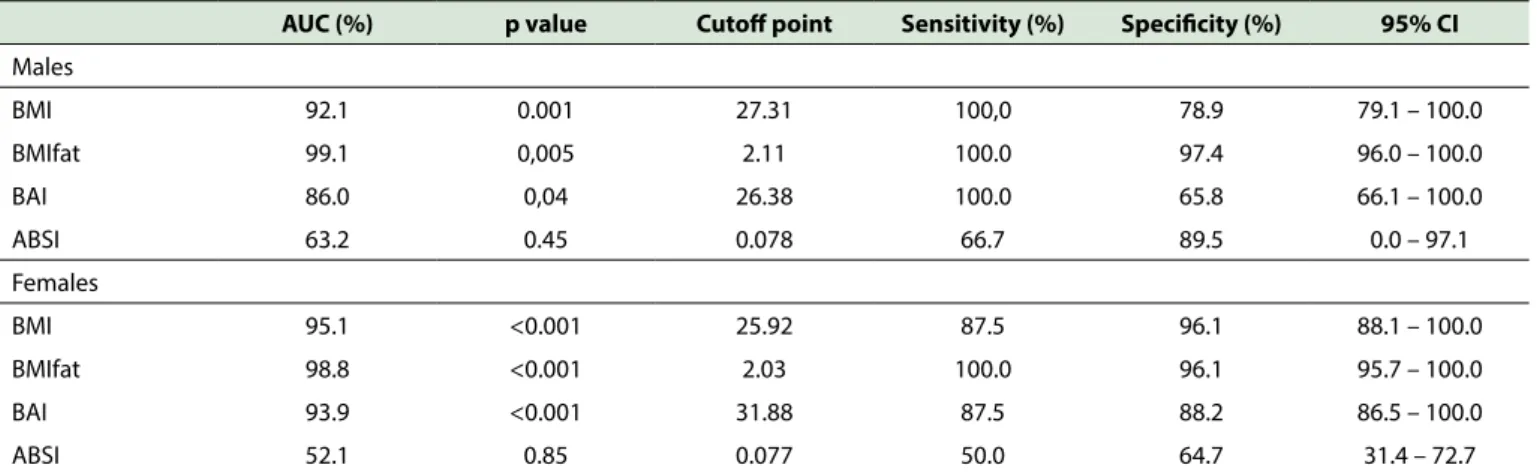
Analysis of the ROC curves provides a description of discriminatory capacity of each index based on body fat (%) obtained by bioelectrical impedance analysis. The area under the curve (AUC) for BMIfat was greater than that of all other indices for both men (99.1%) and women (98.8%), as shown in Table 4. The decreasing
IPAQ: International Physical Activity Questionnaire
Figure 2. Classification of the physical activity pattern of the subjects according to the IPAQ.
Table 3. Pearson correlations between the adiposity indices (BMI, BMIfat, BAI, ABSI) and fat mass (FM) and fat-free mass (FFM) obtained by BIA for both genders.
Females Males
BAI x FM 0.71 0.59 BAI x FFM 0.38 0.17 BMI x FM 0.76 0.68 BMI x FFM 0.61 0.61 ABSI x FM 0.043 0.048 BMIfat x FM 0.93 0.89 BMIfat x FFM 0.59 0.53 BMIfat x BMI 0.94 0.92 BMIfat x BAI 0.82 0.69 BMIfat x ABSI -0.018 -0.09 BAI x BMI 0.84 0.79
BMI: body mass index, BAI: body adiposity index, BMIfat: body mass index adjusted for fat mass, ABSI: A new body shape index, FFM: fat-free mass, FM: fat mass, M: male, F: female.
sequence for more satisfactory AUC values was for BMI > BAI > ABSI and occurred for both genders. The ROC curves demonstrated that the cut-off point for BMI was 27.31 for men (95%CI 79.1-100.0%), with 100.0% sensitivity and
78.9% specificity. Among women, the cut-off point for BMI
was 25.92 (95%CI 88.1-100.0%), with 87.5% sensitivity
and 96.1% specificity. The cut-off point for BMIfat was 2.11
for men (95%CI 96.0-100.0%), with 100.0% sensitivity
and 97.4% specificity. Among women, the cut-off point
for BMIfat was 2.03 (95%CI 95.7-100.0%), with 100.0%
sensitivity and 96.1% specificity. For the BAI, the cut-off
point for men was 26.38 (95%CI 66.1-100.0%), with 100.0%
sensitivity and 65.8% specificity. Among women, the cut-off
point for BAI was 31.88 (95%CI 86.5-100.0%), with 87.5%
sensitivity and 88.2% specificity. Finally, the cut-off point
for ABSI was 0.078 for men (95%CI 0.0-97.1%), with 66.7%
sensitivity and 89.5% specificity. Among women, the cut-off
point for ABSI was 0.077 (95%IC 31.4-72.7%), with 50.0%
sensitivity and 64.7% specificity (Table 4).
■
DISCUSSIONThe body index most commonly used to estimate excess weight and obesity has been BMI. Unfortunately, a
higher BMI does not always reflect the increase in fat mass
because excess weight may be the consequence of increased fat free mass, this being a particularly evident concern among athletes, who have a greater musculoskeletal development.
The present study considered adiposity indices that contribute to a better analysis of the body composition
profile when compared to BMI, because this index,
Table 4. ROC curve analysis for the adiposity indices (BMI, BMIfat, BAI and ABSI), area under the curve (AUC), sensitivity, specificity, confidence interval (95% CI), and cut-off point for each index for males and females, respectively.
AUC (%) p value Cutoff point Sensitivity (%) Specificity (%) 95% CI
Males
BMI 92.1 0.001 27.31 100,0 78.9 79.1 – 100.0 BMIfat 99.1 0,005 2.11 100.0 97.4 96.0 – 100.0 BAI 86.0 0,04 26.38 100.0 65.8 66.1 – 100.0 ABSI 63.2 0.45 0.078 66.7 89.5 0.0 – 97.1 Females
BMI 95.1 <0.001 25.92 87.5 96.1 88.1 – 100.0 BMIfat 98.8 <0.001 2.03 100.0 96.1 95.7 – 100.0 BAI 93.9 <0.001 31.88 87.5 88.2 86.5 – 100.0 ABSI 52.1 0.85 0.077 50.0 64.7 31.4 – 72.7
BMI: body mass index, BMIfat: body mass index adjusted for fat mass, BAI: body adiposity index, ABSI: A new body shape index.
Recently, Silva et al.12 reported a study with 501
individuals and compared the diagnostic performance of adiposity indices: body mass index (BMI), body mass index adjusted for fat mass (BMIfat), body adiposity index (BAI) and body adiposity index for the Fels Longitudinal Study sample (BAIFels) and the overweight detection in a sample of the Brazilian population. The ROC curve of BMIfat was clearly superior to all other indexes for both men (93.1%)
and women (97.8%), respectively. These findings suggest
that BMIfat is the index that has better relationship with the prediction of body fat, BAI did not exceed the limitations of BMI in this specif sample, but it is important that future studies with adiposity indices also adopt a gold standard method for assessing body composition such as double-energy radiologic absortometry (DXA) for comparisons.
Santos et al.13 compared the BAI, ABSI and BMI
indices in a study on elite athletes. The mean age of the participants was 22.6±4.6 years, mean weight was 74.1 ±12.7 kg, mean height was 178.2 ±9.9 cm, waist circumference was 97.1 ± 6.7 cm, BMI was 23.2 ±2.8 kg/ m², BAI was 23.0±3.3%, and ABSI was 0.074± 0.003 (ABSI
has no defined cut-off points). Among the subjects studied,
weight, height, waist circumference, BMI, BAI and ABSI
differed significantly between sexes (13). In the present
study, BAI, BMI, weight circumference, weight and height also differed between genders (p<0.05). In the cited study, the authors used bioelectrical impedance spectroscopy (BIS) to predict body fat and obtained a mean value of 14.4± 8.0%. The value for the present sample, 22.2±7.93%, was higher, an occurrence that may be explained by the fact that the participants were physically active individuals (practicing exercises in gyms) but not actual elite athletes.
In this respect, Santos et al.13 compared the BMI
classification to percent body fat and observed that the
BMI did not classify any athlete as being of low weight (BMI<18.5 kg/m²), and that 30.8% of the men and 40% of the women were below the normal percent FM value. The
final result was that only 52.9% of the men and 50% of the women were well classified by the BMI.
Another study of male athletes analysed the correlation between BAI, BMI and body fat; this study observed that percent fat mass estimated by bioelectrical impedance analysis had a higher correlation with the BMI (r=0.55; p< 0.001) than with the BAI r= 0.50; p< 0.001), a fact also observed in the present study in which BMI (r=0.689) also showed a stronger correlation than BAI (r=0.590) with percent body fat in physically active male athletes. In contrast, regarding the correlation between BMI
and BAI, Banik & Das14 obtained a value of 0.89 versus the
present value of 0.79 for male subjects.
In 2015, González and Ramíres compared BAI to other anthropometric variables such as body weight, BMI, waist circumference, hip circumference and waist-hip ratio, sum of 6 skinfolds and percent body fat in 149 Colombian elite athletes (mean age: 26.3±6.5 years; height: 169.2±10.1cm; body mass: 66.1±12.8kg; body mass index
22.9 ± 3.0 kg/m2). A significant relationship between the
body adiposity index (BAI) and body fat percent (R2 = 0.407,
p < 0.01) was observed; authors concluded that adiposity
indexes which include the percentage body fat and body
adiposity index could be used as indicators.15
Among the limitations of the present study is the lack of comparison of BIA with a gold standard method for the assessment of body composition. However, in their
review Moon et al.16 emphasized the fact that, even though
the bioelectrical impedance analysis and anthropometric equation tests show different results, all studies show
a good correlation between the two methods15. These
authors also underscored that both hydrostatic weighing and double-energy radiologic absortometry (DXA) seem to produce values closely similar to those of bioelectrical impedance analysis, with the latter being inherently more prone to errors. In addition, we recognize that, by being a
convenience sample, the present population may not reflect
BMI was and still is partially a valid index, but the world population, especially with regard to excess body fat and obesity, has changed a lot since the period in which the BMI was developed. For this reason, it is necessary
to propose a refinement of this index mainly considering
the increased rates of obesity and the ethnic differences between populations. Thus, new adiposity indices have been developed as alternatives for the diagnosis of obesity, with BMIfat showing the best correlation with body fat in the sample studied here. Future studies should be conducted on larger sample sizes in order to stimulate the application of these indices in clinical practice.
■
CONFLICTS OF INTERESTThe authors declare that they have no conflicts of
interest.
■
AUTHOR PARTICIPATIONMS Mialich was responsible for the project, conducting the research, analyzing the results and writing the manuscript; AM Aiello was responsible for collecting and tabulating the data; BR Silva was responsible for the standardization of the methodology of data collection and protocol development, analysis of the results and writing of the manuscript; and AA Jordan, who was responsible for study, designing and monitoring the study, analysing the results and reviewing the manuscript.
APLICAÇÃO DE ÍNDICES DE ADIPOSIDADE EM UMA AMOSTRA DE INDIVÍDUOS FÍSICAMENTE ATIVOS RESIDENTES NA CIDADE DE RIBEIRÃO PRETO, SÃO PAULO, BRASIL
OBJETIVO: comparar os índices de adiposidade
em indivíduos praticantes de atividade física para avaliar
o comportamento, a capacidade diagnóstica e determinar
qual parâmetro melhor reflete e diagnostica a adiposidade
corporal.
MÉTODOS: Um estudo transversal foi realizado
em 100 indivíduos fisicamente ativos (59% mulheres). Os
participantes foram submetidos à avaliação antropométrica e de composição corporal, sendo aferidos peso, estatura, circunferências, pressão arterial e análise de impedância bioelétrica. Foi aplicado um questionário de atividade
física (IPAQ, versão curta), além de um questionário sobre o
possível uso da suplementação nutricional. Os dados foram
analisados estatisticamente, com nível de significância
estabelecido em p <0,05.
RESULTADOS: as médias de idade, estatura, peso e IMC foram 24,2 ± 6,65 anos, 169,5 ± 8,94 cm, 69,1 ± 14,83
kg e 23,9 ± 4,19 kg/m2, respectivamente, com diferença
correlacionado com a gordura corporal para homens (r = 0,896) e mulheres (r = 0,935), seguido pelo IMC (0,689 e 0,767, respectivamente) e BAI (0,590 e 0,718).
CONCLUSÕES: Os índices de adiposidade são
alternativas viáveis para o diagnóstico da obesidade e devem ser mais explorados como medidas rápidas, práticas e de baixo custo na prática clínica.
PALAVRAS-CHAVE: Composição corporal, Massa gorda, Índice de adiposidade, Índice de massa corporal,
Indivíduos fisicamente ativos
■
REFERENCES1. Associação Brasileira para o Estudo da Obesidade e da Síndrome Metabólica. Diretrizes brasileiras de obesidade 2009/2010 / ABESO - Associação Brasileira para o Estudo da Obesidade e da Síndrome Metabólica. - 3.ed. - Itapevi, SP:AC Farmacêutica, 2009.
2. Vigitel Brasil 2014 Saúde Suplementar: vigilância de fatores de risco e proteção para doenças crônicas por inquérito telefônico / Ministério da Saúde, Agência Nacional de Saúde Suplementar. – Brasília: Ministério da Saúde. 2015;165 p.il.
3. Krakauer NY, Krakauer JC. A new body shape index predicts mortality hazard independently of body mass index. PLoS One. 2012;7(7):e39504. DOI:10.1371/journal.pone.0039504
4. Sigulem DM, Devincenzi MU, Lessa AC. Diagnosis of child and adolescent nutritional status. J Pediatr. 2000;76(3):S275-84.
5. Bergman RN, Stefanovski D, Buchanan TA, et al. A better index of body adiposity. Obesity Silver Spring. 2011;19(5):1083-9. DOI:10.1038/ oby.2011.38
6. Mialich MS, Martinez EZ, Jordão Jr. AA. Comparative study of instruments for the analysis of body composition in a sample of the Brazilian population. Int J Body Comp Res. 2011;9(1):19-24.
7. Mialich MS, Martinez EZ, Garcia RWD, Jordão Jr AA. New body mass index adjusted for fat mass (BMIfat) by the use of electrical impedance. Int J Body Comp Res. 2011;9(2):65-72.
8. Matsudo S, Araújo T, Matsudo V, et al. Questionário de atividade física(IPAQ): estudo de validade e reprodutibilidade no Brasil/International physical activity questionnaire (IPAQ): study of validity and reability in Brazil. Rev Bras Ativ Saúde. 2001;6(2):05-18.
9. Heymsfield, S. B. Anthropometric measurements: application in hospitalized patients, Infusionstherapie. 1990;17:48-51. DOI:10.1159/000222552 10. Lohman T G, Roche AF, Martorell R. Anthropometric Standardization
Reference Manual. Champaign, Illinois: Human Kinetics, 1988.
11. Quetelet LAJ. Comparative statistics in the 19th century. Farnborough, United Kingdom: Gregg International Publishers; 1973. A treatise on man and the development of his faculties. Edinburgh, United Kingdom: William and Robert Chambers, 1842.
12. Silva BR, Mialich MS, Hoffman DJ, Jordão AA. BMI, BMIfat or BAIFels - Which is the best adiposity index for the detection of excess weight? Nutr Hosp. 2017;34(2)389-95 DOI:10.20960/nh.366
13. Santos DA, Silva AM, Matias CN, Magalhães JP, Minderico CS, Thomas DM, et al. Utility of novel body indices in predicting fat mass in elite athletes. Nutrition. 2015;31(7-8):948–54. DOI:10.1016/j. nut.2015.02.003.
14. Banik SD; Das S. Body mass index and body adiposity index in relation to percent body fat: A study in adult men of three endogamous groups of South Bengal. HOMO. 2015;66:90-9. DOI:10.1016/j.jchb.2014.10.002 15. Ramírez R, González K. Body adiposity index in Colombian elite
athletes: A comparison between the body mass index and other measures. Rev Colomb Cardiol. 2015;22(1):22-6. DOI:10.1016/j. rccar.2014.10.008