Human Footprint Variation while Performing
Load Bearing Tasks
Cara M. Wall-Scheffler1,2*, Janelle Wagnild3, Emily Wagler4
1Department of Biology, Seattle Pacific University, Seattle, Washington, United States of America,2
Department of Anthropology, University of Washington, Seattle, Washington, United States of America,3
Department of Anthropology, Durham University, Durham, United Kingdom,4Arizona School of Podiatric Medicine, Glendale, Arizona, United States of America
Abstract
Human footprint fossils have provided essential evidence about the evolution of human bi-pedalism as well as the social dynamics of the footprint makers, including estimates of speed, sex and group composition. Generally such estimates are made by comparing foot-print evidence with modern controls; however, previous studies have not accounted for the variation in footprint dimensions coming from load bearing activities. It is likely that a portion of the hominins who created these fossil footprints were carrying a significant load, such as offspring or foraging loads, which caused variation in the footprint which could extend to var-iation in any estimations concerning the footprint’s maker. To identify significant variation in footprints due to load-bearing tasks, we had participants (N = 30, 15 males and 15 females) walk at a series of speeds carrying a 20kg pack on their back, side and front. Paint was ap-plied to the bare feet of each participant to create footprints that were compared in terms of foot length, foot width and foot area. Female foot length and width increased during multiple loaded conditions. An appreciation of footprint variability associated with carrying loads adds an additional layer to our understanding of the behavior and morphology of extinct hominin populations.
Introduction
In the process of reconstructing the hominin lineage, every available clue has the potential to provide key insights into the timeline and pathway by which the hominin lineage has evolved. Skeletal elements have been the basis for the identification of newly discovered hominin species [e.g.Ardipithecus ramidus[1],Australopithecus sediba[2]] and provide insights into what spe-cific and unique adaptations each species may have had, the intrapopulation diversity [3], and when particular human-like traits (e.g. increased encephalization and bipedalism) first appear in the fossil record. For all hominins, skeletal remains provide valuable insight into morpholo-gy, behavior and niche. For example, the stature of extinct hominins has been estimated based upon the reconstruction of the skeleton [4,5], femur/stature ratio [6], and regression formulae [7,8] with each method independently producing comparable results. Hominin body mass can OPEN ACCESS
Citation:Wall-Scheffler CM, Wagnild J, Wagler E (2015) Human Footprint Variation while Performing Load Bearing Tasks. PLoS ONE 10(3): e0118619. doi:10.1371/journal.pone.0118619
Academic Editor:David Carrier, University of Utah, UNITED STATES
Received:August 7, 2014
Accepted:January 21, 2015
Published:March 4, 2015
Copyright:© 2015 Wall-Scheffler et al. This is an open access article distributed under the terms of the Creative Commons Attribution License, which permits unrestricted use, distribution, and reproduction in any medium, provided the original author and source are credited.
Data Availability Statement:The authors confirm that all data underlying the findings are fully available without restriction. All relevant data are within the Supporting Information files.
be estimated based upon femoral head breadth [5,9,10], hindlimb joint size [11] or by stature and pelvic breadth [12], though for extinct hominins whose stature is an estimate, this is less reliable [13]. Furthermore, skeletal data allows the degree of a species’sexual dimorphism to be determined [14,15].
Fossilized skeletal elements also provide bases for interpretation of locomotor style and ef-fectiveness, giving further clues as to niche and behavior. The functional morphology and loco-motion of extant populations and individuals has been studied in depth, and from these studies the particular anatomical traits most essential for humans’terrestrial bipedality (e.g. lumbar lordotic curve, large femoral head, anteriorly curved iliac blades) have been identified [16,17]. By looking for these traits in extinct hominin skeletons, extinct hominins’capability for human-like bipedality can be estimated, though how species-specific traits not seen in humans (e.g. broad iliac flare inA. afarensis) affect locomotor style is not agreed upon [18–20].
A possible means of bridging gaps between the morphology and locomotor effectiveness lies in evidence from fossilized footprint trails. Fossilized footprints from a broad range of time pe-riods [Laetoli [21], Ileret [22], Hawaii [23]] have augmented skeletal data by providing addi-tional evidence corroborating and/or reshaping the interpretation of the skeletal data of a particular species. Footprints have been used to supplement stature and body mass estimations based upon skeletal segments because forensic data show quite clearly that footprint dimen-sions correlates well with stature [24] and unloaded body mass [25]. Additionally, particular aspects of foot morphology can be directly observable within fossilized prints and compared with reconstructions based on bony elements alone (e.g. toe pad shape and separation, toe length, and hallux position [22,23]). Finally, specific details of locomotor patterns are pre-served in fossilized footprints. Footprints have been used to indicate the cadence at which the species walked [17], the stride lengths of the individuals [23,26–30], the pattern of weight transfer while walking [31,32] and whether individuals were walking with other individuals [21,22]. Experimental data from extant populations with recorded stature, mass, cadence and speed can further confirm relationships between the footprint tracks and behavior of extinct hominins [31,33–35]. Thus footprint data have the potential to add crucial dimensions to pa-leoanthropologists’interpretation of functional morphology and enhances understanding about extinct species’locomotor and social behavior.
The first direct evidence of habitual bipedality comes from the Laetoli footprints (3.6mya) [36], most likely made byAustralopithecus afarensisindividuals [37]. While it cannot be certain what particular subsistence strategy these extinct hominins used, it has been strongly suggested that they adopted a form of foraging subsistence [38]. It is thus not clear how far their daily range may have been (and there is some disagreement) [39–41], though it has consistently been suggested that early bipeds carried some amount of foraging or lithic load in addition to carrying young offspring [42–53]. Therefore, because load-carrying of infants is a primate norm and carrying some amount of subsistence or technological product was likely typical of bipedal foragers [54], it is possible that the interpretation of some of the morphological charac-teristics of footprint makers, particularly mass and stature, will be influenced by the presence of the additional load.
How these populations carried the burdens is another important question, as different bur-den locations change both the mechanics and energetics of walking differently [49,55–59], and thus will have different stabilizing requirements which may influence footprint pattern [60]. Load carrying comes with some amount of postural adjustment, specific to the position of the load (e.g. a load on the left will come with a torso tilt to the right) [61]; such postural accommo-dations are accompanied by footfall adjustments including changes in stride length, contact time, step width, and speed or velocity [55,59,61–64]. These changes in kinematics have been shown to have significant effects on footprint patterns as well [33,35,36] suggesting that
Human Footprint Variation while Performing Load Bearing Tasks
study design, data collection and analysis, decision to publish, or preparation of the manuscript.
burden carrying, and carrying position in particular, may have an influence on the behavior of the foot during stance phase [65].
Ethnographic data on foragers suggests that women generally carry young babies on the front [66–68], and obviously the load of pregnancy (between 15–25% of body mass) is also lo-cated anteriorly. Older babies are often carried on the side while foraging [69], and some women have side satchels to load with tubers and other plant resources [70]. Additionally, mix-ing locations is typical and Ache women carry belongmix-ings and food on their back, and their children on their side [71]. Data on the !Kung also show diverse patterns of carrying, with a pouch on women’s backs for food, water and firewood, and various types of side satchels for tool kits, babies, and larger food items; older toddlers may also be placed in the pouch on the back [70]. Many women also carry plant resources on their back via a tump-line [51,59,72,
73] or other back basket [74].
!Kung and other San men primarily use side satchels, with differently sized satchels for their tool kits (smaller) and food (larger) [69,70]. Men across cultures may also use their digging sticks to create large yokes carried between two men for the purpose of carrying meat or bags of tobacco [70,75]. Men also carry meat slung over their torso in large strips [75] or sling the meat across their shoulders, with the mass of the meat located either anteriorly or diagonally-posterior to anterior [74]. Meat and tools may also be carried in their hands. Among the Pumé, men also use a carrying pole, but each man will carry his own, placed over a single shoulder with balance weight slung from each end [76]. Periodically men will also carry on their back using a tump-line/head-yoke [59,73].
It is thus clear that there are sex differences in loading behavior [51,55,71,77–81], as well as in loading placement. There is further evidence that females tend to carry burdens of a larger amount of mass, both relatively and absolutely, in the majority of hunter gatherer populations [51,77,80,81,92,102]. The importance of understanding the role that such patterns of behav-ior have on footprint morphology seems integral then to the understanding and interpretation of fossil footprints and other aspects of morphology.
Additionally, studies on the interaction between speed and burden suggest that carrying burdens significantly influences walking speeds, generally by making them slower if that is an option [55,71,80,82,83]. However, additional research shows that when traveling long dis-tances and/or traveling quickly, women are more likely to carry heavy, older offspring [84,85]. This suggests that the interplay between burden and speed may be moderated by other aspects of daily life, including transport distance [51]. Since both burden and speed have clear interac-tions when it comes to locomotor energetics and biomechanics [55,86] and since speed alone has been shown to have such a significant relationship with footprint dimensions [33,36,87], it seems that any investigation into the importance of burden carrying should also consider the speed at which the carrier is moving.
In order to investigate the interactions between speed and load on linear footprint patterns, here we test the effects of a 20-kilogram load on footprint shape when compared to prints made by the same individuals in an unloaded condition; both the unloaded and loaded condi-tions are carried out at three different speeds. Based on ethnographic literature, 20kg is well within the range of the mass of carried carcasses [88–90], nuts [80,91,92], plants [51,69,71,
73,77], or young children [71,84] carried by foraging populations. Twenty kilograms is also the amount attributed to raw material loads for early hominins at Olduvai [53]. Furthermore, when people are carrying their children (upwards of 4 and 5 years old in some foraging popula-tions) [93], they are often carrying the additional loads of plants and nuts in particular, making 20kg a reasonable load assessment for both males and females.
footprints. Since gait changes are numerous and potentially variable [33,36,55,59–65], only in seeing an entire gait sequence can we assess the potential changes in footprints caused by these different loading conditions. This requirement precluded us from using a foot pressure plate that would only have captured a single foot fall in one gait sequence. While this is often accom-modated in the literature by simply including many trials at the same condition, in order to compare with naturally occurring footprint tracks, we were interested in assessing the variation across an entire track of footprints made at one time. Additionally, when people perform novel tasks, or tasks in novel places, as might happen when carrying a load, it is possible for certain posture changes to occur [94,95], so we wanted to ensure that our participants were in a place familiar to them, thus choosing a hallway in one of the major classroom buildings on campus (though after hours, so other people were not a distraction). Finally, we had to decide whether to use a forcepad runway (“carpet”walkway), or the paper-and-pen method of measuring foot-prints. Both methods have been used in a variety of fields [96,97], and primarily for the pur-pose here, namely to measure foot width, foot length, stride length, and stride width across a gait series. For the measures we are taking here, it has been shown there is no difference be-tween the paper-and-pen method and the carpet walkway [98]. That being said, some problems with the carpet walkway methods include having to step very hard in order to get the‘correct’ responsiveness [98] (that is, a full footprint image) and the possibility of people changing their gait due to the electronic (vibrating) nature of the walkway [94]. To this end then, we decided on the paper-and-pen method of footprint analysis.
Methods
Thirty individuals (15 males, 15 females; age range 20–27 years, mean = 21.6years) were re-cruited for participation in this study. This research was approved by the IRB of Seattle Pacific University. The IRB approved the entire protocol as described in the paper. Every participant signed written informed consent, approved by the IRB, which completely explained the ap-proved protocol. Our sample is representative of the general population as males were heavier than females (respective means of 84.5kg versus 70.8kg) and taller than females (respective means of 182.8cm versus 167.7cm).
All participants were healthy and exhibited no unusual or pathological foot morphologies or gait patterns. The participants represent a habitually shod population. While shod and un-shod people do show differences in footprint patterns, one of the features of habitually un-shod feet is decreased foot flexibility [99], suggesting the feet will have reduced displacement [100,
101] and that we are less likely to find variations due to load bearing conditions; however, even stiffer feet may exhibit displacement if the load is heavy enough [101]. Thus we do expect that the sample here should suit our purpose of looking at loads.
As ethnographic literature contains numerous evidences of load carrying behavior, we chose to look at the most consistently used loaded positions: unloaded, front-loaded, side-load-ed, and back-loaded. Additionally, since previous research has shown that speed influences footprint patterns generally by increasing print length [33,36,87], at each loaded condition, we had participants walk at three self-selected walking speeds (slow, medium, fast). These 12 conditions were randomized for each participant using a random order generator (http://www. random.org).
Loading conditions
carry absolute loads and are not necessarily able to temper the load based on their body mass. The results from the ethnographic literature on foragers consistently state absolute burdens of food, children and household goods carried great distances particularly by females [51,77,80,
81,92,102]. This literature further suggests that females carry higher absolute and thus relative loads than males. To this end we felt it would be more realistic to assess the footprint behavior across males and females while they carried an absolute load.
In the front-loaded trials, a backpack loaded with a 20kg weight was worn backwards so that the weight sat at the belly. In the back-loaded trials, the same 20kg backpack was worn tra-ditionally with the weight sitting at the middle of the back. In the side-loaded trials, a messen-ger-style bag loaded with a 20kg weight was worn across the body on whichever side each participant preferred based on their handedness and rested on the side of the hip between the ilium and greater trochanter. Both the backpack and messenger bag were adjustable and were adjusted to fit each person’s stature to lie at the same belly/back/hip locations. In the unloaded trials, participants walked with no bag and no load.
Speed conditions
The three walking speeds were self-selected by each individual. Immediately prior to the testing session, participants were given a series of speed directives. That is, they were told to determine what they thought was a slow walking speed (as slow as possible while still maintaining a walk-ing gait), a medium walkwalk-ing speed (a speed they would probably choose when walkwalk-ing normal-ly), and a fast walking speed (as fast as possible while still maintaining a walking gait).
Participants were given as much time as necessary to get a feel for each of the speed directives so that they could consistently replicate them during testing. During each condition, the actual walking speed was determined using a stopwatch beginning at the first moment of the dynamic heel-down to the moment the person left the paper. This was then divided by the measurement of the distance that they traveled (seemeasurementsbelow). The stopwatch was operated by the same person for all trials and participants to ensure consistency. As the runway was short (*5m), the person running the stopwatch had a clear view of the entire runway and could
ac-curately assess the start and the stop; the use of a stopwatch to acac-curately determine time in walking trials is common [98,103].
Data collection
Six sheets of white butcher paper (4.6m long by 0.7m wide) were laid atop a stone floor that was uniform in texture. Immediately prior to each walking condition, participants sat in a chair at the end of each“track”while non-toxic colored paint diluted with water in a 1:1 ratio was ap-plied to the bottom of both feet with a foam paintbrush. The paint was mixed and apap-plied by the same person for all trials and participants to ensure consistency.
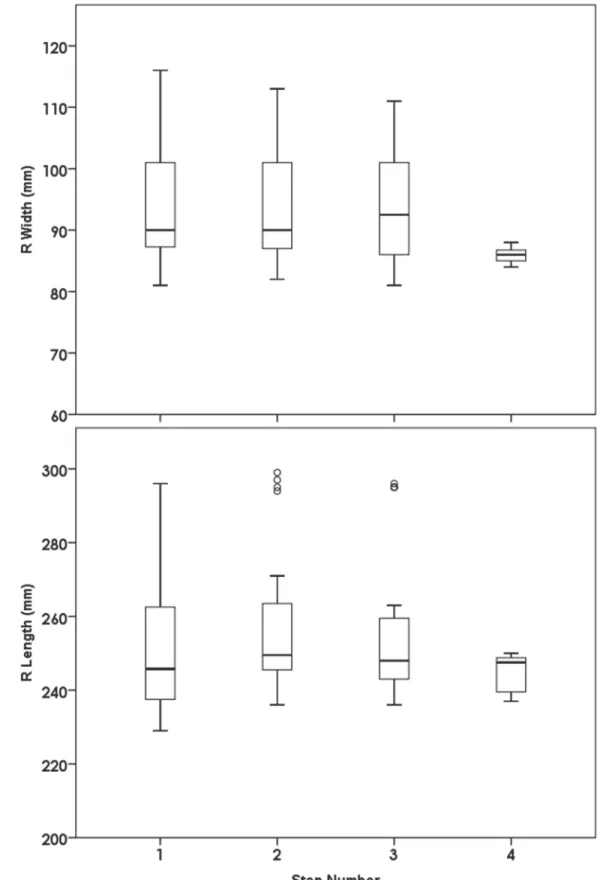
Once the paint had been applied, participants stood with feet shoulder-width apart at the end of the track and were loaded if applicable. They were then asked to take a step forward with both feet and hold for about two seconds to create a set of static footprints, and then were told to walk through the end of the track onto towels laid beyond the ends of the track accord-ing to the speed cue they were given. Most people made three footprints for each foot, with some people making four (total footprints between 6–8). There was no significant relationship between the footprint measures at the first step and the subsequent steps, suggesting that any potential‘loss of paint’over the course of each trial had no influence on the footprint measures (Fig. 1). All of the twelve, randomized conditions were performed within a one-hour period.
Fig 1. There was no influence of changes in paint amount or consistency across each trial: between step width and step number, p = 0.328; between step length and step number, p = 0.959.
doi:10.1371/journal.pone.0118619.g001
been tested in terms of its validity, reliability and consistency [98], mostly recently against other‘carpet’walkway methods [108]. It is generally considered the‘gold standard’in terms of the measures applied here [98], even though the analysis is not automated. Besides reliability, the pros of the paper and pen method are that people are more likely to use their habitual gait without modifying it due to the unfamiliar circumstances (e.g. novel environment, texture) [109,110] or by synchronizing with the electronic and oscillating resonance of the force plate [94]. While of great import for any locomotion study, these benefits are limited by the fact that we could not have identified specific moments of footfall timing (e.g. contact time) during the gait cycle. Such gait related variables are more ably attained through the use of something like a carpet walkway or force platform method; since these variables were not of interest here, we were able to preference the attainment of as natural a stride as possible.
We furthermore performed a small-scale (N = 10) reliability assessment and compared our paper and pen technique between footprints made on the floor and footprints made on a 6.4mm deformable latex pad. There was no significant effect of surface-type on the measures discussed below (p = 0.885), and the patterns between unloaded and loaded footprints were the same.
Measurements
Individual footprints were measured following Witana et al. [111], using the standard footprint measures of people measuring footprint remains [33,35,36]. The measurers were blind to all information (i.e. sex, load, speed) regarding the feet they were measuring. Maximum foot length (MFL) was measured as the distance along the Brannock axis: pternion to tip of second toe (Fig. 2). Maximum foot width (MFW) was measured as the most lateral aspect of the foot-print (fifth metatarsal) measured obliquely to the most medial aspect of foot-print; (Fig. 2). Foot area (FA) was calculated by multiplying foot length and foot width [33]. All feet were measured on both the right and the left sides. All data are available inS2 Dataset.
Statistical Tests
All analyses were done for both the left and the right sides to verify stability of results. P-values and figures are given for the right side.
Based on previous research on sex differences in locomotor mechanics [112,113], we ex-pected sex differences in footprint patterns and thus collected on a large enough number of each sex that we had the power necessary to run the analyses for each sex separately if the dif-ferences proved significant. Since many studies pool the sexes even in unloaded conditions (ex-pecting that controlling for mass will account for any differences), we investigated how much of the variation between the sexes in the unloaded condition alone was due to size (i.e. mass and stature), and how much might be due to sex-specific differences in foot morphology (see
S1 Dataset). We thus ran a GLM multivariate analysis with MFL, MFW and FA as dependent variables, sex as a fixed factor, and mass and stature as covariates. Following this, we further in-vestigated whether the sex-specific differences would also influence footprint behavior whilst loaded; to this end we repeated the above analysis, but included loaded versus unloaded as an additional factor.
speed directives are given separately, rather than as part of the loaded condition models, as the results were comparable across all of the loaded models.
Results
Sex
The GLM multivariate analysis of sex differences during unloaded walking on the three foot variables (MFL, MFW, FA) showed a significant sex effect (p<0.001) after mass and stature
(p<0.001 for both) were included in the model. The effect of sex was strongest on MFL (p =
0.001) (Fig. 3). The GLM multivariate analysis of sex differences during loaded walking on the three footprint variables similarly showed a significant sex effect (p<0.001). Based on these
two results, we were obligated to investigate the influence of load on footprints for each sex separately.
Front Load
Females show an increase in footprint dimensions with a front load (p = 0.093 for load’s effect on the model) (Figs.4and5); of the individual variables, FA reached significance (p = 0.042). Males show no significant changes in any footprint variables with front load.
Back Load
Neither male nor female footprint variables show any significant changes with back load (Figs.
4and5).
Side Load
Females show a significant increase in MFW with side loads (p<0.001) (Fig. 5) and as a
conse-quence an increase in foot area (p = 0.018).
Speed Directive
MFL increased with speed directive (e.g.“slow”or“fast”), though more clearly for males (p = 0.002) than females (p = 0.028). Speed directive had no significant influence on MFW or FA (See Summary inTable 1).
Discussion
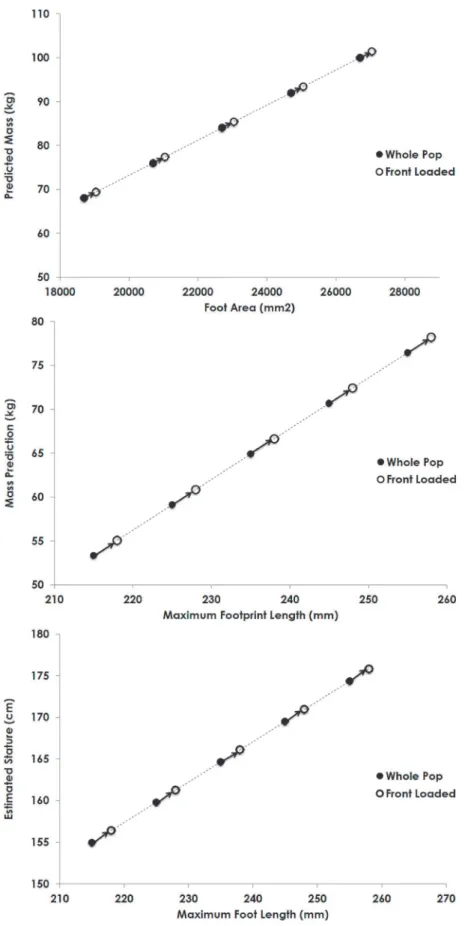
These results indicate that both sex and load can significantly and substantially influence fea-tures of footprint shape and can possibly confound evidence as to the size of the footprint maker. Because of the different relationship between mass and footprint pattern for the sexes (Fig. 3), single population regression lines (regressions that include both sexes) will not correct-ly estimate the mass or stature of females in particular. Additionalcorrect-ly, given the increase in foot-print size with loads, the footfoot-prints of loaded individuals will lead to an overestimation of the mass and stature of the footprint makers (Fig. 6).
The impact load has on footprint shape and walking speed is heavily influenced by the load-ed position. Though variable primarily basload-ed on speload-ed, frontal loads generally increase the
Fig 2. Maximum foot length (MFL) was measured as the distance along the Brannock axis: pternion to tip of second toe (A).Maximum foot width (MFW) was measured as the most lateral aspect of the footprint (fifth metatarsal) measured obliquely to the most medial aspect of print (B). For each series of footprints, stride length (E) was measured as the distance between the most posterior aspects of subsequent heels on each side.
length of footprints in females and as a consequence the entire foot area—particularly relevant since non-contraception-using females will spend a reasonable proportion of their reproductive lifespan frontally loaded [114]. Interestingly, pregnant women generally experience an increase in foot width rather than foot length, at least in terms of absolute foot size (Wall-Scheffler, un-published data). This finding here may have something specific to do with the stability during gait; by the postural and locomotor adjustments made to accommodate frontal load placement; as well as by therelaxation of tendons and ligaments during pregnancy [115]. When a load is placed on the front, the tendency is to lean backward in order to keep the center of mass in the midplane of the body [61]. This postural adjustment would reasonably cause a change in force distribution of the foot, resulting in the longer print. Additionally, frontal loads can cause shorter stride lengths and slower walking speeds [55]. Both of these factors resulted in increased contact time between the foot and the ground (usually because the body is working harder to generate the increased force necessary to perform a more challenging task) [86,116–118], and
Fig 3. The significantly different mass-specific footprint patterns of males and females.These figures are for unloaded walking at the medium (comfortable) speed, but the graphs and patterns are identical for all speed conditions. The p-values for the residuals of the sex differences of these relationships are p<0.04 for maximum foot length; p<0.04 for maximum foot width; p<0.02 for foot area.
doi:10.1371/journal.pone.0118619.g003
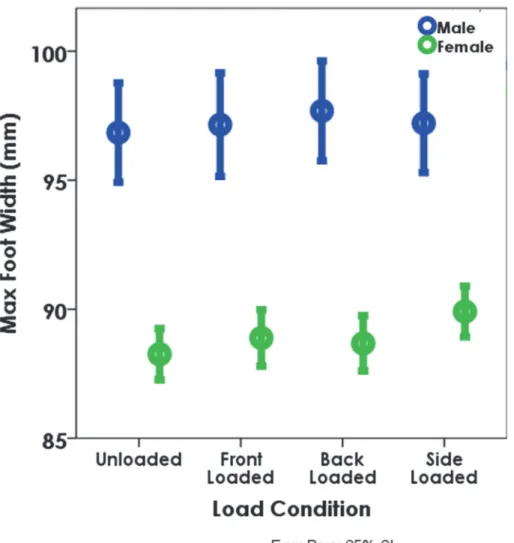
Fig 4. The increase in maximum foot length (MFL) at each of the loaded conditions by sex (all speeds combined).The circles denote the means and the error bars represent the 95% confidence intervals. MFL was consistent across all loading conditions for males. For females, the difference between the unloaded and front loaded condition is significant (p<0.01).
likely result from changes made to minimize instability [116], another possible contributing factor to the enlarged prints. If the foot is provide stabilizing support, its ability to act as a propulsive lever may require additional pronation changing the width of the footprint.
Fig 5. The increase in maximum foot width (MFW) at each of the loaded conditions by sex (all speeds combined).The circles denote the means and the error bars represent the 95% confidence intervals. The differences between the unloaded, and front and back loaded conditions are significant for both males and females at the slower speeds (p<0.05). MFW is also significantly larger for females between the unloaded and side loaded condition regardless of speed (p<0.05).
doi:10.1371/journal.pone.0118619.g005
Table 1. A summary of significant changes (p<0.05) to footprint size and stride length during loaded walking.
Speed Load
Maximum Foot Length (MFL) Increase Increase for Females
Maximum Foot Width (MFW) No change Increase for Males and Females
Foot Area (FA) Minimal change Increase for Females
Stride Length Increase Decrease for Males and Females
doi:10.1371/journal.pone.0118619.t001
Side loads have the largest effects on footprint shape, and are also one of the most common loading types among foraging populations [69–71,76], used for both offspring and foraging loads. Side loads have been shown to decrease the stability of walking due to the asymmetrical nature of the load [49,64] which is the likely cause of the footprint changes seen here. As with front loads, stride length can decrease with side loads and stride frequency will increase; addi-tionally, with side loads, the angle of the trunk away from the midline is higher than while un-loaded, and the trunk’s range of motion is greater—further supporting an idea of instability [64]; such instability may be potentially moderated by the footfall pattern [60] and lead to the wider footprints seen here, particularly among women. Back loads had minimal influence on footprint shape and may represent a loaded condition for which humans are well-suited [50,
57,119], though some kinematic changes with particularly large back loads have been noted [116].
Loads influence the footprints of both males and females but seem to have a particularly substantial effect on female footprint morphology. Since both sexes carried the same mass (20kg) but had significantly different body masses, it may have been possible that the task diffi-cultly drove the sex differences in foot morphology. However, the difference between the per-cent body masses of the load was small (4.5%) and footprint variation between the sexes exists even in the unloaded position (Fig. 3). Another factor instead may be foot composition and shape relative to other body proportions. Females have significantly shorter feet relative to both stature and lower limb length than males [120] (Table A inS1 Dataset). Because of this, females are placing a greater load (body plus load mass) on a relatively smaller surface area while walking, which may lead to the increased displacement of female foot area [60]. Addi-tionally, males have been shown to have stiffer heels [100] and significantly more relative lean mass (relative to total foot mass; Table A inS1 Dataset) than females who have significantly more relative fat mass (relative to total foot mass; Table B inS1 Dataset) in their feet. Thus the greater percentage of fat tissue in female feet and the smaller feet relative to stature would ren-der female feet more likely to unren-dergo deformation during walking.
The greater proportion of fat in female feet may be another contributing factor to the grow-ing body of evidence that females are efficient and economical load carriers [51,55,76,78,
121]. According to Zelik and Kuo [122], soft tissue deformation—particularly soft tissue like fat and ligamentous connective tissue—can actually do work (elastic tissue rebound) in addi-tion to saving muscles from having to actively dissipate energy. Zelik and Kuo [122] suggest then that fatty tissues are crucial both in cushioning impact and protecting damage and stress, as well as in performing work. Since females have more fatty tissue in their feet (and through-out their lower limb) and since this fatty tissue serves to conserve energy upon foot contact with the ground, female feet have an energetically efficient construction that may contribute to reduce the amount of energy spent when walking and/or carrying loads (along with other mor-phological adaptations; see [55]).
The following features thus indicate the importance of load carrying in hominin evolution, and the likelihood that the makers of fossilized footprint tracks were carrying loads: morpho-logical adaptations that allow females to effectively carry loads [49,55], the evidence that fe-males throughout the hominin lineage have been carrying (at least) their babies [48,50,84,
123], and the fact that female feet have an increased proportion of fatty tissue [100] (Table B in
S1 Dataset).
It should be noted that though significant, many of the changes in footprint size and shape fall within the percentage error of 1.7–14.5% noted by Dingwall et al. [33] that can occur based on substrate alone. Since it is clear that on a stable substrate footprint dimensions increase with loads, it possible that on an unstable or variable substrate footprint dimensions increase in a consistent and/or interactive manner, and perhaps to an even greater degree than shown here.
People running on sand show evidences of instability similar to those reviewed here for load carrying: including increased stance times and shorter stride lengths [124]. This suggests that kinematic and kinetic changes that elongate the footprint may be of even greater magnitude on variable substrate than the 1.7–14.5% suggested for unloaded walkers [33]. It will be helpful in the future to measure people carrying loads on varying substrates in order to better assess what differences are‘meaningful’to our reconstructions of the morphology and behavior of past populations. Ignoring the potential of substrate and load interactions to change the pattern of footprint dimensions leads to the possibility of erroneous conclusions about morphology and behavior.
Finally, we have suggested based on research comparing habitually shod and unshod walk-ers [99] that the differences seen here may be less than what would be seen in unshod walkers due to the increased foot compliance among habitually unshod walkers even though our load was heavy enough to have provided the stimulus for displacement [101]. Further work compar-ing the sexes in shod and unshod populations will hopefully illuminate whether these are in fact minimum changes.
Supporting Information
S1 Dataset. Contains the data, with methods and results, from DEXAs on 6 men and 20
women for the purpose of elucidating the sexual dimorphism of foot composition.This file
also contains Tables A and B. Table A, Mean Anthropometrics. Table B, Tissue Composition of Right Foot.
(DOCX)
S2 Dataset. Study Dataset contains the data used in the main analysis.
(XLS)
Acknowledgments
We are grateful to D. Moore and C. Hové for their assistance with data collection. D. Webb gave helpful comments on the pen and paper method for footprint analysis for which we are exceedingly appreciative. We are also thankful to all of our participants for their time and pa-tience. M.J. Myers, and the editors and reviewers of PLoS ONE gave numerous helpful com-ments that have greatly improved the paper. We are further very grateful to M.J. Myers for the use of her footprint DEXA data.
Author Contributions
Conceived and designed the experiments: CMWS EW. Performed the experiments: JW EW. Analyzed the data: CMWS. Contributed reagents/materials/analysis tools: CMWS EW. Wrote the paper: CMWS JW.
References
1. White TD, Asfaw B, Beyene Y, Haile-Selassie Y, Lovejoy CO, Suwa G, et al.Ardipithecus ramidus and the paleobiology of early hominids. Science. 2009; 326: 75–86. PMID:19810190
2. Berger LR, deRuiter DJ, Churchill SE, Schmid P, Carlson KJ, Dirks PHGM, et al.Australopithecus sediba: A new species ofHomo-like Australopith from South Africa. Science. 2010; 328: 195–204. doi:10.1126/science.1184944PMID:20378811
4. Schmid P. Mehr Funde-mehr Wissen? Zur Fundgeschichte und Interpretation der menschlichen Stammesgeschichte. Vierteljahrsschrift der Naturforschenden Gesellschaft in Zurich. 1986; 131(3): 145–160.
5. McHenry H. Body size and proportions in early hominids. Am J Phys Anthropol. 1992; 87: 407–431. PMID:1580350
6. Feldesman MR, Kleckner JG, Lundy JK. Femur/stature ratio and estimate of stature in mid- and late-Pleistocene fossil hominids. Am J Phys Anthropol. 1990; 83: 359–372. PMID:2252082
7. Feldesman MR, Lundy JK. Stature estimates for some African Plio-Pleistocene fossil hominids. J Hum Evol. 1988; 17: 583–596.
8. Jungers WL. Lucy's length: Stature reconstruction inAustralopithecus afarensis(AL 288–1) with impli-cations for other small-bodied hominids. Am J Phys Anthropol. 1988; 76: 227–231. PMID:3137822 9. Grine FE, Jungers WL, Tobias PV, Pearson OM. FossilHomofemur from Berg Aukas, northern
Na-mibia. Am J Phys Anthropol. 1995; 97(2): 151–185. PMID:7653506
10. Ruff CB, Scott WW, Liu AY-C. Articular and diaphyseal remodeling of the proximal femur with changes in body mass in adults. Am J Phys Anthropol. 1991; 86: 397–413. PMID:1746645 11. Jungers WL. New estimates of body size in australopithecines. In: Grine FE, editor. Evolutionary
his-tory of the 'robust' australopithecines. New York: Aldine de Gruyter; 1988. pp. 115–125.
12. Ruff CB. Body mass prediction from skeletal frame size in elite athletes. Am J Phys Anthropol. 2000; 113: 507–517. PMID:11102884
13. Auerbach BM, Ruff CB. Human body mass estimation: A comparison of morphometric and mechani-cal methods. Am J Phys Anthropol. 2004; 125: 331–342. PMID:15472894
14. McHenry HM. Sexual dimorphism inAustralopithecus afarensis. J Hum Evol. 1991; 20(1): 21–32.
15. Reno PL, McCollum MA, Meindl RS, Lovejoy CO. An enlarged postcranial sample confirms Australo-pithecus afarensisdimorphism was similar to modern humans. Philos Trans R Soc Lond B Biol Sci. 2010; 365: 3355–63. doi:10.1098/rstb.2010.0086PMID:20855309
16. Aiello L, Dean C. An Introduction to Human Evolutionary Anatomy. London: Elsevier Academic Press; 2002.
17. Lovejoy CO. The natural history of human gait and posture. Part 1: Spine and pelvis. Gait Posture. 2005; 21: 95–112. PMID:15536039
18. Lovejoy CO, Heiple KG, Burstein AH. Gait ofAustralopithecus. Am J Phys Anthropol. 1973; 38: 757–
779. PMID:4735528
19. Prost JH. Origin of bipedalism. Am J Phys Anthropol. 1980; 52: 175–189. PMID:6768307 20. Stern JT, Susman RL. The locomotor anatomy ofAustralopithecus afarensis. Am J Phys Anthropol.
1983; 60: 279–317. PMID:6405621
21. Leakey MD, Hay RL. Pliocene footprints in the Laetolil beds at Laetoli, northern Tanzania. Nature. 1979; 278: 317–323.
22. Bennett MR, Harris JWK, Richmond BG, Braun DR, Mbua E, Kiura P, et al. Early hominin foot mor-phology based on 1.5-million-year-old footprints from Ileret, Kenya. Science. 2009; 323: 1197–1201. doi:10.1126/science.1168132PMID:19251625
23. Meldrum DJ. Fossilized Hawaiian footprints comparied with Laetoli hominid footprints. In: Meldrum DJ, Hilton CE, editors. From Biped to Strider: The Emergence of Modern Human Walking, Running and Resource Transport. New York: Kluwer Academic/Plenum Publishers; 2004. pp. 63–83.
24. Kanchan T, Menezes RG, Moudgil R, Kaur R, Kotian JS, Garg RK. Stature estimation from foot di-mensions. Forensic Sci Int. 2008; 179: 241.e1–241.e5. doi:10.1016/j.forsciint.2008.04.029PMID:
18603388
25. Krishan K. Establishing correlation of footprints with body weight-forensic aspects. Forensic Sci Int. 2008; 179: 63–69. doi:10.1016/j.forsciint.2008.04.015PMID:18515026
26. Leakey MD. 3.6-million years old-footprints in the ashes of time. National Geographic. 1979; 155: 446–457.
27. Charteris J, Wall JC, Nottrodt JW. Functional reconstruction of gait from the Pliocene hominid foot-prints at Laetoli, northern Tanzania. Nature. 1981; 290: 496–498.
28. Charteris J, Wall JC, Nottrodt JW. Pliocene hominid gait: New interpretations based on available foot-print data from Laetoli. Am J Phys Anthropol. 1982; 58: 133–144. PMID:6810703
29. Jungers WL. Lucy's limbs: Skeletal allometry and locomotion inAustralopithecus afarensis. Nature. 1982; 297: 676–678.
30. Reynolds T. Stride length and its determinants in humans, early hominids, primates and mammals. Am J Phys Anthropol. 1987; 72: 101–115. PMID:3103457
31. Day MH, Wickens EH. Laetoli Pliocene hominid footprints and bipedalism. Nature. 1980; 286: 385–
387.
32. Susman RL, Stern JT, Jungers WL. Arboreality and bipedality in the Hadar hominids. Folia Primatol (Basel). 1984; 43: 113–156. PMID:6440837
33. Dingwall HL, Hatala KG, Wunderlich RE, Richmond BG. Hominin stature, body mass, and walking speed estimates based on 1.5 million-year-old footprints at Ileret, Kenya. J Hum Evol. 2013; 64(6): 556–568. doi:10.1016/j.jhevol.2013.02.004PMID:23522822
34. Pontzer H, Rolian C, Rightmire GP, Jashashvili T, Ponce de León MS, Lordkipanidze D, et al. Loco-motor anatomy and biomechanics of the Dmanisi hominins. J Hum Evol. 2010; 58: 492–504. doi:10. 1016/j.jhevol.2010.03.006PMID:20447679
35. Schmid P. Functional interpretation of the Laetoli footprints. In: Meldrum DJ, Hilton CE, editors. From Biped to Strider: The Emergence of Modern Human Walking, Running, and Resource Transport. New York: Kluwer Academic/Plenum Publishers; 2004. pp. 49–62.
36. Raichlen DA, Gordon AD, Harcourt-Smith WEH, Foster AD, Haas WR. Laetoli footprints preserve ear-liest direct evidence of human-like bipedal biomechanics. PLoS ONE. 2010; 5: e9769. doi:10.1371/ journal.pone.0009769PMID:20339543
37. White TD, Suwa G. Hominid footprints at Laetoli: Facts and interpretations. Am J Phys Anthropol. 1987; 72: 485–514. PMID:3111270
38. Leonard WR, Robertson ML. Comparative primate energetics and hominid evolution. Am J Phys Anthropol. 1997; 102: 265–281. PMID:9066904
39. Kramer PA. Modeling the locomotor energetics of extinct hominids. J Exp Biol. 1999; 202: 2807–
2818. PMID:10504316
40. Steudel K. Limb morphology, bipedal gait and the energetics of hominid locomotion. Am J Phys Anthropol. 1996; 99: 345–355. PMID:8967332
41. Steudel-Numbers K, Tilkens M. The effect of lower limb length on the energetic cost of locomotion: Im-plications for fossil hominins. J Hum Evol. 2004; 47(1–2): 95–109. PMID:15566947
42. Harriss JWK, Herbich L. Aspects of early Pleistocene hominid behaviour east of Lake Turkana, Kenya. In: Bishop WW, editor. Geological Background to Fossil Man. Edinburgh: Geological Society of London/Scottish Academic Press; 1978. pp. 529–548.
43. Leakey MD. Olduvai Gorge: Excavations in Beds I and 11. Vol. III, pages 1960–1963. Cambridge: Cambridge University Press;1971.
44. Ross C. Park or ride? Evolution of infant carrying in primates. Int J Primatol. 2001; 22(5): 749–771.
45. Alemseged Z, Spoor F, Kimbel WH, Bobe R, Geraads D, Reed D, et al. A juvenile early hominin skele-ton from Dikika, Ethiopia. Nature. 2006; 443: 296–301. PMID:16988704
46. Hay RL. Geology of the Olduvai Gorge. California: University of California Press;1976.
47. Isaac GL. Olorgesailie. Chicago: University of Chicago Press; 1977.
48. Rosenberg KR, Golinkoff RM, Zosh JM. Did australopithecines (or earlyHomo) sling? Behav Brain Sci. 2004; 27: 522.
49. Watson J, Payne R, Chamberlain A, Jones R, Sellers W. The kinematics of load carrying in humans and great apes: Implications for the evolution of human bipedalism. Folia Primatol (Basel). 2009; 80: 309–328. doi:10.1159/000258646PMID:19923843
50. Wall-Scheffler CM, Geiger K, Steudel-Numbers K. Infant carrying: The role of increased locomotory costs in early tool development. Am J Phys Anthropol. 2007; 133(2): 841–846. PMID:17427923 51. Hilton CE, Greaves RD. Age, sex and resource transport in Venezuelan foragers. In: Meldrum DJ,
Hil-ton CE, editors. From Biped to Strider: The Emergence of Modern Human Walking, Running and Re-source Transport. New York: Kluwer Academic/Plenum Publishers; 2004. pp. 163–181.
52. Wang W-J, Crompton RH. The role of load-carrying in the evolution of modern body proportions. J Anat. 2004; 204: 417–430. PMID:15198704
53. Potts R. Early Hominid Activities at Olduvai. New Brunswick: Transaction Publishers; 1988.
54. Filler AG. Emergence and optimization of upright posture among hominiform hominoids and the evo-lutionary pathophysiology of back pain. Neurosurgical Focus. 2007; 23(1): E4. PMID:17961059 55. Wall-Scheffler CM, Myers MJ. Reproductive costs for everyone: How female loads impact human
mo-bility strategies. J Hum Evol. 2013; 64(5): 448–456. doi:10.1016/j.jhevol.2013.01.014PMID:
23465336
57. Abe D, Yanagawa K, Niihata S. Effects of load carriage, load position and walking speed on energy cost of walking. Appl Ergon. 2004; 35: 329–335. PMID:15159197
58. Knapik JJ, Reynolds KL, Harman E. Soldier load carriage: Historical, physiological, biomechanical and medical aspects. Mil Med. 2004; 169(1): 45–56. PMID:14964502
59. Bastien GJ, Willems PA, Schepens B, Heglund NC. Effect of load and speed on the energetic cost of human walking. Eur J Appl Physiol. 2005; 94(1–2): 76–83.
60. Scott SH, Winter DA. Biomechanical model of the human foot: Kinematics and kinetics during the stance phase of walking. J Biomech. 1993; 26(9): 1091–1104. PMID:8408091
61. Garciaguirre JS, Adolph KE, Shrout PE. Baby carriage: Infants walking with loads. Child Dev. 2007; 78(2): 664–680. PMID:17381796
62. LaFiandra M, Wagenaar RC, Holt KG, Obusek JP. How do load carriage and walking speed influence trunk coordination and stride parameters? J Biomech. 2003; 36(1): 87–95. PMID:12485642 63. Chow DHK, Kwok MLY, Au-Yang ACK, Holmes AD, Cheng JCY, Yao FYD, et al. The effect of
back-pack load on the gait of normal adolescent girls. Ergonomics. 2005; 48(6): 642–656. PMID:
16087499
64. Pascoe DD, Pascoe DE, Wang YT, Shim D-M, Kim CK. Influence of carrying book bags on gait cycle and posture of youths. Ergonomics. 1997; 40(6): 631–641. PMID:9174414
65. Weijers RE, Walenkamp GHIM, van Mameren H, van den Hout JAAM. Changes of the soft tissue of the forefoot during loading: A volumetric study. The Foot. 2003; 13(2): 70–75.
66. Whiting J. Environmental constraints on infant care practices. In: Chasdi EH, editor. Culture and Human Development: The Selected Papers of John Whiting. Cambridge: Cambridge University Press; 1994. pp. 107–134.
67. Konner M. Hunter-gatherer infancy and childhood: The!Kung and others. In: Hewlett BS, Lamb ME, editors. Hunter-Gatherer Childhoods. New Brunswick: Aldine Transaction; 2005. pp. 19–64.
68. Harris LJ. Side biases for holding and carrying infants: Reports from the past and possible lessons for today. Laterality. 2010; 15(1/2): 56–135. doi:10.1080/13576500802584371PMID:19296365 69. Tanaka J. The San, Hunter-Gatherers of the Kalahari: A Study in Ecological Anthropology. Tokyo:
University of Tokyo Press;1980.
70. Lee RB. The!Kung San: Men, Women, and Work in a Foraging Society. Cambridge: Cambridge Uni-versity Press;1979.
71. Hurtado AM, Hawkes K, Hill K, Kaplan H. Female subsistence strategies among Ache hunter-gather-ers of Eastern Paraguay. Hum Ecol. 1985; 13(1): 1–28.
72. Maloiy GM, Heglund NC, Prager LM, Cavagna GA, Taylor CR. Energetic cost of carrying loads: Have African women discovered an economic way? Nature. 1986; 319(6055): 668–669. PMID:3951538 73. Panter-Brick C. The energy cost of common tasks in rural Nepal: Levels of energy expenditure
com-patible with sustained physical activity. Eur J Appl Physiol. 1992; 64: 477–484. PMID:1612091 74. National Geographic Society US, Agland P,Baka:People of the Forest. 1988, National Geographic
Society: Washington.
75. Lupo KD. What explains the carcass field processing and transport decisions of contemporary hunter-gatherers? Journal of Archaeological Method and Theory. 2006; 13(1): 19–66.
76. Hilton CE.Comparative Locomotor Kinesiology in Two Contemporary Hominid Groups:Sedentary Americans and Mobile Venezuelan Foragers. 1997, PhD Dissertation, University of New Mexico: New Mexico.
77. Hilton CE, Greaves RD. Seasonality and sex differences in travel distance and resource transport in Venezuelan foragers. Curr Anthropol. 2008; 49(1): 144–153.
78. Wall-Scheffler CM. Energetics, locomotion and female reproduction: Implications for human evolution. Annu Rev Anthropol. 2012; 41: 71–85.
79. Hawkes K, O'Connell JF, Blurton Jones NG. Hadza women's time allocation, offspring provisioning, and the evolution of long postmenopausal life spans. Curr Anthropol. 1997; 38: 551–577.
80. Bentley GR. Hunter-gatherer energetics and fertility: A reassessment of the!Kung San. Hum Ecol. 1985; 13: 79–109.
81. Brightman R. The sexual division of foraging labor: Biology, taboo, and gender politics. Comp Stud Soc Hist. 1996; 38(4): 687–729.
82. Lloyd R, Parr B, Davies S, Cooke C. Subjective perceptions of load carriage on the head and back in Xhosa women. Appl Ergon. 2010; 41: 522–529. doi:10.1016/j.apergo.2009.11.001PMID:19926071
83. Marlowe FW. Central place provisioning: The Hadza as an example. In: Hohmann G, Robbins M, Boesch C, editors. Feeding Ecology in Apes and Other Primates. Cambridge: Cambridge University Press; 2006. pp. 359–377.
84. Kramer PA. The costs of human locomotion: Maternal investment in child transport. Am J Phys Anthropol. 1998; 107: 71–85. PMID:9740302
85. Kramer PA. The behavioral ecology of locomotion. In: Meldrum DJ, Hilton CE, editors. From Biped to Strider: The Emergence of Modern Human Walking, Running and Resource Transport. New York: Plenum Publishers; 2004. pp. 101–115.
86. Griffin TM, Roberts TJ, Kram R. Metabolic cost of generating muscular force in human walking: In-sights from load-carrying and speed experiments. J Appl Physiol. 2003; 95: 172–183. PMID:
12794096
87. Hatala KG, Dingwall HL, Wunderlich RE, Richmond BG. The relationship between plantar pressure and footprint shape. J Hum Evol. 2013; 65(1): 21–28. doi:10.1016/j.jhevol.2013.03.009PMID:
23725794
88. Hawkes K, O'Connell JF, Blurton Jones NG. Hunting and nuclear families: Some lessons from the Hadza about men's work. Curr Anthropol. 2001; 42(5): 681–709.
89. O'Connell JF, Hawkes K, Blurton Jones NG. Hadza scavenging: Implications for Plio-Pleistocene hominid subsistence. Curr Anthropol. 1988; 29: 356–363.
90. Zeanah DW. Sexual division of labor and central place foraging: A model for the Carson Desert of western Nevada. J Anthropol Archaeol. 2004; 23: 1–32.
91. Blurton Jones NG, Hawkes K, Draper P. Foraging returns of!Kung adults and children: Why didn't !Kung children forage? J Anthropol Res. 1994; 50: 217–248.
92. Blurton Jones N, Hawkes K, O'Connell JF. Modelling and measuring costs of children in two foraging societies. In: Standen V, Foley RA, editors. The Behavioural Ecology of Humans and Other Mammals. Oxford: Blackwell Scientific Publications; 1989. pp. 367–390.
93. Konner M. Hunter-gatherer infancy and childhood: The !Kung and others. In: Hewlett BS, Lamb ME, editors. Hunter-Gatherer Childhoods: Evolutionary, Developmental & Cultural Perspectives. New Brunswick: Aldine Transaction; 2005. pp. 19–64.
94. Racic V, Pavic A, Brownjohn JMW. Experimental identification and analytical modelling of human walking forces: Literature review. Journal of Sound and Vibration. 2009; 326: 1–49.
95. McVea DA, Pearson KG. Contextual learning and obstacle memory in the walking cat. Integr. Comp. Biol. 2007; 47(4): 457–464. doi:10.1093/icb/icm053PMID:21672854
96. Boening D. Evaluation of a clinical method of gait analysis. Phys Ther. 1977; 57(795–798). PMID:
877147
97. Webb D, Bratsch S. Bipedalism: practice and experience in carrying a heavy unilateral load. Am J Phys Anthropol. 2011; 52: 307.
98. McDonough AL, Batavia M, Chen FC, Kwon S, Ziai J. The validity and reliability of the GAITRite sys-tem's measurements: A preliminary evalution. Archives of Physical Medicine and Rehabilitation. 2001; 82: 419–425. PMID:11245768
99. D'Août K, Pataky TC, De Clercq D, Aerts P. The effects of habitual footwear use: Foot shape and func-tion in native barefoot walkers. Footwear Science. 2009; 1(2): 81–94.
100. Alcantara E, Forner A, Ferrus E, Garcia AC, Ramiro J. Influence of age, gender and obesity on the mechanical properties of the heel pad under walking impact conditions. J Appl Biomech. 2002; 18: 345–356.
101. Tong J, Lim CS, Goh OL. Technique to study the biomechanical properties of the human calcaneal heel pad. The Foot. 2003; 13(2): 83–91.
102. Goodman MJ, Griffin PB, Estioko-Griffin AA, Grove JS. The compatibility of hunting and mothering among the Agta hunter-gatherers of the Philippines. Sex Roles. 1985; 12(11/12): 1199–1209.
103. Wall-Scheffler CM. Size and shape: Morphology's impact on human speed and mobility. J Anthropol. 2012; 2012: 1–9.
104. Naples VL, Miller JS. Making trackes: The forensic analysis of footprints and footwear impressions. The Anatomical Record Part B: The New Anatomist. 2004; 279: 9–15. PMID:15278937
105. Tuttle RH. Footprints in hominid evolution and forensics: lessons and limitations. Ichnos-An Interna-tional Journal for Plant and Animal Traces. 2008; 15: 158–164.
106. Ogg HL. Measuring and evaluation of gait patterns of children. Phys Ther. 1963; 43: 717–720. PMID:
14046437
108. DeSilva JM, Gill SV. Brief Communication: A midtarsal (midfoot) break in the human foot. Am J Phys Anthropol. 2013; 151: 495–499. doi:10.1002/ajpa.22287PMID:23686391
109. Brown LA, Polych MA, Doan JB. The effect of anxiety on the regulation of upright standing among younger and older adults. Gait Posture. 2006; 24(4): 397–405. PMID:17055728
110. Brown LA, Doan JB, McKenzie NC, Cooper SA. Anxiety-mediated gait adaptations reduce errors of obstacle negotiation among younger and older adults: Implications for fall risk. Gait Posture. 2006; 24(4): 418–423. PMID:16420978
111. Witana CP, Xiong S, Zhao J, Goonetilleke RS. Foot measurements from three-dimensional scans: A comparison and evaluation of different methods. Int J Ind Ergo. 2006; 36: 789–807.
112. Chumanov ES, Wall-Scheffler CM, Heiderscheit BC. Gender differences in walking and running on level and inclined surfaces. Clin Biomech. 2008; 23(10): 1260–1268. doi:10.1016/j.clinbiomech. 2008.07.011PMID:18774631
113. Wall-Scheffler CM, Chumanov ES, Steudel-Numbers K, Heiderscheit BC. EMG activity across gait and incline: The impact of muscular activity on human morphology. Am J Phys Anthropol. 2010; 143(4): 601–611. doi:10.1002/ajpa.21356PMID:20623603
114. Aiello LC, Key C. Energetic consequences of being aHomo erectusfemale. Am J Hum Biol. 2002; 14: 551–565. PMID:12203811
115. Whitcome KK, Shapiro LJ, Lieberman DE. Fetal load and the evolution of lumbar lordosis in bipedal hominins. Nature. 2007; 450(7172): 1075–1078. PMID:18075592
116. Demura T, Demura S. Relationship among gait parameters while walking with varying loads. J Physiol Anthropol. 2010; 29: 29–34. PMID:20453431
117. Taylor AJ, Menz HB, Keenan A-M. Effects of experimentally induced plantar insensitivity on forces and pressures under the foot during normal walking. Gait Posture. 2004; 20(3): 232–237. PMID:
15531169
118. Ghori GM, Luckwill RG. Responses of the lower limb to load carrying in walking man. Eur J Appl Phy-siol. 1985; 54: 145–150.
119. Abe D, Muraki S, Yasukouchi A. Ergonomic effects of load carriage on the upper and lower back on metabolic energy cost of walking. Appl Ergon. 2008; 39: 392–398. PMID:17850760
120. Fessler DMT, Haley KJ, Lal RD. Sexual dimorphism in foot length proportionate to stature. Ann Hum Biol. 2005; 32(1): 44–59. PMID:15788354
121. Wall-Scheffler CM, Myers MJ. Is female morphology selected for economy and male morphology se-lected for efficiency? Evidence from studies on humans. Am J Phys Anthropol. 2012; 54: 296.
122. Zelik KE, Kuo AD. Human walking isn't all hard work: evidence of soft tissue contributions to energy dissipation and return. J Exp Biol. 2010; 213(24): 4257–64. doi:10.1242/jeb.044297PMID:
21113007
123. Watson JC, Payne RC, Chamberlain AT, Jones RK, Sellers WI. The energetic costs of load-carrying and the evolution of bipedalism. J Hum Evol. 2008; 54(5): 675–683. PMID:18023469
124. Pinnington HC, Lloyd DG, Besier TF, Dawson B. Kinematic and electromyography analysis of sub-maximal diferences running on a firm surface compared with soft, dry sand. Eur J Appl Physiol. 2005; 94: 242–253. PMID:15815938