ISSN 1549-3644
© 2009 Science Publications
Corresponding Author: Alireza Bahiraie, Institute for Mathematical Research, University Putra Malaysia, 43400 Serdang, Selangor, Malaysia Tel: (+60)-19-2203709
Robust Logistic Regression to Static Geometric Representation of Ratios
1
Alireza Bahiraie,
2Noor Akma Ibrahim,
3A.K.M. Azhar and
4Ismail Bin Mohd
1,2
Institute for Mathematical Research, University Putra Malaysia,
43400 Serdang, Selangor, Malaysia
3
Graduate School of Management, University Putra Malaysia,
43400 Serdang, Selangor, Malaysia
4
Department of Mathematics, Faculty of Science,
University Malaysia Terengganu, 21030, Malaysia
Abstract: Problem statement: Some methodological problems concerning financial ratios such as non-proportionality, non-asymetricity, non-salacity were solved in this study and we presented a complementary technique for empirical analysis of financial ratios and bankruptcy risk. This new method would be a general methodological guideline associated with financial data and bankruptcy risk. Approach: We proposed the use of a new measure of risk, the Share Risk (SR) measure. We provided evidence of the extent to which changes in values of this index are associated with changes in each axis values and how this may alter our economic interpretation of changes in the patterns and directions. Our simple methodology provided a geometric illustration of the new proposed risk measure and transformation behavior. This study also employed Robust logit method, which extends the logit model by considering outlier. Results: Results showed new SR method obtained better numerical results in compare to common ratios approach. With respect to accuracy results, Logistic and Robust Logistic Regression Analysis illustrated that this new transformation (SR) produced more accurate prediction statistically and can be used as an alternative for common ratios. Additionally, robust logit model outperforms logit model in both approaches and was substantially superior to the logit method in predictions to assess sample forecast performances and regressions. Conclusion/Recommendations: This study presented a new perspective on the study of firm financial statement and bankruptcy. In this study, a new dimension to risk measurement and data representation with the advent of the Share Risk method (SR) was proposed. With respect to forecast results, robust loigt method was substantially superior to the logit method. It was strongly suggested the use of SR methodology for ratio analysis, which provided a conceptual and complimentary methodological solution to many problems associated with the use of ratios. Respectively, robust logit regression can be employed as a tool of regression in providing regression for studies associated with financial data.
Key words: financial ratios, risk box, bankruptcy, logit, Robust logit
INTRODUCTION
In recent decades, business failure prediction has been one of the major research domains in financial researches to evaluate the financial health of companies[14]. It is obvious that Bankruptcy involves large costs and corporate failure prediction has been stimulated both by private and government sectors all over the world[9]. Moreover, company failure may inflict negative shocks for each of the shareholders, thus the total cost of failure will be large regarding to economic and social costs[25]. Besides, bankruptcy prediction models have been proven necessary to obtain
a more accurate statement of firm’s financial situation[18].
significant effect on bankruptcy risk, return, credit risk, commercial risk, market and economic conditions [27]. While attempts have been made to solve problems of using accounting-based financial ratios, none has been entirely successfully developed in quantitative and objective systems for bankruptcy prediction[2]. Some attempts included trimming the sample ratios, eliminating negative observations and use of various transformations such as logarithms and square roots to achieve more normal distributions[8]. However, most of these attempts have utilized use of common ratios, which may exceeded cost of errors in the analysis and problem of miss-specification[4,6].
Some researchers made correction for univariate non-normality and tried to approximate univariate normality by transforming the variables prior to estimation of their model. Deakin[10] used logarithmic transformation for the lack of normality for distributions and other study used square root and lognormal transformation of financial ratios[13]. However, logarithmic and square root transformation may also be arbitrary[26]. The rank transformation used by Kane et al.[17] reported improvement in fit and less biased results by linear models with transformed data set. Logarithmic and rank transformations and square roots are even more difficult to interpret because they can alter the natural monotonic relationships among data[8,21]. There are many methods to estimate the probability of bankruptcy but none of them have taken the outliers into account when there is a discrete dependent variable. Outliers, which can seriously distort the estimated results, have been well-documented regression model[11]. Although methods and applications that take outliers into account are well known when the dependent variables are continuous[22,24], few have conducted empirical studies when the dependent variable is binary. Atkinson and Riani[3], Flores and Garrido[12] have developed the theoretical foundations as well as the algorithm to obtain consistent estimator in logit model with outliers, but they do not provide applied studies.
There is no general guideline concerning the appropriate data representation, which is able to solve ratio difficulties. Respectively there is a need of regression method application in order to consider outliers. Furthermore, none of the previous attempts had perfect prediction in the functional form. While all of procedures utilizing the use of common ratios without considering numerator and denominator of each ratio in specific, which are the most essential factor concerning each ratio value.
Our first objective in this study is to propose a new approach, which involves data representation, followed
by illustrating the use of this methodology for measuring financial risk in ratio analysis and prediction bankruptcies. The second aim of this study is to predict bankruptcy probability with the consideration of outliers. We developed the method used by Atkinson and Riani[3]. According to literature, present study is the first one that using the Robust logit model for financial data and bankruptcy predictions.
MATERIALS AND METHODS
Review of statistical methods of prediction: The methods of Rousseew[22,23] such as Least Median of Squares (LMS), Least Trimmed Squares (LTS) are now standard options in many econometric soft wares. The literature, however, is slow in the consideration of outliers when the logit model is involved till 1990. Furthermore, all developments are on the theoretical derivations of outliers in logit method and there is a lack in applications of financial fields.
Since Altman[1], MDA is a prevalent technique in bankruptcy prediction in terms of classification or prediction ability among traditional models[5]. Some studies have found logit model superior to MDA[15]. However, the research by Aziz and Dar[5], has shown that the two models are equally efficient. Robust statistics provides an alternative approach to classical statistical methods. Robust methods provide automatic ways of detecting, down weighting (or removing) and flagging outliers, largely removing the need for manual screening. A robust statistic is resistant to errors in the results produced by deviations from assumptions. The median is a robust measure of central tendency, while the mean is not; for instance, the median has a breakdown point of 50%, while the mean has a breakdown point of 0%[20]. The median absolute deviation and inter quartile range are robust measures of statistical dispersion, while the standard deviation and range are not[16].
Robust regression: The Robust Library in S-Plus software enables us to robustly fit Generalized Linear Models (GLIM’s) for response observations yi, = i = 1, 2…, n, that may follow one of the Poisson or Binomial distributions. The Binomial Distribution is
(n j) i j j i
i i i
n
P(y j) (1 )
j
−
= = µ − µ
for j=0,1,...ni where
i
0≤ µ ≤1and ni is the number of binomial trials for observation yi. When ni = 1, the observations are called yi Bernoulli trials. The expected value of yi for the Binomial distribution is related to µi by i
i i y E
n = µ
.
Then we have a vector T
i i1, i 2 ip
independent explanatory variables and corresponding vector T
1, 2 p ( ,..., )
β = β β β of unknown regression
coefficients, from which software form the linear predictor T
i
x
η = β. The linear predictor η and the expected value µi are related through the link function g which maps µi to η = g(µi) The inverse link transformation g−1 maps η to µI = g−1(η).
Following binomial model canonical link (the logit
link), we have i
i
i
g( ) log 1
µ η = µ =
− µ
which 0< µ <i 1
with inverse transformation 1 i
exp( ) g ( ) log
1 exp( )
− η
µ = η =
+ η
which−∞ < η < +∞.
For the Binomial model, is conditional expectation is:
T i
i i i i i T
i
exp(x )
E (y x n n
1 exp(x ) β
β = × µ =
+ β
In the Bernoulli distributions, the response yi is either 0 or 1 and so cannot be an outlier. In the general Binomial model when ni is large, the yi can also be outliers in cases where the expected values of yi
n are small. Thus, in the general Binomial cases, influential yi outliers need for a robust alternative to the MLE.
Regarding misclassification results which are important in our research we used misclassification model approach to estimate βi instead of Cubif or Mallows approaches, as a solution of the estimating equation:
n
mc T
i i i i
i 1
w .x .(y F(x , )) 0 =
− β γ =
∑
The mis-classification model gives F:
1 T 1 T T
i i i i i
P(y =1, x )=g (x− β + γ × −) 1 2g (x− β =) F(x β γ, )
with g−1. This estimator, introduced by Rousseeuw[24] has properties similar to those of the Mallows-type unbiased bounded influence estimates.
The share risk box methodology: The framework is a two-dimensional box in which associated with ratio values in which pair values of each risk ratios (Xi, Yi) are represented as Cartesian coordinates. For expositional purposes suppose our proxy for risk chosen is employed by Xi as numerator and Yi as denominator values of i
i
X
Y ratio. For any number of
firms, ∀ =i 1, 2,3,..., n, proposed Share Risk (SRi) is
defined as a function of Xi and Yi. Consider a square two-dimensional space that captures all changes in numerator Xi and denominator Yi, for any firm i and any period t where X and Y can be positive, negative or zero (It is applicable to any level of aggregation such as cross-country studies, cross sector and ratios). Assume a hypothetical study of risk covering n years for sector j. For ∀ =t 1, 2,3,..., n, we have: Xt, Yt > 0. All risk components measure indices such as, Total Risk TR = X + Y, Net Risk NR |X-Y|, Overlapping Risk OR = (X + Y)-|X-Y| and lastly the proposed Share Measure of Risk (SR) as we define below, are linear functions of X and Y which X + Y = TR = NR + OR:
OR (X Y) | X Y | 2 min(X, Y) SR
TR (X Y) (X Y)
+ − −
= = =
+ +
Following Bahiraie et al.[6], we can construct a two dimensional box that encapsulates all of these variables for n years. The dimensions of the risk box are generated by the maximum value of either Xi and Yi value during the period of study. From the definition of TR, NR, OR, SR, we obtain:
(
)
ii i i i i
i i
i i i
max(NR ) max(| X Y |) max(max X min Y , max Y min X ) m
max(OR ) 2 max (min(X ,Y ) 2m max SR 1
= − ≤ −
− ≤
= ≤ ⇒ ≤
Each respective risk box will have sides equal to max(Xi) if for i∈t then max(Xi) > max(Yi) or max(Yi) if otherwise. Our exposition of the dimensions of the box is as follows which confirms the elasticity and unit-free nature of SR measure:
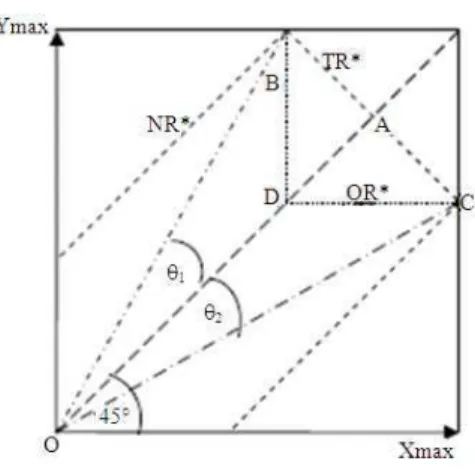
Fig. 1: Share risk box isoclines
Locus of equi NR: Recall that Net Risk NR = |X-Y|. The line 45° can be regarded as the contour of the value NR* = 0. For positive value NR*>0, we have below the central 45° line, Y-X = NR* so X = Y-NR*, which also slopes upward at 45°, meeting the (horizontal) Y axis at NR*. Above the 45° line through the origin we have another segment of same contour, namely the line X-Y = NR* or X = Y + NR*. These two 45° lines from the contour are corresponding to NR*. Increasing the value of constant NR* moves both segments higher up their respective axis, away from the central NR* line. Comparing with y = mx + c, we have for a net book value, m = 1 with a vertical intercept c = NR. Since the central line balanced is the axis of symmetry for NR, m = 1 and c = NR (Fig. 1). Consequently, locus of equi NR values is perpendicular to lines of equi TR
TR NR
1 m
m
−
=
.
Locus of equi OR: Considering overlapping risk OR = 2 min (X, Y), below the central 45° line, OR = 2X that remains constant for constant X. Above the line OR = 2Y which remains constant for constant Y. Thus the equi corresponding to constant overlapping risk OR* is L-shaped (Fig. 1), the kink occurring along the central 45° line. As OR* increases, the kink moves up the line, away from the origin.
Locus of equi SR: Considering our proposed unit-free
share measure of riskSR 2 min X, Y
(
)
X Y
=
+ , the followings are obtained:
• Below the line 45°, Y > X and thusSR 2X
X Y
= + . The equi corresponding to a constant value SR* is
defined by the relation SR*(X+Y) = 2X, which can be solved for X to yieldX SR * Y
2 SR * =
− . Thus, this segment of the equi is a ray from the origin with constant slope SR *
2 SR * γ =
− . Since 0≤SR≤1, we have0≤ ≤γ 1, showing that the ray passes between the central 450 line and the horizontal axis
• Above the central 45° line on the other hand we haveSR 2Y
X Y
=
+ . Given a constant value SR* we obtain X = γ−1Y, which γ−1 satisfies 1 ≤γ−1 < ∞ Thus the equi corresponding to a particular value SR* consists of two rays in the positive quadrant meeting at the origin, with slopes γ and γ−1. In Fig. 1 these rays are shown as OC and OB. Note that the symmetry of the diagram about the central 45° line implies that the angles θ1 and θ2 are equal.
Geometry of SR and risk box: In Fig. 1, relationships between the four risk measures and slopes γ and γ−1, consider rays OB and OC subtending the angles θ1, θ2 measured from the symmetry axis. Let A, B, C and D represent points on the risk plane with A, B and C sharing equal total risk values, TR*. In addition, B, C and D share equal OR values, OR*:
OA = TR* And
denf
TR * OR *− = NR*=AB
Hence:
denf
1
1
AB TR * OR * OR *
tan 1 1 SR *
OA TR * TR *
SR* 1 tan −
θ = = = − = −
⇒ = − θ
These will confirm that SR values are constant along any ray from origin and the two extreme case the two extreme cases are (i) θ1 = θ2 = 45°, in which case SR = 0 and either the Y value or X value is zero and (ii) θ1 = θ2 = 0°, in which case SR = 1 and X = Y.
Negative values will be transformed to specific variation, thus removing the necessity of deletion of negative data used in previous studies.
RESULTS
Data collection: The database used in our illustrative empirical study consists of 200 Iranian companies from Tehran Stock Exchange (TSE). Fifty companies went bankrupt under bankruptcy rule number 167 of Iranian companies’ law act 1965, which a firm is bankrupt when its total value of retained earning is equal or greater than 50% of its listed capital. 150 companies are "matched" companies from the same period of listing 1998-2005.
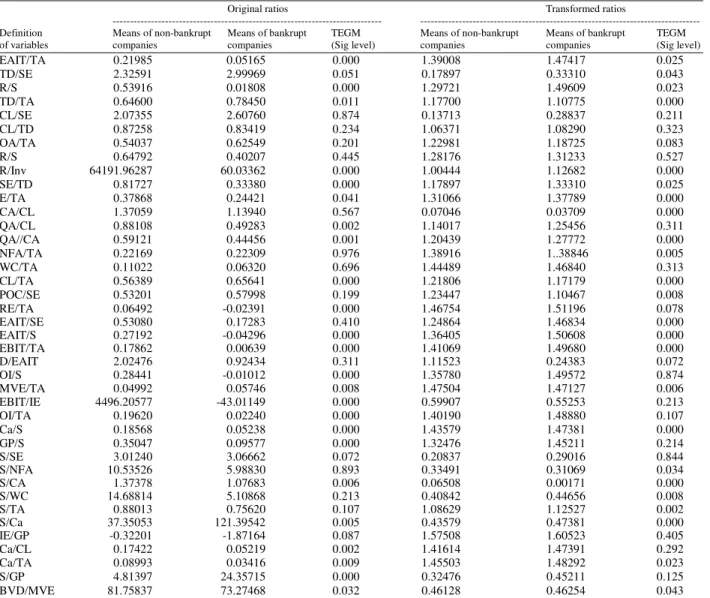
Indicator variables: Base on the financial ratios successfully identified by previous studies and availability, 40 indices been built by using balance-sheet data. Ratios and significances on mean differences for each group is tested and presented in Table 1. These indices reflect different aspects of firm structure and performance: Liquidity, turnover, operating structure and efficiency, capitalization and finally profitability. Bankrupt companies are indicated as 1 and non failed companies as 0. Thus, a firm will have a higher failure probability and will be classified into failing group if its score is higher than cut-off point in each approach.
Table 1: Variables used and comparison of means in two groups
Original ratios Transformed ratios
--- ---
Definition Means of non-bankrupt Means of bankrupt TEGM Means of non-bankrupt Means of bankrupt TEGM
of variables companies companies (Sig level) companies companies (Sig level)
EAIT/TA 0.21985 0.05165 0.000 1.39008 1.47417 0.025
TD/SE 2.32591 2.99969 0.051 0.17897 0.33310 0.043
R/S 0.53916 0.01808 0.000 1.29721 1.49609 0.023
TD/TA 0.64600 0.78450 0.011 1.17700 1.10775 0.000
CL/SE 2.07355 2.60760 0.874 0.13713 0.28837 0.211
CL/TD 0.87258 0.83419 0.234 1.06371 1.08290 0.323
OA/TA 0.54037 0.62549 0.201 1.22981 1.18725 0.083
R/S 0.64792 0.40207 0.445 1.28176 1.31233 0.527
R/Inv 64191.96287 60.03362 0.000 1.00444 1.12682 0.000
SE/TD 0.81727 0.33380 0.000 1.17897 1.33310 0.025
E/TA 0.37868 0.24421 0.041 1.31066 1.37789 0.000
CA/CL 1.37059 1.13940 0.567 0.07046 0.03709 0.000
QA/CL 0.88108 0.49283 0.002 1.14017 1.25456 0.311
QA//CA 0.59121 0.44456 0.001 1.20439 1.27772 0.000
NFA/TA 0.22169 0.22309 0.976 1.38916 1..38846 0.005
WC/TA 0.11022 0.06320 0.696 1.44489 1.46840 0.313
CL/TA 0.56389 0.65641 0.000 1.21806 1.17179 0.000
POC/SE 0.53201 0.57998 0.199 1.23447 1.10467 0.008
RE/TA 0.06492 -0.02391 0.000 1.46754 1.51196 0.078
EAIT/SE 0.53080 0.17283 0.410 1.24864 1.46834 0.000
EAIT/S 0.27192 -0.04296 0.000 1.36405 1.50608 0.000
EBIT/TA 0.17862 0.00639 0.000 1.41069 1.49680 0.000
D/EAIT 2.02476 0.92434 0.311 1.11523 0.24383 0.072
OI/S 0.28441 -0.01012 0.000 1.35780 1.49572 0.874
MVE/TA 0.04992 0.05746 0.008 1.47504 1.47127 0.006
EBIT/IE 4496.20577 -43.01149 0.000 0.59907 0.55253 0.213
OI/TA 0.19620 0.02240 0.000 1.40190 1.48880 0.107
Ca/S 0.18568 0.05238 0.000 1.43579 1.47381 0.000
GP/S 0.35047 0.09577 0.000 1.32476 1.45211 0.214
S/SE 3.01240 3.06662 0.072 0.20837 0.29016 0.844
S/NFA 10.53526 5.98830 0.893 0.33491 0.31069 0.034
S/CA 1.37378 1.07683 0.006 0.06508 0.00171 0.000
S/WC 14.68814 5.10868 0.213 0.40842 0.44656 0.008
S/TA 0.88013 0.75620 0.107 1.08629 1.12527 0.002
S/Ca 37.35053 121.39542 0.005 0.43579 0.47381 0.000
IE/GP -0.32201 -1.87164 0.087 1.57508 1.60523 0.405
Ca/CL 0.17422 0.05219 0.002 1.41614 1.47391 0.292
Ca/TA 0.08993 0.03416 0.009 1.45503 1.48292 0.023
S/GP 4.81397 24.35715 0.000 0.32476 0.45211 0.125
BVD/MVE 81.75837 73.27468 0.032 0.46128 0.46254 0.043
Table 2: Significant variables in each sample
Original ratios DRS method
CR/TA EBIT/S
QA/CA QA/CA
OI/TA TD/TA
CF/GP MVE/TA
SE/TA
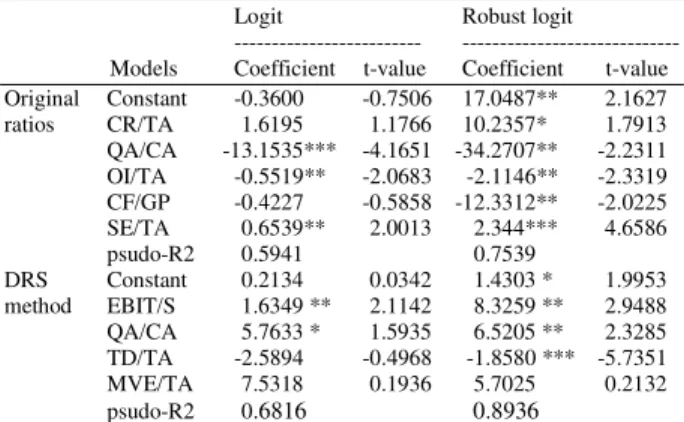
Table 3: Estimated Results for logit and Robust logit models
Logit Robust logit
--- --- Models Coefficient t-value Coefficient t-value Original Constant -0.3600 -0.7506 17.0487** 2.1627 ratios CR/TA 1.6195 1.1766 10.2357* 1.7913 QA/CA -13.1535*** -4.1651 -34.2707** -2.2311 OI/TA -0.5519** -2.0683 -2.1146** -2.3319 CF/GP -0.4227 -0.5858 -12.3312** -2.0225 SE/TA 0.6539** 2.0013 2.344*** 4.6586 psudo-R2 0.5941 0.7539
DRS Constant 0.2134 0.0342 1.4303 * 1.9953 method EBIT/S 1.6349 ** 2.1142 8.3259 ** 2.9488 QA/CA 5.7633 * 1.5935 6.5205 ** 2.3285 TD/TA -2.5894 -0.4968 -1.8580 *** -5.7351 MVE/TA 7.5318 0.1936 5.7025 0.2132 psudo-R2 0.6816 0.8936
*, ** and ***: Denote significant at 10, 5 and 1% level, respectively
Stepwise method: For primary variable selection and testing each variable’s effectiveness on discriminating power, CartProEx V.6.0 software with Mahalanobis D2 measure was used. Table 2 reports selected variables that produced greatest effectiveness on separation for each groups to have more stable and well-balanced model.
Regression analysis: We tested these selected variables using Logistic and Robust Logistic Regression Analysis to illustrate that this new transformation will produce more accurate prediction statistically and can be used as an alternative for common ratios. Results show that Robust logit model outperforms logit model in both data sets. Table 3 report the estimated results using the logit and the Robust logit models, respectively. When the logit model is used, less coefficients show are significant compare to Robust logit model. Alongside this, the psudo-R2 is higher for the Robust logit models in both approaches, suggesting that in-sample fitting is much better in the Robust logit model than in the logit model.
K-fold cross validation test: In order to observe the effects of biasness, we conduct the K-fold cross validation procedure. Each one of the subsets is then in turn as testing set after all other sets combined have been training set on which a tree has been built. This cross validation procedure allows mean error rates to be calculated which gives a useful insight into classifiers decision. This technique is simply k-fold cross validation whereby k is number of data instances.
Table 4: The transformed ratios still outperform original ratios
Original ratios DRS approach
--- ---
Items Logit (%) Robust logit (%) Logit (%) Robust logit (%)
1 57.23 69.30 66.15 82.27
2 56.17 69.73 65.48 82.13
3 57.94 68.61 63.74 82.51
4 57.29 70.52 66.03 81.94
5 57.71 69.89 66.34 82.72
Average 57.26 69.61 65.54 82.31
This has advantage of allowing the largest amount of training data to be used in each run and conversely means that the testing procedure is deterministic. In our experiment, we set our sample to 5-fold accuracy results. Table 4 shows the comparison of 5-fold accuracy results. Descriptive results highlighted the following evidences that under transformation process better classification accuracy results achieved while Robust logit model outperforms logit model.
DISCUSSION
In this study, a new dimension to risk measurement and data representation with the advent of the Share Risk method (SR) was proposed. We briefly derived the respective properties of new risk approach components of which can overcome using common ratios limitations. Our simple methodology provided a geometric illustration of the new proposed risk measure and transformation behavior. SR method can be applied equally to variety of distributional forms, thus making the technique particularly useful in ratio analysis where a diverse set of distributional functions have been identified. SR approach is naturally bounded and unaffected by distance between observations, outlier effect if present will be reduced. Similarly, distance data containing white noise and the sensitivity and power of statistical test are improved. Negative values will be transformed to specific variation, thus removing the necessity of deletion of negative data used in previous studies. Besides, proportionality is a theoretical assumption that may not in fact hold and the degree of departure varies across industries and size classes. We also compared the forecast ability between logit and Robust logit methods, where the latter consider the possible outliers. With respect to forecasts, Robust Loigt method is substantially superior to the logit method.
CONCLUSION
financial ratios may exceed cost of errors in analysis caused by ratio-related model mis-specification and in general, no equally convenient, or superior alternative to ratios has been developed and applied to financial ratio analysis.
This research was motivated to develop an alternative for ratio-based methodology for financial studies. The properties derived form described in our methodology may be general guidelines for ratios analysis, in which there is no arbitrary conditioning, because the numbers of transformations are equal the number of observations. According to proven properties of new SR method discussed in methodology and better numerical results obtained, it is strongly suggested the use of this new methodology for ratio analysis, which provided a conceptual and complimentary methodological solution to many problems associated with the use of ratios. Respectively, Robust logit regression can be employed as a tool of regression in providing regression for studies associated with financial data.
Since previous studies used one and two year prior to bankruptcy, consequently, generalize ability of model with expansion for an additional year is recommended for further studies. Furthermore, as reported by IMF, to undertake such research to understand the capital structures and other financial indicators such as macro and micro economic variables simultaneously that might be effect on firms’ performance and eventually can improve prediction is necessitate, therefore testing above model respect to this issue will be important to be continued.
REFERENCES
1. Altman, E.I., 1968. Financial ratios, discriminant analysis and the prediction of corporate bankruptcy. J. Finance, 23: 589-609. https://www4.infotrieve.com/neworders/Order_Cart.asp 2. Andres, J.D., M. Landajo and P. Lorca, 2005.
Forecasting business profitability by using classification techniques: A comparative analysis based on a Spanish case. Eur. J. Operat. Res., 167: 518-542.
http://cat.inist.fr/?aModele=afficheN&cpsidt=16947677 3. Atkinson, A.C. and M. Riani, 2001. Regression
diagnostics for binomial data from the forward search. Statistician, 50: 63-78.
http://cat.inist.fr/?aModele=afficheN&cpsidt=13556746 4. Azhar, A.K.M. and J.R. Elliott, 2006. On the
measurement of product quality in intra industry trade. Rev. World Econ., 142: 476-495. DOI: 10.1007/s10290-006-0077-5
5. Aziz, M.A. and H.A. Dar, 2006. Predicting corporate bankruptcy: Where we stand? Corporate
Governance, 6: 18-33. DOI:
10.1108/14720700610649436
6. Bahiraie, A.R., N.A. Ibrahim, M. Ismail and A.K.M. Azhar, 2008. Financial ratios: A new geometric transformation. Int. Res. J. Finance Econ., 20: 164-171.
http://www.eurojournals.com/irjfe_20_13.pdf 7. Beaver, W., 1966. Financial ratios for predictors of
failure. J. Account. Res., 3: 71-102. http://www.citeulike.org/user/pgeymueller/article/1 560516
8. Canbas, S., A. Cabuk and S.B. Kilic, 2004. Prediction of commercial bank failure via multivariate statistical analysis of financial structures: The Turkish case. Eur. J. Operat. Res., 166: 528-546.
http://cat.inist.fr/?aModele=afficheN&cpsidt=16742458 9. Charitu, A., Neophytou E. and Charalambous C.,
2004. Predicting corporate failure: Empirical evidence of the UK. Eur. Account. Rev., 13: 465-497. DOI: 10.1080/0963818042000216811
10. Deakin, E., 1976. On the nature of distribution of financial accounting ratios: Some empirical evidence. Account. Rev., 51: 90-97. http://www.jstor.org/pss/245375
11. Ezzamel, M. and C. Mar-Molinero, 1990. The distributional properties of financial ratios in UK manufacturing companies. J. Bus. Finance Account., 17: 1-29. DOI: 10.1111/j.1468-5957.1990.tb00547.x
12. Flores, E. and J. Garrido, 2001. Robust logistic regression for insurance risk classification. Business Economics Working Paper 01-64, No. 13. http://ideas.repec.org/p/cte/wbrepe/wb016413.html 13. Kenjegalieva, K., R. Simper, J.T. Weyman and V. Zelenyuk, 2009. Comparative analysis of banking production frameworks in eastern european financial markets. Eur J. Operat. Res., 198: 326-340. DOI: 10.1016/j.ejor.2008.09.002 14. Grice, J.S. and M.T. Dugan, 2001. The limitations
of bankruptcy prediction models: Some cautions for the researcher. Rev. Quant. Finance Account., 17: 151-166.
http://ideas.repec.org/a/kap/rqfnac/v17y2001i2p15 1-66.html
15. Gu, Z., 2002. Analyzing bankruptcy in restaurant industry: A multiple discriminant model. Hospital. Manage., 21: 25-42.
16. Huber, P., 1981. Robust Statistics. John Wiley and Sons, Canada,ISBN: 0471418056, pp: 308. 17. Kane, G. and N. Meade, 1998. Ratio Analysis
Using Rank Transformation. Rev. Quant. Finance Account., 10: 59-74.
DOI: 10.1023/A:1008248130384
18. Keasey, K. and Watson R., 1991. Financial distress models: A review of their usefulness. Br. J. Manage., 2: 89-102. DOI: 10.1111/j.1467-8551.1991.tb00019.x
19. Landskroner, Y., D. Ruthenberg and D. Pearl, 2006. Market to book value ratio in banking: The Israeli case. Bank of Israel banking, Supervision
Department, Research Unit.
http://www.bankisrael.gov.il/deptdata/pikuah/paper s/dp0606e.pdf
20. Maronna R., D. Martin and V. Yohai, 2006. Robust Statistics. 1st Edn., Wiley and Sons, New York, ISBN: 10: 0470010924, pp: 436.
21. Ooghe, H., C.H. Speanjers and P. Vandermoere, 2005. Business failure prediction: Simple-intuitive models versus statistical models. Working Paper, Vlerick Leuven Gent.
http://ideas.repec.org/p/rug/rugwps/05-338.html
22. Rousseeuw, P.J., 1990. Regression techniques with high breakdown point. J. Am Stat.Assoc.,85: 633-639. 23. Rousseeuw, P.J., 1984. Least median of squares
regression. J. Am. Stat. Assoc., 79: 871-880. http://cat.inist.fr/?aModele=afficheN&cpsidt=9031551 24. Rousseeuw P.J. and S. Verboven, 2002. Robust
estimation in very small samples Comp. Stat. Data Anal., 40: 741-758. DOI: 10.1016/S0167-9473(02)00078-6
25. Shumway, T., 2001. Forecasting bankruptcy more accurately: A simple hazard model. J. Bus., 74: 101-124.
http://www.journals.uchicago.edu/doi/pdf/10.1086/ 209665
26. So, S.J., 1987. Some empirical evidence on the outlier and non-normal distribution of financial ratios. J. Bus. Finance Account., 14: 483-496. DOI: 10.1111/j.1468-5957.1987.tb00108.x
27. Watson, C.J., 1990. Multivariate distribution properties, outliers and transformation of financial ratios. Account. Rev., 65: 682-695.