ACPD
10, 25991–26044, 2010Atmospheric aerosol particles over the
Eastern Mediterranean
M. Stock et al.
Title Page
Abstract Introduction
Conclusions References
Tables Figures
◭ ◮
◭ ◮
Back Close
Full Screen / Esc
Printer-friendly Version Interactive Discussion
Discussion
P
a
per
|
Dis
cussion
P
a
per
|
Discussion
P
a
per
|
Discussio
n
P
a
per
|
Atmos. Chem. Phys. Discuss., 10, 25991–26044, 2010 www.atmos-chem-phys-discuss.net/10/25991/2010/ doi:10.5194/acpd-10-25991-2010
© Author(s) 2010. CC Attribution 3.0 License.
Atmospheric Chemistry and Physics Discussions
This discussion paper is/has been under review for the journal Atmospheric Chemistry and Physics (ACP). Please refer to the corresponding final paper in ACP if available.
Hygroscopic properties of atmospheric
aerosol particles over the Eastern
Mediterranean: implications for regional
direct radiative forcing under clean and
polluted conditions
M. Stock1, Y. F. Cheng1,*, W. Birmili1, A. Massling1,**, B. Wehner1, T. M ¨uller1,
S. Leinert2, N. Kalivitis3, N. Mihalopoulos3, and A. Wiedensohler1
1
Leibniz Institute for Tropospheric Research, Leipzig, Germany
2
Environmental Protection Agency, Dublin 14, Ireland
3
Environmental Chemical Processes Laboratory, University of Crete, Heraklion, Greece
*
now at: Center of Global and Regional Environment Research, Univ. of Iowa, Iowa City, USA
**
now at: National Environmental Research Institute, Aarhus University, Roskilde, Denmark Received: 14 October 2010 – Accepted: 25 October 2010 – Published: 3 November 2010 Correspondence to: W. Birmili ([email protected])
ACPD
10, 25991–26044, 2010Atmospheric aerosol particles over the
Eastern Mediterranean
M. Stock et al.
Title Page
Abstract Introduction
Conclusions References
Tables Figures
◭ ◮
◭ ◮
Back Close
Full Screen / Esc
Printer-friendly Version Interactive Discussion
Discussion
P
a
per
|
Dis
cussion
P
a
per
|
Discussion
P
a
per
|
Discussio
n
P
a
per
|
Abstract
This work examines the effect of direct radiative forcing of aerosols in the eastern Mediterranean troposphere as a function of air mass composition, particle size dis-tribution and hygroscopicity, and relative humidity (RH). During intensive field mea-surements on the island of Crete, Greece, the hygroscopic properties of atmospheric
5
particles were determined using a Hygroscopicity Tandem Differential Mobility Analyzer (H-TDMA) and a Hygroscopicity Differential Mobility Analyzer – Aerodynamic Particle Sizer (H-DMA-APS). Like in several studies before, the H-TDMA identified three hygro-scopic sub-fractions of particles in the sub-µm range: a more hygrohygro-scopic group, a less hygroscopic group and a nearly hydrophobic particle group. The hygroscopic particle
10
growth factors at 90% RH were a significant function of particle mobility diameter (Dp):
1.42 (±0.05) at 30 nm compared to 1.63 (±0.07) at 250 nm. The H-DMA-APS identified up to three hygroscopic sub-fractions at mobility diameters of 1.0 and 1.2 µm. All data recorded between 12 August and 20 October, 2005 were classified into four distinct synoptic-scale air mass types distinguishing between different regions of origin
(west-15
ern Mediterranean vs. the Aegean Sea) as well as the degree of continental pollution (marine vs. continentally influenced). The hygroscopic properties of particles with di-ameterDp≥150 nm showed the most pronounced dependency on air mass origin, with
growth factors in marine air masses exceeding those in more continentally influenced air masses. Particle size distributions and hygroscopic growth factors were employed
20
to calculate aerosol light scattering coefficients at ambient RH using a Mie model. A main result was the pronounced enhancement of particle scattering over the eastern Mediterranean due to hygroscopic growth, both in the marine and continentally influ-enced air masses. When RH reached its daytime values around 70–80% in summer, up to 50–70% of the calculated visibility reduction was due to the hygroscopic growth
25
ACPD
10, 25991–26044, 2010Atmospheric aerosol particles over the
Eastern Mediterranean
M. Stock et al.
Title Page
Abstract Introduction
Conclusions References
Tables Figures
◭ ◮
◭ ◮
Back Close
Full Screen / Esc
Printer-friendly Version Interactive Discussion
Discussion
P
a
per
|
Dis
cussion
P
a
per
|
Discussion
P
a
per
|
Discussio
n
P
a
per
|
The radiative forcing ∆Fr was, nevertheless, dominated by the total aerosol
concen-tration most of the time: ∆Fr was typically more negative for continentally influenced
aerosols (ca.−4 W m−2) compared to rather clean marine aerosols (ca. −1.5 W m−2). When RH occasionally reached 90% in marine air, ∆Fr even reached values down
to−7 W m−2. Our results emphasize, on the basis of explicit particle hygroscopicity
5
measurements, the relevance of ambient relative humidity for the radiative forcing of regional atmospheres.
1 Introduction
In the accretive discussion on global climate change, atmospheric particles (aerosols) have been identified as a key uncertainty with respect to the global radiative balance
10
(IPCC, 2007). Particles influence climate directly by scattering and absorbing solar ra-diation (Haywood and Boucher, 2000) and indirectly through their ability to act as cloud condensation nuclei (CCN), (Twomey, 1977; Ogren and Charlson, 1992). A sufficient knowledge of the microphysical properties of aerosol particles as well as the spatial distribution is a key to evaluate their effect on global climate. Experimental data, in
15
particular, are necessary as input and validation parameters for global climate mod-els, which assess the role of aerosols in future scenarios of global warming or cooling (Grant et al., 1999).
The hygroscopic growth behaviour of aerosol particles is one of the important pa-rameters controlling the direct and indirect climate effects. Atmospheric particles can
20
absorb water at relative humidities well below 100% depending on their chemical com-position. Due to water uptake aerosol particles change their size and their optical properties (Tang, 1996). While the hygroscopic growth of pure soluble ionic species is known relatively accurately (Tang and Munkelwitz, 1994; Brechtel and Kreidenweis, 2000), the growth of atmospheric organic matter (Gysel et al., 2004) or complex
mix-25
ACPD
10, 25991–26044, 2010Atmospheric aerosol particles over the
Eastern Mediterranean
M. Stock et al.
Title Page
Abstract Introduction
Conclusions References
Tables Figures
◭ ◮
◭ ◮
Back Close
Full Screen / Esc
Printer-friendly Version Interactive Discussion
Discussion
P
a
per
|
Dis
cussion
P
a
per
|
Discussion
P
a
per
|
Discussio
n
P
a
per
|
A quantitative discussion of the consequences of particle hygroscopicity in the east-ern Mediterranean region has been scarce (Van Dingenen et al., 2005; Sciare et al., 2003; Bougiatioti et al., 2009). Especially information about hygroscopic behavior of the Mediterranean aerosol has not been available at all until very recently (Pikridas et al., 2010). A particular relevance of the eastern Mediterranean troposphere derives
5
from the high amounts of humidity present in the atmosphere (leading to enhanced hygroscopic particle growth), and the region being located on the crossroads of Euro-pean anthropogenic pollution as well as African dust emission that immerse with the regional marine aerosol (Lelieveld et al., 2002; Pikridas et al., 2010).
This paper reports novel field observations of the hygroscopic properties of fine and
10
coarse aerosol particles representative of the East Mediterranean region. Different in-strumental techniques including a H-TDMA instrument and a H-DMA-APS instrument were deployed at the Finokalia research station on Crete (Greece) to characterize the hygroscopic properties of the eastern Mediterranean aerosol fine and coarse particle size range. We further combine these data with simultaneous in-situ aerosol optical
15
observations as well as particle number size distributions presented in an earlier pa-per (Kalivitis et al., 2008) to examine the role of air mass character, either marine or continentally influenced. As an application, the measured size-segregated particle hy-groscopic growth factors were used in an optical radiation transfer model to investigate the influence of the prevailing ambient RH on the ambient particle scattering coeffi
-20
cients and therewith on the resulting aerosol direct radiative forcing.
2 Experimental
2.1 Field experiment
The field experiment ARIADNE (Aerosol Physical and Chemical Identification on Crete) was conducted during ten weeks between 12 August and 20 October, 2005 at the
re-25
ACPD
10, 25991–26044, 2010Atmospheric aerosol particles over the
Eastern Mediterranean
M. Stock et al.
Title Page
Abstract Introduction
Conclusions References
Tables Figures
◭ ◮
◭ ◮
Back Close
Full Screen / Esc
Printer-friendly Version Interactive Discussion
Discussion
P
a
per
|
Dis
cussion
P
a
per
|
Discussion
P
a
per
|
Discussio
n
P
a
per
|
site’s location on the northern coast of Crete ensures that air is advected from the sea most of the time, thus limiting disturbances by land-based sources. The nearest urban centre is Heraklion with 150 000 inhabitants located 70 km west of Finokalia. The sta-tion is located at the top of a hilly elevasta-tion (250 m above sea level) facing the sea within the northerly wind sector between 270◦to 90◦. The nearest village with 10 inhabitants
5
is at a distance of 3 km to the south of the station. No human activities can be found at a distance shorter than 15 km within the above mentioned sector. A comprehen-sive description of the Finokalia station and the suite of atmospheric measurements conducted there are given in Mihalopoulos et al. (1997) and on the station’s website (http://finokalia.chemistry.uoc.gr).
10
In-situ aerosol measurements were carried out from inside a container laboratory, located at a distance of 200 m from the main building of the University of Crete’s re-search station. Ambient air was sampled at a total flow rate of 16.7 l min−1 through a PM10 inlet placed 6 m above the ground. When entering the container, the sample aerosol was conditioned to a low-humidity state. Both NafionTM membrane diffusion
15
dryers (model MD-110-12-F, ANSYCO Inc., Karlsruhe, Germany) and custom-made silica gel diffusion dryers were deployed to limit the relative humidity (RH) in the sam-pling liness below 30%. The desiccation served two purposes: first, condensation of moisture was avoided when the sample aerosol enters the air-conditioned laboratory container. Second, aerosol samples were prepared within a defined range of RH, which
20
facilitates intercomparisons with other measurements (e.g., Bergin et al., 1997; Carrico et al., 2003).
2.2 Particle number size distributions (DMPS-APS)
A flow-controlled closed-loop Differential Mobility Particle Sizer (DMPS; Birmili et al., 1999) was used to measure particle number size distributions in the mobility diameter
25
(Dp) range 18–800 nm. The sheath air in the DMPS was circulated in a closed loop, and
ACPD
10, 25991–26044, 2010Atmospheric aerosol particles over the
Eastern Mediterranean
M. Stock et al.
Title Page
Abstract Introduction
Conclusions References
Tables Figures
◭ ◮
◭ ◮
Back Close
Full Screen / Esc
Printer-friendly Version Interactive Discussion
Discussion
P
a
per
|
Dis
cussion
P
a
per
|
Discussion
P
a
per
|
Discussio
n
P
a
per
|
USA, Model 3321) was operated measuring the number size distributions of particles with aerodynamic diametersDae between 0.8 and 10 µm. The aerodynamic diameters Dae were converted to mobility diametersDp using an effective dry particle density of
1.7 g cm−3. This particluar value is close to the bulk densities of ammonium sulphate and nitrate, the main constituents of accumulation mode particles (cf. Fig. 3 below),
5
and reconciled the DMPS and APS distributions in their overlap region very well. We are aware that this density assumption is likely to be less accurate for the coarse mode (Dp>1 µm), where sodium chloride is the main constituent.
The DMPS and APS were corrected for diffusional and gravitational losses occur-ring in the sampling tubes using the analytical formulae for laminar pipe flows (Willeke
10
and Baron, 1993). DMPS and APS distributions were subsequently combined into a continuous size distribution across the full diameter range. The absolute measurement uncertainties with respect to particle counting and sizing in the DMPS are estimated to be 10% and 5%, respectively, based on laboratory calibrations. For the APS, these values were 10% and 9%, respectively (Wex, 2002).
15
2.3 Fine particle hygroscopicity (H-TDMA)
The hygroscopic properties of fine particles were analyzed using a Hygroscopic Tan-dem DMA (H-TDMA; Massling et al., 2005). Briefly, the H-TDMA consists of two se-quential Differential Mobility Analyzers (DMA, Hauke medium) coupled with two Con-densation Particle Counters (CPC, TSI 3010) as counting devices. The first DMA
se-20
lected a monodosperse particle size fraction from the polydisperse ambient aerosol at dry conditions. Half of the aerosol sample flow leaving the DMA was conducted to the first CPC, where the particle concentration of the monodisperse aerosol was de-termined, whereas the other half was humidified to a defined RH before entering the second DMA. The second DMA scanned an interval of the humidified particle size
dis-25
ACPD
10, 25991–26044, 2010Atmospheric aerosol particles over the
Eastern Mediterranean
M. Stock et al.
Title Page
Abstract Introduction
Conclusions References
Tables Figures
◭ ◮
◭ ◮
Back Close
Full Screen / Esc
Printer-friendly Version Interactive Discussion
Discussion
P
a
per
|
Dis
cussion
P
a
per
|
Discussion
P
a
per
|
Discussio
n
P
a
per
|
RH and at initial dry diameters of Dp=30, 50, 80, 150, 250 and 350 nm. A complete
cycle of six spectra at 90% RH took approximately one hour including a calibration scan with sodium chloride particles atDp=100 nm to recalculate the RH in the second
DMA. Before proceeding the data analysis, the quality of the data was checked. Par-ticularly, a fluctuation was tolerated in the H-TDMA system of±1% in relative humidity
5
and±1% in flow rates during one scan. Moreover, scans with instable concentrations in the first CPC and incorrect measurements from the second CPC were excluded from further data analysis.
2.4 Coarse particle hygroscopicity (H-DMA-APS)
The hygroscopic properties of coarse particles were analyzed using a Hygroscopicity
10
Differential Mobility Analyser-Aerodynamic Particle Sizer system (H-DMA-APS). De-tails of this instrument have been reported in Leinert and Wiedensohler (2008). Briefly, the H-DMA-APS consists of a High Aerosol Flow DMA (HAF-DMA) and two additional APS instruments (model 3320, TSI Inc.). The HAF-DMA is a custom-built DMA, which was operated at an aerosol flow of 2 l min−1and a sheath air flow of 20 l min−1.
Down-15
stream of the HAF-DMA the sample flow was divided into two parts. One part was supplied to the first APS, measuring the particle number size distribution at dry condi-tions (RH<10%), and the other part was conditioned to a certain, defined RH before being analyzed by the second APS at this RH. Thus, with the first APS the number size distribution downstream of the HAF-DMA in dry state was determined and with
20
the second APS the humidified number size distribution of the monodisperse aerosol at defined conditions was measured. For this reason, the sheath air of the second APS was conditioned to the same RH as the sampled and humidified aerosol. The H-DMA-APS system was used to determine the hygroscopic growth of particles at dry mobility diameters 1.0 and 1.2 µm. One measurement required between 15 and
25
30 min, depending on the available ambient particle concentration. Every four hours a calibration scan was carried out using polystyrene particles (Dp=1.05 µm) to verify
ACPD
10, 25991–26044, 2010Atmospheric aerosol particles over the
Eastern Mediterranean
M. Stock et al.
Title Page
Abstract Introduction
Conclusions References
Tables Figures
◭ ◮
◭ ◮
Back Close
Full Screen / Esc
Printer-friendly Version Interactive Discussion
Discussion
P
a
per
|
Dis
cussion
P
a
per
|
Discussion
P
a
per
|
Discussio
n
P
a
per
|
The quality check of the H-DMA-APS included also an inspection of the relative hu-midity and the determination of the Poisson error of the APS counts. The presented H-DMA-APS results are averaged over 12 h in order to achieve statistically robust re-sults. The flow rates and the relative humidities fluctuated during one scan in a range of ±2–3%. This higher fluctuation in comparison to the H-TDMA is caused by the
5
longer sampling time for this instrument. An uncertainty of 2% in RH leads to a 6–10% theoretical uncertainty in all determined growth factors.
2.5 Aerosol optical scattering and absorption
The total and backscattering coefficients (σsp,neph and σbsp,neph, respectively) were
measured at dry conditions with a three-wavelength, and total/backscatter
nephelome-10
ter (model 3563, TSI Inc.) at wavelengths of 450, 550 and 700 nm. Design and ap-plications of the instrument were summarized in Heintzenberg and Charlson (1996). Calibrations were carried out with filtered particle-free air as the low span gas and CO2
as the high span gas (Anderson and Ogren, 1998). Zero baseline checks were per-formed at least once a week. The absolute uncertainty of the measuredσsp,neph and 15
σbsp,nephwere estimated to be 7% (Anderson et al., 1996).
A Multi-Angle Absorption Photometer (MAAP model 5012, Thermo Inc., Waltham, USA) was used to measure the aerosol light absorption coefficient (σap,MAAP) at a
wave-length of 637 nm1under dry conditions. The MAAP determines aerosol light absorption from the simultaneous measurements of radiation passing through and scattered back
20
from particles accumulating on a filter tape. It operates at three detection angles to resolve the influence of light-scattering aerosol components on the angular distribu-tion of the back scattered radiadistribu-tion (Petzold and Sch ¨onlinner, 2004). The flow rate was calibrated once per week using a bubble flow meter. Using a specific attenuation cross section of 6.6 m2g−1the MAAP converts the light absorption signal into a mass
25
1
ACPD
10, 25991–26044, 2010Atmospheric aerosol particles over the
Eastern Mediterranean
M. Stock et al.
Title Page
Abstract Introduction
Conclusions References
Tables Figures
◭ ◮
◭ ◮
Back Close
Full Screen / Esc
Printer-friendly Version Interactive Discussion
Discussion
P
a
per
|
Dis
cussion
P
a
per
|
Discussion
P
a
per
|
Discussio
n
P
a
per
|
concentration of black carbon (soot). The absolute measurement uncertainty of the MAAP was determined to be 12% (Petzold and Sch ¨onlinner, 2004) while laboratory in-tercomparisons of multiple MAAP instruments suggested a unit-to-unit variability below 3% (M ¨uller et al., 2010).
2.6 Chemical composition
5
Aerosol samples for subsequent chemical analysis were collected using a Small De-posit Area Low Volume-Impactor (SDI; Maenhaut et al., 1996). The upper cut-offsize of the device was 10 µm, with 12 collection stages being provided between 0.041 and 10 µm. During ARIADNE the average sampling period was 48 hours at a flow rate of 20 l min−1. The filters were covered by aluminium foil, sealed in polyethylene bags
10
and stored in a refrigerator at 4◦ C prior to analysis. Chemical analysis yielded inor-ganic ions as well as elemental carbon (EC) and particulate orinor-ganic matter (POM). For technical details of the analytical procedures we refer the reader to Teinil ¨a et al. (2000).
3 Methods
3.1 Processing of hycroscopicity data
15
3.1.1 H-TDMA: volume equivalent growth factors and number fractions
Gaussian distributions were fitted to the particle number size distribution recorded downstream of the humidification step. On the basis of their modal mean diameters and particle numbers, wet particle growth factors and their corresponding number frac-tions were determined for each hygroscopic particle mode.
20
ACPD
10, 25991–26044, 2010Atmospheric aerosol particles over the
Eastern Mediterranean
M. Stock et al.
Title Page
Abstract Introduction
Conclusions References
Tables Figures
◭ ◮
◭ ◮
Back Close
Full Screen / Esc
Printer-friendly Version Interactive Discussion
Discussion
P
a
per
|
Dis
cussion
P
a
per
|
Discussion
P
a
per
|
Discussio
n
P
a
per
|
gfve=
Dp,wet(ve) Dp,dry(ve)
(1)
Sodium chloride calibration scans carried out at at 90% RH were used to determine the real RH inside the second DMA. Based on this calculation the growth factors measured with the H-TDMA were recalculated using a solubility model (see Sect. 3.2 below) to a standard RH of 90%. The number fraction nf represents the ratio of the number of
5
particles belonging to one hygroscopic growth group and the sum of the particles of all groups (see Eq. 2). Here, the indexi declares the number of the group.
nf=Pnfi
3
i=1nfi
(2)
3.1.2 H-DMA-APS: aerodynamic growth factors and number fractions
The characteristics of the measured humidified size distributions differed between the
10
H-TDMA and the H-DMA-APS. The dry size distribution measured with the first APS of the H-DMA-APS showed a bimodal and sometimes a trimodal behavior. The reason was the combination of the different measurement principles of DMA and APS. Larger particles with multiple charges were observed as a small mode right of the main peak in the particle number size distribution measured with the dry APS. Therefore this mode
15
was not used for the determination of hygroscopic growth. Small hydrophobic particles with higher shape factors and the same electrical mobility as the particles of the main peak appeared in the dry particle number size distribution left to the main peak. The same group of hydrophobic particles was found in the wet particle number size distri-butions. The parameters of the left mode and the main mode were used to determine
20
the aerodynamic growth factors and their corresponding number fractions of different hygroscopic growth groups measured with the H-DMA-APS system. The calculation of the aerodynamic growth factors and number fractions follows the Eqs. (1) and (2) for the H-TDMA, but the used diameters are aerodynamic, therefore the determined growth factors are aerodynamic growth factors.
ACPD
10, 25991–26044, 2010Atmospheric aerosol particles over the
Eastern Mediterranean
M. Stock et al.
Title Page
Abstract Introduction
Conclusions References
Tables Figures
◭ ◮
◭ ◮
Back Close
Full Screen / Esc
Printer-friendly Version Interactive Discussion
Discussion
P
a
per
|
Dis
cussion
P
a
per
|
Discussion
P
a
per
|
Discussio
n
P
a
per
|
3.2 Solubility model
A simplistic solubility model was used to calculate the soluble volume fraction of the particles from the recalculated growth factors at 90% RH (H-TDMA) and 85% RH (H-DMA-APS), respectively. The used solubility model is based on the assumption, that the measured particles consist of an insoluble core coated by soluble material.
5
The soluble volume fraction was estimated by Swietlicki et al. (1999) as:
ε(RH)=
gf3measured(RH)−1 gf3theoretical(RH)−1
(3)
The theoretical growth factor gftheoretical is determined by the hygroscopic growth of
a theoretical particle, which is composed of only one soluble component having the same wet diameter as the measured particle at the RH of the individual measurement.
10
Growth factors reported by Tang and Munkelwitz (1994) were used to describe the growth of pure sodium chloride (H-DMA-APS) and pure ammonium sulfate particles (H-TDMA).
Furthermore, the total soluble volume fractionεtot was determined. This parameter
considers a theoretical bulk particle and characterizes the mean solubility of one certain
15
particle size taking into account the fractionation into the different hygroscopic growth groups.
εtot= 3
X
i=1
nfi·εi (4)
The recalculated hygroscopic growth factors gfve at 90% RH of the H-TDMA were
averaged over the impactor periods and then transformed to a mean volume
hygro-20
scopic growth factor gfv-mean for the measured particle diameters, to compare them
with the results of the chemical growth model gfchem. The following Eq. (5) describes
ACPD
10, 25991–26044, 2010Atmospheric aerosol particles over the
Eastern Mediterranean
M. Stock et al.
Title Page
Abstract Introduction
Conclusions References
Tables Figures
◭ ◮
◭ ◮
Back Close
Full Screen / Esc
Printer-friendly Version Interactive Discussion
Discussion
P
a
per
|
Dis
cussion
P
a
per
|
Discussion
P
a
per
|
Discussio
n
P
a
per
|
gfv-mean= 3
v u u tX3
i=1
gfi,ve3·nfi (5)
3.3 Optical model
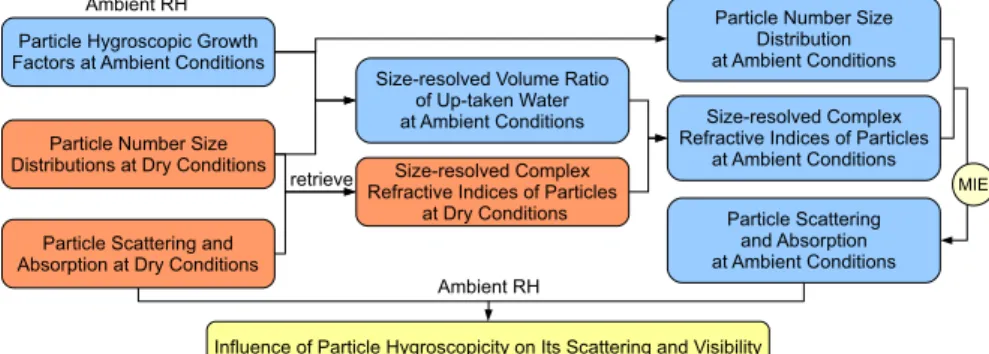
To examine the influence of the particle’s hygroscopicity on its light scattering and therewith on the local visibility, an optical model was applied to model the particle optical properties at ambient conditions. The scheme is outlined in Fig. 2. Particles are
5
assumed to grow as a result of their interaction with water vapour. They are assumed to be spherical, so that the homogeneous spherical Mie code can be appiled (Bohren and Huffman, 1998). As illustrated in the right-hand part of Fig. 2, particle number size distributions and complex refractive indices at ambient RH were required as input parameters for the optical model.
10
3.3.1 Parameterizations of particle hygroscopicity
A central objective of our work was to study the dependency of aerosol optical prop-erties on ambient relative humidity. In order to derive the size-resolved particle hy-groscopic growth factors gf(Dp,RH) and particle number size distributions at ambient
RH, the required hygroscopic growth model was developed as a hybrid from both,
ex-15
perimental hygroscopicity data and chemical particle analysis from impactor samples collected during the ARIADNE experiment at Finokalia.
For the fine particle mode (Dp≤700 nm) we derived hygroscopic growth factors from
the H-TDMA measurements at 90% RH. The average particle mass size distribution shows a clear bimodal pattern, as presented in Fig. 3. Particle mass was derived by
20
ACPD
10, 25991–26044, 2010Atmospheric aerosol particles over the
Eastern Mediterranean
M. Stock et al.
Title Page
Abstract Introduction
Conclusions References
Tables Figures
◭ ◮
◭ ◮
Back Close
Full Screen / Esc
Printer-friendly Version Interactive Discussion
Discussion
P
a
per
|
Dis
cussion
P
a
per
|
Discussion
P
a
per
|
Discussio
n
P
a
per
|
hygroscopic growth model was devised, describing particles withDp≤700 nm as
con-sisting of an insoluble core coated by ammonium sulfate. Using the experimentally de-termined growth of ammonium sulfate (Tang and Munkelwitz, 1994) with dependence on RH, the simple two-component model allows estimating the fraction ε of soluble material in the particle at each of the given dry diametersDpbetween 30 and 350 nm. 5
The H-TDMA data suggested that for diametersDp between 50 and 350 nm εvaried
between 66% and 74%. Using these soluble volume fractions, the model was applied to calculate the gf(Dp,RH) of particles with Dp between 20 and 700 nm at the
corre-sponding ambient RH.
For the coarse particle mode (Dp≥1.3 µm) a hygroscopic growth model based on 10
experimental chemical composition was applied. Figure 3 suggested that the chemical composition of super-µm particles was dominated by fresh and processed sea-salt par-ticles (e.g., sodium chloride and nitrate). Accordingly, a three-component model was devised combining an insoluble fraction (supposedly dust) with two soluble fractions of sodium nitrate and sodium chloride, respectively. The growth of the soluble species
15
was again based on experimental data (Tang and Munkelwitz, 1994), with both so-lutes acting like in an ideally mixed solution (Zdanovskii, 1948; Stokes and Robinson, 1966). The described model was used to calculate the gf(Dp,RH) of particles in the
mobility diameter range 1.3–10 µm at prevailing ambient RH. For the intermediateDp
range 700–1300 nm both models were interpolated to provide a smooth transition
be-20
tween the fine and coarse particle modes. On the basis of these parameterizations of the particles’ hygroscopicity, gf(Dp,RH) and dry particle number size distributions were
used to calculate particle number size distributions at ambient RH (30–95%, average ∼71%).
3.3.2 Optically retrieved refractive index
25
ACPD
10, 25991–26044, 2010Atmospheric aerosol particles over the
Eastern Mediterranean
M. Stock et al.
Title Page
Abstract Introduction
Conclusions References
Tables Figures
◭ ◮
◭ ◮
Back Close
Full Screen / Esc
Printer-friendly Version Interactive Discussion
Discussion
P
a
per
|
Dis
cussion
P
a
per
|
Discussion
P
a
per
|
Discussio
n
P
a
per
|
distributions, three-wavelength total/hemispheric-back scattering, and one-wavelength absorption coefficients. The approach of the retrieval model was similar to those de-scribed in Guyon et al. (2003) and Schkolnik et al. (2007). The Mie code iteratively determined themedry for a given particle number size distribution by matching the
cal-culated and measured scattering and absorption coefficients (σjcandσje, respectively,
5
and j=1,...,7 referring to the seven measured optical parameters), as described by Eq. (6). Here, nr and ni were the real and imaginary parts of medry, respectively. The
code assumed spherical particles and homogeneous, internally mixed particle compo-sitions.
Minimize
nr,ni
χ2(nr,ni)=
7
X
j=1
σjc−σje
σje
2
(6)
10
The minimization was achieved by a Newton-Raphson Iterative Method (Press et al., 1992). The partial derivatives of χ2(nr,ni) with respect to nr and ni vanished when
χ2(nr,ni) approached the minimum value. ∆nrand∆ni were given by:
∆nr
∆ni
=−J−1 "
∂χ2/∂nr ∂χ2/∂ni
#
, (7)
whereJwas the Jacobian Matrix (Press et al., 1992).
15
The value of
q
(∆nr)2+(∆ni)2 was chosen for stopping threshold, i.e. the iteration converged on condition of
q
(∆nr)2+(∆ni)2<eps. Here, eps was set as 10
−7
.
A sensitivity study was carried out to test whether a unique solution can be achieved for the current data set. A series of refractive indices was assumed to vary from 1.33 to 1.70 fornr and from 0 to 0.1 for ni with respect to the expected range of refractive
20
ACPD
10, 25991–26044, 2010Atmospheric aerosol particles over the
Eastern Mediterranean
M. Stock et al.
Title Page
Abstract Introduction
Conclusions References
Tables Figures
◭ ◮
◭ ◮
Back Close
Full Screen / Esc
Printer-friendly Version Interactive Discussion
Discussion
P
a
per
|
Dis
cussion
P
a
per
|
Discussion
P
a
per
|
Discussio
n
P
a
per
|
2006). The theoretically calculated optical properties and the averaged particle number size distribution again served as input parameters for the retrieving model. First, the assumed refractive indices could successfully be retrieved. Second, a rough step-search was utilized with a step of 0.05 fornrand 0.005 forni within the range of 1.0 to 2.0 and 0 to 0.2, respectively. Contour plots of the differences between the calculated
5
optical properties and theoretically predicted values showed that there was only one unique solution (trough) in the expected ranges of nr and ni. Guyon et al. (2003) also found that the iterative calculations always converged toward a unique solution within the range of refractive indices open to the model, except for very little unusual cases. Thus, the interactive method was capable to provide the desired results for the
10
ARIADNE data set.
A Monte Carlo simulation (Wex, 2002; Cheng et al., 2006) was carried out by ran-domly (and simultaneously) varying all input parameters (scattering, absorption coef-ficients and particle number size distribution) in the retrieving model to investigate the uncertainties of retrievedmedry due to the uncertainties in the experiments. The uncer-15
tainties of the retrieval were found to be 5% fornrand 10% forni, which were consistent with Guyon et al. (2003). However, we admit that uncertainties introduced by the as-sumptions in the model – including the spherical shape and homogeneously internally mixed assumptions for the particles as well as the non-size dependent assumptions for the retrievedmedry, were not taken into account in the uncertainty analysis. We felt that 20
the computational consideration of any particle morphology other than a homogeneous mixture is outside the scope of this work.
In the next step, the retrieved refractive index at dry conditions and the particle’s hygroscopic growth factors gf(Dp,RH) were used to calculate the refractive indices of
particles at ambient RH (see Fig. 2). At each size bin, the up-taken water volume ratio
25
(Rw,V(Dp,RH)), defined as the volume ratio of up-taken water and the total particle at
ambient RH was determined asRw,V(Dp,RH)=
h
gf(Dp,RH)3−1 i
/gf(Dp,RH)3.
Together with the retrieved medry at dry conditions, the Rw,V(Dp,RH) were further
ACPD
10, 25991–26044, 2010Atmospheric aerosol particles over the
Eastern Mediterranean
M. Stock et al.
Title Page
Abstract Introduction
Conclusions References
Tables Figures
◭ ◮
◭ ◮
Back Close
Full Screen / Esc
Printer-friendly Version Interactive Discussion
Discussion
P
a
per
|
Dis
cussion
P
a
per
|
Discussion
P
a
per
|
Discussio
n
P
a
per
|
(me(Dp,RH)), according to a simple volume mixing rule (Covert et al., 1972). The
re-fractive index of water was used as 1.33–0i.
4 Results and discussion
4.1 Campaign overview and air mass classification
Among all measured aerosol and gas phase parameters, the mass concentration of
5
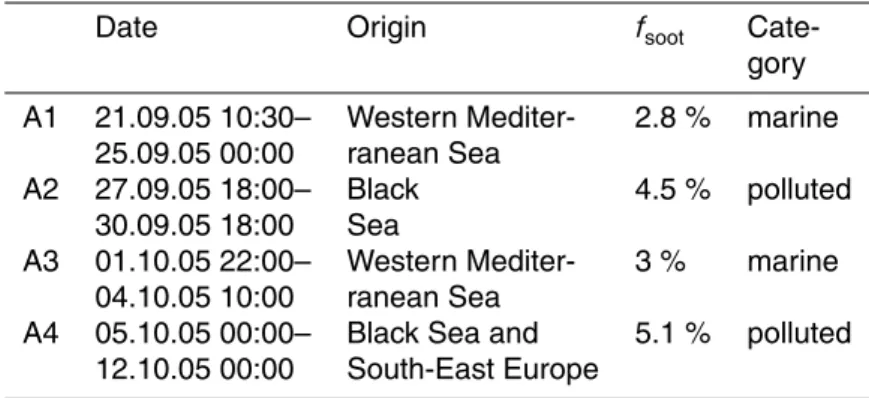
soot turned out to be the most favourable indicator for the anthropogenic influence on the air masses sampled during ARIADNE. Figure 4 shows the time series of the soot mass concentration, the relative mass fraction of soot, and particle mass concentration of particles<1 µm. Four distinct time periods (A1–A4) were defined, representing low (A1, A3) and high (A2, A4) mass concentrations of soot. These four periods coincide
10
with the episodes of low and high total particle mass as well as accumulation mode particle number (see Fig. 4), and are identical to those defined in (Kalivitis et al., 2008). The latter reference also presents particle number size distributions corresponding to the four periods. The four periods are listed in Table 1.
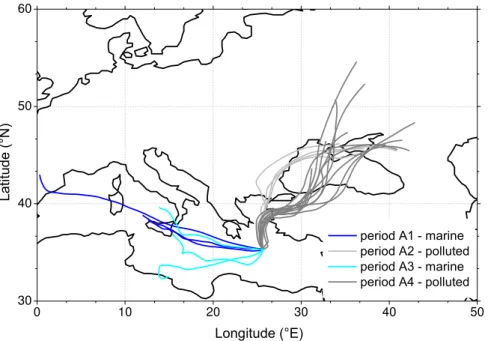
The air masses during A1 and A3 originated in the Western Mediterranean Sea (cf.
15
back trajectories in Fig. 5), and showed only minor continental influence. Consequently, they are termed “marine” air masses in the following. The counterpart are the periods A2 and A4, during which the back trajectories pointed to continental source regions on the north-eastern shore of the Mediterranean (see Fig. 5). The soot and total particle mass concentrations showed higher levels compared to A1 and A3 and are therefore
20
described as “continentally polluted” hereafter.
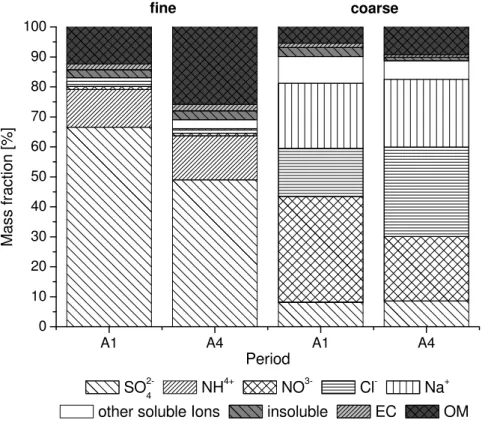
A look at the size-fractionated chemical composition of the particles confirmed a sys-tematic difference between fine and coarse particles: Fine particles consist overwhelm-ingly of ammonium sulphate and organic matter, coarse particles of sodium chloride and nitrate (see Fig. 6). Soot occurs in minor mass fractions between 2 and 6% only,
25
ACPD
10, 25991–26044, 2010Atmospheric aerosol particles over the
Eastern Mediterranean
M. Stock et al.
Title Page
Abstract Introduction
Conclusions References
Tables Figures
◭ ◮
◭ ◮
Back Close
Full Screen / Esc
Printer-friendly Version Interactive Discussion
Discussion
P
a
per
|
Dis
cussion
P
a
per
|
Discussion
P
a
per
|
Discussio
n
P
a
per
|
4.2 Particle hygroscopicity
4.2.1 Hygroscopic growth factors and soluble volume fractions
The measurements of both hygroscopicity instruments revealed three groups of parti-cles with different hygroscopic behavior. These particle groups were differentiated in a “more hygroscopic” group, a “less hygroscopic” and a “nearly hydrophobic” particle
5
group. This finding is in broad agreement with the compilation of previous H-TDMA observations (Swietlicki et al., 2008).
The hygroscopicity of fine particles was derived from the H-TDMA. Table 2 com-piles the mean hygroscopic growth factors, their corresponding number fractions, sol-uble volume fractions and total solsol-uble volume fractions with their standard deviations.
10
Ammonium sulfate was assumed as the dominant soluble material for the calculation of soluble volume fractions of sub-micrometer particles independent on hygroscopic growth group (see Sect. 3.2) with respect to the observed chemical composition. These assumption is consistent with the chemical composition presented in Fig. 6. This Fig-ure displays the percentage mass fractions of analyzed ions during the time periods A1
15
(marine) and A4 (continentally-polluted) for the fine (Dp<1 µm) and coarse (Dp>1 µm)
particle fractions. Obviously, the major ions were SO24−, NH+4, NO−3, Cl−and Na+. This is in a good agreement with an earlier experiment in this area (Bardouki et al., 2003).
The hygroscopicity of coarse particles was assessed using the H-DMA-APS instru-ment. Because of the poor counting statistics of the H-DMA-APS measurements,
yield-20
ing long integration times, a segregation of the data into the four classified air masses (A1–A4) was impossible. Instead, only mean values of the particle number fractions and aerodynamic growth factors are listed in Table 3.
In fact the hygroscopic growth factor of the more hygroscopic particle group in-creased with an increasing particle diameter (see Table 2). Furthermore, the
num-25
ACPD
10, 25991–26044, 2010Atmospheric aerosol particles over the
Eastern Mediterranean
M. Stock et al.
Title Page
Abstract Introduction
Conclusions References
Tables Figures
◭ ◮
◭ ◮
Back Close
Full Screen / Esc
Printer-friendly Version Interactive Discussion
Discussion
P
a
per
|
Dis
cussion
P
a
per
|
Discussion
P
a
per
|
Discussio
n
P
a
per
|
Table 3). It has to be pointed out that the number fraction of the nearly hydropho-bic particle group started to increase from about 10% in the sub-micrometer range at
Dp=250 nm to about 30% atDp=1.2 µm. While the mass in the fine particle fraction
was clearly dominated by sulfate, the coarse fraction showed notable number contribu-tions of insoluble particles, most likely dust particles.
5
4.2.2 Relationship between hygroscopicity and soot
In Fig. 7 the total soluble volume fraction, determined from H-TDMA measurements, is compared against the mass fraction of EC for the four defined air masses A1–A4. The lowest correlation coefficients were found for fine particles with diameters of 30 and 50 nm. In contrast, 150 nm particles had the highestR2value of 0.74. This
origi-10
nates in the characteristic maximum of the soot number size distribution, which resides between 50 and 100 nm. However, particles reaching the Finokalia measurement site were usually not directly freshly emitted but may originate from continental sources and be transformed by atmospheric condensation processes. Thus, the highest correlation between insoluble particle volume and soot fraction was found for larger particles with
15
Dp=100 nm indicating the highest soot fraction. This result agrees well with the
av-erage size distribution for elemental carbon (EC) retrieved from the size segregated chemical analysis which is centered aroundDp=130 nm (see Fig. 8). The density of
EC was estimated to be 1.9 g cm−3 (Fuller et al., 1999), which is necessary for the conversion of mass size to number size distributions.
20
The clear dependence of the total soluble volume fraction on the soot fraction is also visible in Fig. 9. The total soluble volume fraction increased during the marine periods with increasing dry diameter for sub-micrometer aerosol. In general, the total soluble volume fraction decreased with increasing relative soot fraction. This effect is strongest for accumulation mode particles (Dp=150, 250, and 350 nm).
25
ACPD
10, 25991–26044, 2010Atmospheric aerosol particles over the
Eastern Mediterranean
M. Stock et al.
Title Page
Abstract Introduction
Conclusions References
Tables Figures
◭ ◮
◭ ◮
Back Close
Full Screen / Esc
Printer-friendly Version Interactive Discussion
Discussion
P
a
per
|
Dis
cussion
P
a
per
|
Discussion
P
a
per
|
Discussio
n
P
a
per
|
also consistent with the increased amounts of organic matter (see Fig. 6). The soluble volume fractions of 30 nm show the lowest overall values, regardless of air mass type. This is suggestive of their physico-chemical properties being less influenced by long-range transport, and points to local sources or atmospheric secondary formation as the responsible source processes.
5
4.3 Amplification of aerosol scattering
4.3.1 Optical model initialization: retrieved refractive index at dry conditions
As described in Sect. 3.3 and illustrated in Fig. 2, effective refractive indices of aerosol particles at dry conditions were one of the key parameters to initialize the optical sim-ulations at ambient RH. Themedry(nr,ni) were retrieved by the iterative Mie calculations
10
using the best fit between the measured aerosol optical properties and the calculated ones. Table 4 shows correlations between the seven calculated and measured opti-cal properties (σjc and σje) with slope (b) and correlation coefficients (R2). The linear fitting was done to match zero. Excellent agreement between σapc and σ
e
ap has been
found withbof 0.99 andR2nearly 1.0. In general, the simulated and measured
scat-15
tering coefficients followed each other very well. Also, all correlation coefficients R2
were found to be greater than∼0.95. Except forDp=700 nm, the deviations between
the measured and calculated total/hemispheric back scattering coefficients were less than∼7%. Larger deviations occurred at 700 nm. However, intercomparison studies of nephelometers in the laboratory also indicate that there might be higher uncertainties
20
in the measured light scattering at Dp=700 nm (Heintzenberg et al., 2006). On the
basis of the comparison between the calculated and measured optical properties, it could be concluded that the retrieving model was suitable to provide time series of the refractive index and in general the retrievedmedry(nr,ni) were capable to well represent the measured particle scattering and absorption coefficients at dry conditions.
ACPD
10, 25991–26044, 2010Atmospheric aerosol particles over the
Eastern Mediterranean
M. Stock et al.
Title Page
Abstract Introduction
Conclusions References
Tables Figures
◭ ◮
◭ ◮
Back Close
Full Screen / Esc
Printer-friendly Version Interactive Discussion
Discussion
P
a
per
|
Dis
cussion
P
a
per
|
Discussion
P
a
per
|
Discussio
n
P
a
per
|
During the field study, different air masses were observed and they were classified with respect to their origin based on air mass back trajectory analysis (see Sect. 4.1). In particular, air masses of marine origin from the Mediterranean Sea and those strongly imprinted by continental contact with South-East Europe were observed. According to Table 1, particle optical properties and retrieved refractive indices at dry
condi-5
tions were also classified into two groups, marine (m) and continentally-polluted (cp) periods. Figure 10 presents time series of the total scattering coefficient at 550 nm (σsp,neph,550 nm) and absorption coefficient at 630 nm (σap,MAAP,630 nm) measured by the
nephelometer and the MAAP, as well as the retrievednrandni. More detailed statistic information for these parameters during the two different periods were summarized in
10
Table 5.
As shown in Fig. 10, the measured scattering and absorption coefficients gener-ally show a parallel time evolution. However, the respective values were significantly lower for marine air masses (see Fig. 10 and Table 5) compared to the measured ones during the continentally-polluted periods. This was mainly due to the lower mass
con-15
centrations of sub-µm particles measured during the marine periods. Real parts of the retrieved refractive indices were very similar for both air mass types (marine∼1.48 and continentally-polluted ∼1.50), whereas the average imaginary part was a factor of 2 lower for marine air masses (see Table 5). The real and imaginary parts of refractive index were highly variable for marine air masses, probably due to individual emission
20
sources (e.g., ships).
4.3.2 Optical simulation at ambient RH: influence of particle hygroscopicity on
light scattering
In order to investigate the influence of the particle’s hygroscopicity on light scattering for the Eastern Mediterranean aerosol, two cases were chosen: the marine air mass
25
ACPD
10, 25991–26044, 2010Atmospheric aerosol particles over the
Eastern Mediterranean
M. Stock et al.
Title Page
Abstract Introduction
Conclusions References
Tables Figures
◭ ◮
◭ ◮
Back Close
Full Screen / Esc
Printer-friendly Version Interactive Discussion
Discussion
P
a
per
|
Dis
cussion
P
a
per
|
Discussion
P
a
per
|
Discussio
n
P
a
per
|
applied to these two cases. Figure 11 presents the time series of the calculated aerosol scattering coefficient atλ=550 nm at ambient RH together with the measured values by the nephelometer at dry conditions.
In addition, the relative humidity and the scattering growth factor (scattering coeffi -cient at ambient conditions divided by that at dry conditions,ξsp(RH)=σsp,amb/σsp,dry) 5
for both marine and continentally-polluted cases are shown. The truncation of the nephelometer was taken into account in the optical simulations. Data gaps during the continentally-polluted period were due to missing data of the measured aerosol optical properties. Pronounced enhancement of particle scattering due to particle hy-groscopicity was found during both, the marine and the continentally-polluted cases
10
(see Fig. 11a). Theξspbasically followed the pattern of RH (see Fig. 11b).
In Fig. 12, theξspare plotted as a function of RH for both cases. When the marine air
masses dominated at Finokalia, theξsp(80%) ranged from 2.7 to 3.5. This is consistent
with the measured scattering growth factor at RH 80% for sea salt and (NH4)2SO4 (3.4 and 2.2, respectively) (Covert et al., 1972), since the aerosol composition was
15
dominated by sea salt particles combined with some fractions of ammonium sulfate. In marine air the aerosol scattering coefficient varied with RH as theoretically expected from sea salt particles. However, it is worth noticing thatξsp(80%) for the marine case
at Finokalia station was higher than the values of clean marine aerosols (1.8–2.5) reported by previous studies at other locations. For example, the reportedξsp(80%) for 20
clean marine periods at Cape Grim, Tasmania were 2.0±0.2 and 2.5±0.2 (measured using a humidified nephelometer; Carrico et al., 1998) and the respective values were on average 2 in Seattle (Covert et al., 1972), 2.09 off the mid-Atlantic coast of the United States (Kotchenruther et al., 1999), and 2.3±0.3 in clean marine air near the coast of California and Washington. Moreover, for higher RH during the marine case at
25
Finokalia, the simulated amplification of scattering due to particle water uptake could be as large as a factor of 5 at RH 90% and 7 to 8 at RH∼95%.
ACPD
10, 25991–26044, 2010Atmospheric aerosol particles over the
Eastern Mediterranean
M. Stock et al.
Title Page
Abstract Introduction
Conclusions References
Tables Figures
◭ ◮
◭ ◮
Back Close
Full Screen / Esc
Printer-friendly Version Interactive Discussion
Discussion
P
a
per
|
Dis
cussion
P
a
per
|
Discussion
P
a
per
|
Discussio
n
P
a
per
|
complicated mixture of various chemical compounds and also the variation in particle number size distribution was higher. Referring to Fig. 12, the differences inξspbetween
marine and continentally-polluted cases are significant. The scattering growth factors during the continentally-polluted case were always much smaller than those during the marine case, regardless of the variation of RH. Also, the amplification rate of scattering
5
with increasing RH during the continentally-polluted case was lower than that during the marine case. At RH 90%, theξsp during continentally-polluted periods was less
than 3 (see the zoom-in subset in Fig. 12), whereas the respective growth during the marine period reached up to about a factor of 5. A strong enhancement of particle scattering due to water uptake at RH>90% was observed in marine-type air;
unfortu-10
nately, no case of similarly high RH was observed during ARIADNE in polluted air that could serve for a direct comparison.
Based on a comparison of existing studiesξsp(80−85%) can be concluded change
with time, space, and aerosol type (Covert et al., 1972; Sloane and Wolff, 1985; Malm et al., 1994; Hegg et al., 1996; Tang, 1996; Li-Jones et al., 1998; Kotchenruther and
15
Hobbs, 1998; Kotchenruther et al., 1999; Gass ´o et al., 2000; Koloutsou-Vakakis et al., 2001; Im et al., 2001; Hegg et al., 2002; Sheridan et al., 2002; Randriamiarisoa et al., 2006; Bundke et al., 2002; Nessler et al., 2005; Raut and Chazette, 2007; Cheng et al., 2008). The reported literature values range from 1.8 to 2.5 for clean marine aerosols, 1.58 to 1.81 for polluted marine aerosols, 1.4 to 1.65 for anthropogenic aerosols,∼1.0
20
to 1.13 for dust aerosols and ∼1.1 to 1.4 for fresh biomass burning particles. As global average, 1.7±0.3 was used by Charlson et al. (1991) for anthropogenic sulfate aerosols in a 3-dimensional global model. Our results for the continentally-polluted case were found to be higher than those reported for polluted marine aerosols and anthropogenic aerosols in other studies. This may indicate a relatively significant
influ-25
ence of marine aerosols during the continentally-polluted period.
ACPD
10, 25991–26044, 2010Atmospheric aerosol particles over the
Eastern Mediterranean
M. Stock et al.
Title Page
Abstract Introduction
Conclusions References
Tables Figures
◭ ◮
◭ ◮
Back Close
Full Screen / Esc
Printer-friendly Version Interactive Discussion
Discussion
P
a
per
|
Dis
cussion
P
a
per
|
Discussion
P
a
per
|
Discussio
n
P
a
per
|
growth. Thus, the effective diameter (Dp,eff) of fine particle number size distributions
(<1 µm) at dry conditions was calculated as
Dp,eff=
Z
(Dp)3·n(logDp)·dlogDp/
Z
(Dp)2·n(logDp)·dlogDp. (8)
Here Dp is the particle diameter and n(logDp) is the particle number size
distribu-tion. As illustrated in Fig. 13, the most efficient scattering amplification in terms of the
5
maximums ofξspoccurred when the particle effective diameter (<1 µm) was between
250 and 280 nm when the RH was below 80% for the marine case. If the RH was higher than 80%, the scattering coefficient of particles with smallerDp,eff(220–230 nm) grew effectively too. The pattern of scattering growth factors during the continentally-polluted case was relatively more complex than that of the marine case. However, this
10
might be owing to the smaller number of data points and the smoothing method. The most effective scattering amplification occurred at effective diameters between 260 and 300 nm. A similar behavior of particles with smallerDp,eff (240–260 nm) has also been found during the continentally-polluted case. Tang (1996) investigated the size-effects of hygroscopic behavior onσspwith numerical methods. They found that assuming the 15
same standard deviation of particle number size distributions, the increase ofσspwith
RH was smaller for the particles with a mean geometric diameter of 0.6 µm compared to that for particles with a geometric mean diameter of 0.3 µm. Nessler et al. (2005) also stated that due to the particle size dependence ofσsp, the humidity effect onσsp
was more intense for the smaller particles within the mid-visibleλrange.
20
ACPD
10, 25991–26044, 2010Atmospheric aerosol particles over the
Eastern Mediterranean
M. Stock et al.
Title Page
Abstract Introduction
Conclusions References
Tables Figures
◭ ◮
◭ ◮
Back Close
Full Screen / Esc
Printer-friendly Version Interactive Discussion
Discussion
P
a
per
|
Dis
cussion
P
a
per
|
Discussion
P
a
per
|
Discussio
n
P
a
per
|
4.4 Comparison of aerosol radiative forcing for marine and continentally
influ-enced air masses
In order to estimate and compare the aerosol radiative forcings (∆Fr) caused by the
aerosol in the different air masses under study, a simplistic two-layer-single-wavelength radiative transfer model was used (Ch´ylek and Wong, 1995). According to this model,
5
∆Fr=−
1 2S0[T
2
atm(1−AC)][(1−Rs)2βτsp−2Rsτap]. (9)
Concretely, the factor 12 accounts for the partial length of the day, S0=1370 W m
−2
is the solar constant, Tatm the transmittance of the atmosphere above the aerosol layer
with a global average of∼0.76,ACthe fraction of sky covered by clouds,Rsthe surface
albedo of the underlying ground,τspandτapare the optical thicknesses of the aerosol 10
layer due to light scattering and absorption, respectively, andβis the average upscatter fraction.
Finokalia is located on the island Crete in the Eastern Mediterranean Sea, to the south of continental Greece (Fig. 1). For the open Aegean Sea in this region, an average planetary boundary layer (PBL) height of 400 m is typically reported for this
15
time of the year (Kallos et al., 1998). Vardavas and Taylor (2007) indicated that the sea albedo depends on the solar zenith angle (Fresnel reflection), and whether or not the sky is cloudy. For cloudy sky (diffuse radiation), the authors report the sea albedo to be about 0.055, for clear sky for overhead sun about 0.021 climbing up to about 0.8 when the sun is low on the horizon. However, for a rough water surface
20
it does not go beyond 0.3 (Vardavas and Taylor, 2007). A mean value of 0.06 was chosen in the model simulations of the present study. The radiative cloud fraction images retrieved from OMI (Ozone Monitoring Instrument) satellite observations (data retrieved from (http://toms.gsfc.nasa.gov/reflect/reflect v8.html) were checked for the August to October period of 2005. It was confirmed that there were almost no clouds
25
ACPD
10, 25991–26044, 2010Atmospheric aerosol particles over the
Eastern Mediterranean
M. Stock et al.
Title Page
Abstract Introduction
Conclusions References
Tables Figures
◭ ◮
◭ ◮
Back Close
Full Screen / Esc
Printer-friendly Version Interactive Discussion
Discussion
P
a
per
|
Dis
cussion
P
a
per
|
Discussion
P
a
per
|
Discussio
n
P
a
per
|
only partial cloud covers over the open Aegean sea. So theACcould be safely set to
0.0 in the radiative calculations.
Wiscombe and Grams (1976) and Marshall et al. (1995) investigated relationships between the asymmetry parameter g and β. For the Mie simulation of the aerosol scattering and absorption at ambient conditions,gwas also calculated for the particles
5
at ambient conditions. β(RH) were therefore calculated withgamb at 550 nm by using
the Henyey-Greenstein phase function (Wiscombe and Grams, 1976).
The calculated time series of the aerosol single scattering albedo ω0,550 nm,amb (= σsp,550 nm,amb/(σsp,550nm,amb+σap,550nm,amb)) and the uperscatter fraction (β550nm,amb)
at ambient conditions for both marine and continentally polluted cases are presented in
10
Fig. 14. The average ambientω0,550nm was generally higher during the marine period
(∼0.97±0.01) compared to the continentally polluted period (∼0.94±0.01). As the particles grow with increasing RH, the forward scattering increases too, which means that the back scattering and upscatter fraction decrease (Cheng et al., 2008). During marine periods, when the RH reached up to 92% (see Fig. 11),βdropped down from
15
∼0.23 to 0.18. The average values ofβ for marine and continentally polluted periods were comparable (∼0.21±0.02 and 0.21±0.01, respectively).
To estimate the aerosol direct radiative forcing an assumption was made that the aerosol particles were mixed homogenously within the PBL during daytime of the stud-ied period at the open Aegean Sea between Crete and continental Greece.
Accord-20
ingly, the calculated aerosol scattering and absorption coefficients at ambient condi-tions were simply integrated along the PBL height to retrieve ξsp(RH) and ξap(RH).
Figure 15 shows the calculated aerosol direct radiative forcing (∆Fr) during marine and
continentally polluted periods based on our simulations. The aerosol direct radiative forcings during both periods were negative indicating a net “cooling” effect. Most of
25
the time, the strength of forcing was dominated by the aerosol load, i.e. the higher the aerosol concentration, the stronger the forcing. ∆Fr of continentally polluted aerosols
ACPD
10, 25991–26044, 2010Atmospheric aerosol particles over the
Eastern Mediterranean
M. Stock et al.
Title Page
Abstract Introduction
Conclusions References
Tables Figures
◭ ◮
◭ ◮
Back Close
Full Screen / Esc
Printer-friendly Version Interactive Discussion
Discussion
P
a
per
|
Dis
cussion
P
a
per
|
Discussion
P
a
per
|
Discussio
n
P
a
per
|
−1.5 W m−2). The ∆Fr shows an anticorrelation with ambient RH during the marine
period (the higher the RH, the stronger the forcing), whereas the respective pattern between∆Fr and RH was not as clear during the continentally polluted period, when
the variation was mainly dominated by the changing aerosol concentration. This result is supported by the fact that marine aerosols are suspected to be highly hygroscopic
5
compared to continental anthropogenic aerosols. When RH reached 90% and more at the end of period A1, the∆Fr intensified to the same level as during continentally
polluted periods (ca.−4 W m−2) or even stronger (ca. −7 W m−2). It is worthwhile to note that another general reason for the remarkable negative forcings is the poorly absorbing nature of the particles, manifested by the low overall BC concentrations.
10
5 Conclusions
This paper presents physical and chemical parameters of aerosol particles collected between August and October 2005 in Finokalia on the northern coast of Crete, Greece. The central goal was to quantify the hygroscopic growth of atmospheric aerosol parti-cles over the Eastern Mediterranean and assess its potential influence on particle light
15
scattering at ambient relative humidty. The H-TDMA and H-DMA-APS instruments revealed the presence of three different hygroscopic particle groups both in the fine and coarse particle modes. At 90% relative humidity, the diameter growth factors of the more hygroscopic group ranged between 1.4 and 1.63. These growth factors in-creased monotonously from the mobility diameter (Dp) 30 nm to 350 nm. The values 20
encountered were within the broad range given by previous world-wide H-TMDA obser-vations (Swietlicki et al., 2008). A substantially lower growth factor was encountered for the more hygroscopic fraction atDp=1.2 µm, which rules out sea salt as the only
component present at this particle diameter.
The measurement period was separated into four consecutive time periods (A1–A4)
25
ACPD
10, 25991–26044, 2010Atmospheric aerosol particles over the
Eastern Mediterranean
M. Stock et al.
Title Page
Abstract Introduction
Conclusions References
Tables Figures
◭ ◮
◭ ◮
Back Close
Full Screen / Esc
Printer-friendly Version Interactive Discussion
Discussion
P
a
per
|
Dis
cussion
P
a
per
|
Discussion
P
a
per
|
Discussio
n
P
a
per
|
Sea while the two continentally-polluted air masses (A2 and A4) had passed over southeastern Europe and the Black Sea. The differences between these air masses could be clearly seen in the H-TMDA data. Clean marine air masses showed higher values of soluble particle volume fraction (about 80%) than continentally-influenced air masses (60%) in accumulation mode range. These differences in hygroscopicity
pa-5
rameters were supported by differences in chemical particle composition (more organic matter in continentally-influenced air), as determined from impactor samples.
In the second part of our study, the measured particle hygroscopic growth factors were used to simulate aerosol light scattering at ambient conditions. Generally, a pronounced enhancement of particle light scattering due to the particle’s hygroscopic
10
water uptake was found both for the marine and continentally-polluted cases. When the marine air masses dominated at Finokalia, the scattering enhancement factorξsp
(80%) ranged between 2.7 and 3.5, close to the values anticipated for sea-salt par-ticles. At extremely high RH, the simulated amplification of scattering due to water uptake during the marine periods was calculated to be as large as a factor of 5 at RH
15
90% and 7 to 8 at RH∼95%.
Still, the differences inξspbetween marine and continentally-polluted cases are
sig-nificant. During the continentally-polluted case theξspwere always much smaller than
those during the marine case, regardless of the variation in RH. Also, the amplification rate of scattering with increasing RH during the continentally-polluted case was lower
20
than that of the marine case. At RH 90%, theξspduring the continentally-polluted
pe-riod was less than 3, whereas the respective growth during the marine pepe-riod reached up to about a factor of 5. Theξsp(80%) for the continentally-polluted case were found to
be higher than those reported for polluted marine aerosols and anthropogenic aerosols in other studies. This may indicate a relatively larger influence of marine aerosols even
25