www.atmos-chem-phys.net/14/7213/2014/ doi:10.5194/acp-14-7213-2014
© Author(s) 2014. CC Attribution 3.0 License.
Radiative signature of absorbing aerosol over the eastern
Mediterranean basin
A. K. Mishra1, K. Klingmueller2, E. Fredj1, J. Lelieveld3, Y. Rudich1, and I. Koren1
1Department of Earth and Planetary Sciences, Weizmann Institute of Science, Rehovot 76100, Israel 2The Cyprus Institute, P.O. Box 27456, 1645 Nicosia, Cyprus
3Max Planck Institute for Chemistry, P.O. Box 3060, 55020 Mainz, Germany
Correspondence to:Y. Rudich ([email protected]) and I. Koren ([email protected]) Received: 10 January 2014 – Published in Atmos. Chem. Phys. Discuss.: 24 January 2014
Revised: 7 May 2014 – Accepted: 28 May 2014 – Published: 16 July 2014
Abstract. The effects of absorbing aerosols on the at-mospheric radiation budget and dynamics over the east-ern Mediterranean region are studied using satellites and ground-based observations, and radiative transfer model calculations, under summer conditions. Climatology of aerosol optical depth (AOD), single scattering albedo (SSA) and size parameters were analyzed using multi-year (1999–2012) observations from Moderate Resolution Imaging Spectroradiometer (MODIS), Multi-angle Imag-ing SpectroRadiometer (MISR) and AErosol RObotic NET-work (AERONET). Cloud-Aerosol Lidar with Orthogo-nal Polarization (CALIOP)-derived aerosol vertical dis-tributions and their classifications are used to calculate the AOD of four dominant aerosol types: dust, polluted dust, polluted continental, and marine aerosol over the re-gion. The seasonal mean (June–August 2010) AODs are 0.22±0.02, 0.11±0.04, 0.10±0.04 and 0.06±0.01 for polluted dust, polluted continental, dust and marine aerosol, respectively. Changes in the atmospheric temperature pro-file as a function of absorbing aerosol loading were de-rived for the same period using observations from the AIRS satellite. We inferred heating rates in the aerosol layer of ∼1.7±0.8 K day−1 between 925 and 850 hPa, which is attributed to aerosol absorption of incoming solar radi-ation. Radiative transfer model (RTM) calculations show significant atmospheric warming for dominant absorbing aerosol over the region. A maximum atmospheric forc-ing of +16.7±7.9 Wm−2 is calculated in the case of
pol-luted dust, followed by dust (+9.4±4.9 Wm−2) and pol-luted continental (+6.4±4.5 Wm−2). RTM-derived heating rate profiles for dominant absorbing aerosol show warming
of 0.1–0.9 K day−1in the aerosol layer (< 3.0 km altitudes), which primarily depend on AODs of the different aerosol types. Diabatic heating due to absorbing aerosol stabilizes the lower atmosphere, which could significantly reduce the atmospheric ventilation. These conditions can enhance the “pollution pool” over the eastern Mediterranean.
1 Introduction
These results call for more studies on the possible effects of absorbing aerosol over other climatically sensitive regions of the world.
The Mediterranean basin is a crossroad of different aerosol types (Lelieveld et al., 2002; Markowicz et al., 2002), which makes it an ideal natural laboratory to study the effect of different types of absorbing aerosol on the regional and lo-cal radiation budget and the consequences for atmosphere dynamics in the region. In general, this region is signifi-cantly impacted by variety of aerosol types including mineral dust from Africa and the Middle East, pollution from Europe and nearby coastal regions, and background marine aerosol (Moulin et al., 1998; Lelieveld et al., 2002; Gerasopoulos et al., 2006; Erel et al., 2006; Di Iorio et al., 2009). The season-ality of aerosol types over the basin (Vrekoussis et al., 2005; Pace et al., 2006; Marey et al., 2011) calls for investigation of the contribution of absorbing aerosols to total aerosol ra-diative forcing. Moreover, the absorption of incoming solar radiation by aerosols is greatly enhanced during the summer cloud-free conditions due to the intense solar radiation. Mal-let et al. (2013) recently reported the dominance of absorbing aerosol over the eastern part as compared to the western part of the basin during the summer season, indicating that the ab-sorbing nature of the aerosol is dominant during summer. Ab-sorbing aerosols were shown to increase the absorption of so-lar radiation in the atmospheric column (+11.1 Wm−2)and reduce the surface radiation (−16.5 Wm−2)inducing signif-icant atmospheric warming and surface cooling over the re-gion (Papadimas et al., 2012).
Markowicz et al. (2002) found that the daily averaged atmospheric warming (+11.3 Wm−2) and surface cooling
(−17.9 Wm−2)by summertime absorbing aerosol over the
Mediterranean are similar to the highly absorbing south Asian haze observed over the Arabian Sea. Significant neg-ative radineg-ative forcing at the surface has also been reported in dust dominant (−70.8 Wm−2) and pollution dominant (−39.1 Wm−2)case studies (Meloni et al., 2003). Di Sarra et al. (2008) estimated that the average daily forcing (at the surface) at the summer solstice and equinox for desert dust is−30 and−24 Wm−2, respectively. Numerous other stud-ies have also emphasized the significant role of absorbing aerosol over the Mediterranean region (Kazadzis et al., 2009; Santese et al., 2010; Di Biagio et al., 2010). Nevertheless, the inferences of these studies (atmospheric warming and surface cooling due to absorbing aerosol) are derived from the calculation of direct radiative forcing of aerosol using radiative transfer models mainly focused over the Mediter-ranean island of Lampedusa, Crete and some southern Euro-pean countries. To the best of our knowledge there have been no direct measurement of absorbing aerosol’s effect on the atmospheric temperature profile (i.e. change in atmospheric stability due to absorbing aerosol loading) over the region nor attribution of it to different aerosol types.
Given the importance of the strong atmospheric absorp-tion in the eastern Mediterranean basin, we have conducted
a comprehensive study in order to characterize the effects of atmospheric absorption of the different aerosol types on the atmospheric stability and the resulting climatic effects over the region. To that end, long-term climatology (∼10 year) of aerosol optical (extinction/absorption) and microphysical properties (size parameters) has been established for the east-ern Mediterranean. The effect of absorbing aerosol on tro-pospheric atmospheric stability has been studied using the state of the art remote sensing methodology (satellite mea-sure of aerosol loading and temperature profile). Finally, the observed properties of different aerosol types have been used in a radiative transfer model to estimate the resulting climate effects.
2 Methodology
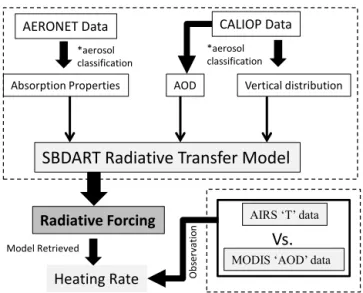
Combined analyses of multiple data sets, derived from satel-lite, ground based measurements and radiative transfer model results, are used in this study. We focused on the eastern Mediterranean between 24.5 to 34.5◦E and 32.5 to 35.5◦N. The rectangular box over the eastern Mediterranean basin in Fig. 1 represents the region of interest (ROI) for the present study. The analyzed ROI (area encompasses ∼5000 km2) has been chosen due to (1) focus on the eastern part of the basin which is significantly impacted by near and distant variable aerosol sources (Vrekoussis et al., 2005; Melin and Zibordi, 2005; Dermian et al., 2006; Basart et al., 2009) and (2) reliability of the satellite products over the marine re-gions (surface albedo effect). The flow chart of methodology is given in Fig. 2 which is explained as follows:
Monthly averaged (2002–2012) Moderate Resolution Imaging Spectroradiometer (MODIS; 1◦×1◦) and
Multi-angle Imaging SpectroRadiometer (MISR; 0.5◦×0.5◦) level 3 derived aerosol properties (Diner et al., 1998; Kahn et al., 2005; Levy et al., 2007; Remer et al., 2008) have been used to study the long-term climatology over ROI. We have also used 1◦×1◦gridded MODIS-derived daily averaged aerosol op-tical depth (AOD at 550 nm) and fine fraction (ff) along with the Atmospheric Infra-Red Sounder (AIRS)-derived tem-perature (1◦×1◦spatial resolution) at four pressure levels: 1000, 925, 850 and 700 hPa (Aumann et al., 2003; Diao et al., 2013) to analyze the absorption effect of aerosol on at-mospheric stability. More details on accuracy and validation of AIRS temperature product can be found elsewhere (Davidi et al., 2009, and references therein). The AIRS temperature data are sorted according to AOD and divided into equally spaced bins of AOD. Both MODIS and AIRS fly on the Aqua platform (∼01:30 p.m. LT), whereas MISR is on board Terra platform (∼10:30 a.m. LT).
-10 0 10 20 30 40 50 20
25 30 35 40 45 50
Dust Affected Sites
U-I Pollution Dominated Sites Selected box for analyses in Eastern Mediterranean
Malaga Athens
Thessaloniki
Messina
Sde Boker Nes Ziona Erdemili
Forth Crete Blida
Granda
Burjassot Oristano Potenza Lecce Rome
Barcelona Avignon
Ispra
Villefranche Moldova
Ersa Toulon
Modena
Lampedusa
Figure 1.Classification of AERONET sites based on dominant aerosol types, which are likely to affect aerosol properties over the Mediter-ranean region. Red circles are used for dust affected sites and blue circles are used for urban-industrial (U-I) pollution dominated sites. Sites were selected based on data volume, geographic location, and primary aerosol source region. The rectangular box in the eastern Mediter-ranean presents our region of interest (ROI). The different color curved arrows show the schematic wind trajectories at different altitudes/time period during the summer season, 2010. The black arrows show transport of pollution from Europe, whereas light brown and dark brown show transport of dust particles from African and Arabian deserts, respectively.
SBDART Radiative Transfer Model
AERONET Data CALIOP Data
*aerosol classification
Absorption Properties AOD Vertical distribution
*aerosol classification
Radiative Forcing
Heating Rate
Model Retrieved
AIRS ‘T’ data
MODIS ‘AOD’ data
Vs.
Ob
ser
vat
io
n
Figure 2. Flow chart of the methodology. The explanations are given in text. *Aerosol classification: aerosols are classified as dust, polluted dust (mixed aerosol), and polluted continental (pollution) classes. All optical and microphysical properties are derived for each class of aerosols.
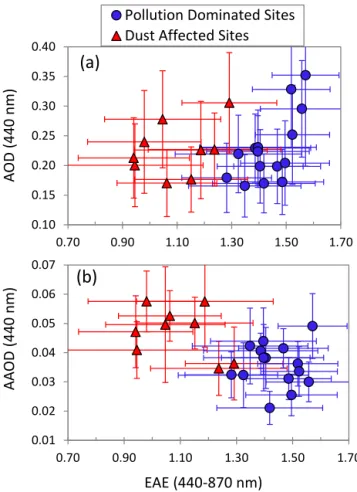
asymmetry parameter (ASYM) at four wavelengths (440, 675, 870 and 1020 nm). Following Russell et al. (2010), aerosol absorption optical depth (AAOD=[1−SSA]·AOD) follows a relatively smooth decrease with wavelength (λ) and can be approximated with power-law wavelength de-pendence (AAOD∼λ−AAE). By convention, absorption Angstrom exponent (AAE) is the negative of the slope of the absorption on a log–log plot. In the same manner, the
ex-tinction Angstrom exponent (EAE) is calculated by power-law wavelength approximation (AOD∼λ−EAE), which is used as a size parameter of aerosol particles. The details of the AERONET products and associated error analyses can be found elsewhere (Holben et al., 1998; Eck et al., 1999, 2013; Dubovik et al., 2000; Sinyuk et al., 2012). The selec-tion of AERONET sites was based on extensive data vol-ume (> 2.5 year) and geographical locations among aerosol source regions around the Mediterranean basin (Fig. 1). Each site is classified (following Mallet et al., 2013) as ei-ther dust affected or pollution dominated site based on the source regions and known seasonal changes in aerosol types over these regions (Holben et al., 2001; Tanre et al., 2001; Dubovik et al., 2002; Reid et al., 2003; Melin and Zibordi, 2005; Derimian et al., 2006; Eck et al., 2010; Giles et al., 2012; Mallet et al., 2013; Marconi et al., 2014). Dust af-fected sites are depicted by red circles and pollution domi-nated sites are shown by blue circles in Fig. 1. More details on site classification can be found in Mallet et al. (2013). Figure 3 plots averaged level 2 AOD440and AAOD440 with
EAE440−870for all 24 sites. Red triangle represents the dust
0.10 0.15 0.20 0.25 0.30 0.35 0.40
0.70 0.90 1.10 1.30 1.50 1.70
Pollution Dominated Sites Dust Affected Sites
0.01 0.02 0.03 0.04 0.05 0.06 0.07
0.70 0.90 1.10 1.30 1.50 1.70
A
OD
(
440
n
m)
AA
OD
(
440
n
m)
EAE (440-870 nm)
(a)
(b)
Figure 3.Average AERONET level 2 (entire data sets) scatter plots between(a)AOD vs. EAE and(b)AAOD vs. EAE for the 24 se-lected sites in and around the Mediterranean basin. The red trian-gles represent dust affected sites and blue circles show pollution dominated sites. The error bars represent±σ/2, whereσ is stan-dard deviation of AERONET level 2 (entire) data sets for respective sites.
all dust-dominated sites data with EAE < 0.6. Dust model for individual sites can be seen in Fig. S1a in the Supple-ment. For classification as polluted dust (mixed aerosol) we included Athens and Messina (possible mixing sites) with all other dust dominated sites and selected AERONET data with 0.7 < EAE < 1.1. Pollution (polluted continental) has been characterized as EAE > 1.4 for all pollution dominated sites. Polluted continental model for individual sites can be seen in Fig. S1b in the Supplement. The optical models for all three different absorbing aerosol types are presented for sum-mer season (see Sect. 3.1). We treat DJF (December-January-February) as winter, MAM (March-April-May) as spring, JJA (June-July-August) as summer, and SON (September-October-November) as autumn in this study.
In addition, we used the particle extinction coefficient (σextat 532 nm; L2_V3.01 product) profiles from the
Cloud-Aerosol Lidar with Orthogonal Polarization (CALIOP) on-board the Cloud-Aerosol Lidar and Infrared Pathfinder Satel-lite Observations (CALIPSO), to estimate the vertical
pro-files of the different aerosol types (Winker et al., 2003; Young and Vaughan, 2009). The CALIOP aerosol identification al-gorithm (Omar et al., 2009) also provides details about the vertical profile of the different aerosol types. A total of 73 CALIPSO overpasses (37-day and 36-night time) over the ROI have been analyzed in this study. Although daytime profiles have relatively higher noise than nighttime profiles, both profiles have been used to maximize the number of ob-servation in our study. To minimize possible artifacts due to cloud contamination in the extinction signals, a standard scheme (Winker et al., 2013; Fig. S2 in the Supplement) has been used to screen out all spurious points in our data sets (about 5 % data was rejected). CALIOP-generated ex-tinction profiles have been used in the calculation of AOD (τ=Rz2
z1 σextdz) for various types of aerosol over the ROI.
We performed clear-sky solar irradiance, covers both short wavelength and long wavelength (0.25–20 µm), computa-tions using the Santa Barbara DISORT Atmospheric Ra-diative Transfer (SBDART) code (Ricchiazzi et al., 1998), which uses the discrete ordinates radiative transfer (DIS-ORT) integration of the radiative transfer equations (Stamnes et al., 1988). This code includes multiple scattering in a vertically inhomogeneous, non-isothermal plane-parallel medium, and is computationally efficient in resolving the radiative transfer equation (McComiskey et al., 2008). The SBDART characterizes atmospheric aerosol radiative effects using as input the solar zenith angle (00< sza < 900with 50 interval, and sza=600 is used for averaged daytime calcu-lation), the spectral AOD, the spectral SSA, and the spectral ASYM.
indices integrated over the wavelengths range of the obser-vations (440–1020 nm) agree with the observed AERONET values. We obtain the following mean volume fractions: 79.6 % mineral dust, 20.4 % water (dust); 38.5 % ammonium sulphate, 1.7 % black carbon, 59.8 % water (polluted conti-nental); 60 % mineral dust, 0.5 % black carbon, 39.5 % water (polluted dust). Using these volume fractions combined with the refractive indices of the components and the observed particle size distributions, we compute the aerosol optical properties. Scattnlay (Peña and Pal, 2009) Mie code is em-ployed for calculations of optical properties (AOD, AAOD, SSA, ASYM). To obtain an error estimate, the standard de-viation of the observations is propagated using jackknife re-sampling (Wu, 1986). The output AODs for each aerosol type is scaled with CALIOP-derived AOD.
The spectral SSA and the spectral ASYM are obtained from the abovementioned procedure for different dominant aerosol types, whereas the vertical distributions of aerosol types and AOD are supplied from CALIOP measurements. The atmospheric model (McClatchey et al., 1972; Ricchi-azzi et al., 1998) input was set as “Mid-Latitude Summer Atmosphere”. SBDART characterized “ocean water” surface type was used to parameterize the spectral albedo of surface (Tanré et al., 1990; Ricchiazzi et al., 1998). The instanta-neous values of aerosol radiative forcing (1Faer)have been
derived as1Faer=(F↓−F↑)– (F0↓−F0↑), where F and
F0 denote the global irradiances with aerosol and without
aerosol, respectively. The arrows indicate the direction of the global irradiances (down and up).
3 Results and discussion 3.1 Aerosol climatology
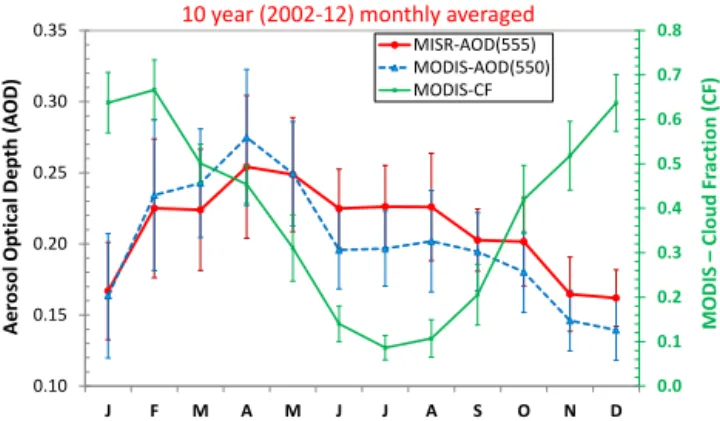
Figure 4 shows the 10 year (2002–2012) monthly aver-aged variation of MODIS- and MISR-derived aerosol opti-cal depth and MODIS-derived cloud fraction (CF) over the ROI. Both instruments show similar trend of aerosol loading with some discrepancies in the averaged values. Possible ex-planations for these discrepancies in AOD are (1) the instru-ments’ footpaths cover different areas; (2) the overpass time of the two platforms is different; and (3) technical reasons such as different retrieval algorithms (Kahn et al., 2007), dif-ferent processing methods (Abdou et al., 2005) and calibra-tion. A detailed discussion about aerosol measurement dif-ferences between these two sensors can be found elsewhere (Kahn et al., 2007; Xiao et al., 2009; Shi et al., 2011). A significant seasonal variability in aerosol loading with max-imum in spring (April) and minmax-imum in winter (more ex-actly from November to January) is found over the ROI. The ten-year average seasonal mean AODs are 0.24–0.25, 0.20–0.23, 0.17–0.19 and 0.17–0.18 in spring, summer, au-tumn and winter, respectively. This seasonal dependence is explained by the seasonal variability in the major sources of
0.0 0.1 0.2 0.3 0.4 0.5 0.6 0.7 0.8
0.10 0.15 0.20 0.25 0.30 0.35
J F M A M J J A S O N D
MISR-AOD(555) MODIS-AOD(550) MODIS-CF 10 year (2002-12) monthly averaged
Ae
ros
ol
Op
tic
al
D
e
p
th
(A
OD)
MO
D
IS
–
Clou
d
Fr
actio
n
(CF)
Figure 4.Seasonal variation of 10 year (2002–2012) monthly av-eraged aerosol optical depth (AOD) and cloud fraction (CF) over the ROI observed from MODIS and MISR. Error bars represent the standard deviation of inter-annual variability.
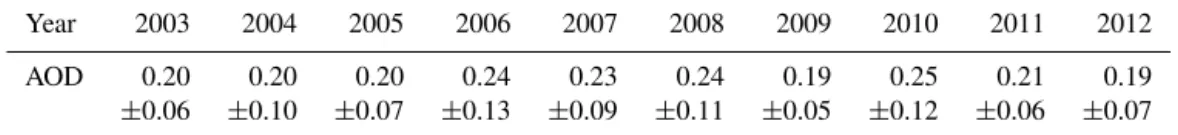
aerosol loading over the Mediterranean that is a function of synoptic meteorology (Lelieveld et al., 2002; Vrekoussis et al., 2005; Pace et al., 2006; Kallos et al., 2007). Among all seasons, the summertime eastern Mediterranean is character-ized by a relatively minor cloud fraction (< 0.15) and small AOD variability at intra-seasonal scale (Fig. 4). Due to the cloud-free conditions, high radiation intensity and less vari-ability in aerosol loading during the summer, we have chosen this season to study the climatic effects of absorbing aerosol over the ROI. The another reason for choosing only sum-mer season is that there are much less AERONET level-2 ab-sorption data during other seasons (Mallet et al., 2013). The seasonal (summer) mean of AOD over the ROI for 10 years (2003–2012) are given in Table 1. The summertime mean AODs vary between 0.19 and 0.25 in the span of 10 years. The maximum and minimum AOD have been observed in 2010 and 2012, respectively. The ten-year averaged (2003– 2012) AOD is 0.21±0.02 in summer season over the ROI.
The summertime AERONET-derived absorption and size properties for each site are presented in Table 2. The aver-age AAE values are in the ranges of 0.95–2.24 and 0.93– 1.58 for dust affected and pollution dominated sites respec-tively. Relatively higher values of AAE (2.24) for Lampedusa as compared to other dust dominated sites could be under-stood as the island is in close proximity to North Africa and could be more affected by dust rather than pollution from Europe. However, the explanation of this high AAE value of Lampedusa needs more deep introspection. Relatively lower values of AAE and higher values of EAE of Erdemli, Sede Boker and Nes Ziona amidst other dust affected sites can be understood as these sites are more affected by pollution than dust during summer season (also manifested by larger SSA440 values). The size parameter (EAE) shows lower
Table 1.MODIS-derived summertime mean AOD at 550 nm (±standard deviation) within the aerosol layer over the ROI for 10 years (2003–2012).
Year 2003 2004 2005 2006 2007 2008 2009 2010 2011 2012
AOD 0.20 0.20 0.20 0.24 0.23 0.24 0.19 0.25 0.21 0.19
±0.06 ±0.10 ±0.07 ±0.13 ±0.09 ±0.11 ±0.05 ±0.12 ±0.06 ±0.07
et al., 2002; Giles et al., 2012). The pollution dominated sites show slightly higher values of SSA440in the range of 0.91–
0.95±0.04 except Potenza. Recently, Mallet et al. (2013) have shown that the Mediterranean urban-industrial aerosol appears moderately absorbing (SSA440∼0.94–0.95±0.04)
in most cases except for Rome and Athens (SSA440∼0.89–
0.90±0.04) where the aerosol appears to be more absorbing. The differences of optical properties in this study and Mallet et al. (2013) can be understood as Table 2 depicts the aver-aged properties for summer season only whereas Mallet et al. (2013) consider the entire data set. However, Table S1 in the Supplement well corroborates with the findings of Mallet et al. (2013). The role of dust in summer could be seen by comparing the summer means (Table 2) and overall means (Table S1 in the Supplement) of EAE for dust affected sites situated in western basin (Blida, Malaga, Granada etc.). Dust events during summer are likely to decrease the EAE values over these sites. However, the eastern basin sites are more in-fluenced by pollution as seen from increased values of EAE in summer as compared to overall means.
As we can see from the Table 2 that the optical proper-ties of different sites in two different categories shows great variability. We have characterized dust (EAE < 0.6), polluted dust (0.7 < EAE < 1.1) and polluted continental (EAE > 1.4) aerosol using the size parameter to separate these three classes as discussed in the methodology section. The pos-sible reason for this variability can be understood since the Mediterranean basin is a cross-road of different aerosol types that mix in variable concentrations at different locations. Fig-ure 5 presents the spectral variation of the summertime av-eraged SSA, AAOD, ASYM and volume size distribution of dominant absorbing aerosol types over the Mediterranean basin. All four properties show three different classes of aerosol optical model with possible variance. The standard deviation in SSA at different wavelengths shows relatively higher values for polluted dust and pollution aerosols. How-ever, the spectral shapes of SSA manifest the differences in absorption properties of these three different aerosol classes which can be also seen in AAOD plot. The spectral shape of the SSA for different aerosol types shows similar variation as reported in Russell et al. (2010). As SSA is an intrinsic property of aerosol and does not depend on the loading, it is used to separate the absorbing effect of dust, polluted dust and pollution in radiative transfer scheme (Sect. 3.4). The optical properties for all three aerosol types in 0.25–20 µm
wavelength region (as discussed in methodology section) are given in Fig. S3 in the Supplement.
3.2 Spatial and vertical distributions of aerosol during summer
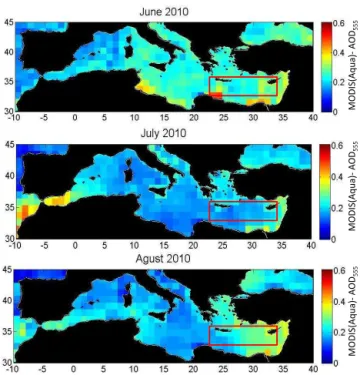
As summer 2010 shows all range of AOD (from low to high values), it has been chosen for the analyses over the eastern Mediterranean basin. The seasonal mean of MODIS-derived AOD is 0.25±0.12 over the ROI during summer 2010. Fig-ure 6 shows the intra-seasonal variability of spatial distri-bution over the Mediterranean basin during summer 2010. In terms of AOD spatial variability, all three months show significantly different distribution of aerosol loading across the basin. In June, almost the entire basin shows signifi-cantly higher aerosol loading (0.2–0.5) with a maximum in the southwest part of the basin, whereas in July and August, the maximum aerosol loading is concentrated in the eastern part of the basin. Over the eastern basin, June and August are associated with higher aerosol loading (AOD > 0.2) as compared to July (AOD < 0.2). The MODIS-retrieved fine fraction (ff) provides a good idea about the size of parti-cles suspended in the atmosphere. Figure 7 shows the rel-ative frequency of occurrence of ff in all three months of summer 2010. The frequency of occurrence of higher val-ues (> 0.5) of ff increases as the months progressed from June to August, indicating the increase in fine mode parti-cles as the summer progressed. This intra-seasonal spatial variability can be explained as different air masses that come from Africa, Europe or the Middle East significantly change the aerosol properties over the basin. In general, the cen-tral and eastern Mediterranean basin is impacted by frequent dust events from Africa during June that significantly de-crease during the rest of the season (Lelieveld et al., 2002). Moulin et al. (1998) have nicely presented the dust seasonal-ity over the Mediterranean basin (west, central and eastern). They have found higher dust-AOD in spring (0.14±0.05) than that in summer (0.10±0.04) for eastern basin, whereas central and western basin shows higher dust loading in sum-mer (0.18±0.06 and 0.14±0.04, respectively) than that in spring (0.15±0.06 and 0.10±0.04, respectively) over the period 1983–1994.
Table 2.Summertime averaged optical properties of (level 2) of Mediterranean AERONET sites used in this study.Nrepresents the number of level 2 observation days during summer season used in analyses. The subscripts of parameters name show wavelength in nm.
Site Name N AAE440−870 EAE440−870 AOD440 SSA440 AAOD440 ASYM440
Pollution dominated sites
Athens 306 1.26±0.33 1.52±0.35 0.26±0.11 0.91±0.03 0.04±0.01 0.70±0.02 Avignon 670 1.33±0.49 1.47±0.33 0.21±0.13 0.91±0.03 0.04±0.01 0.69±0.02 Barcelona 315 1.29±0.57 1.34±0.34 0.26±0.12 0.91±0.04 0.05±0.02 0.70±0.02 Burjassot 349 1.37±0.45 1.21±0.34 0.25±0.11 0.93±0.03 0.03±0.02 0.71±0.02 Ersa 232 1.43±0.58 1.37±0.36 0.19±0.10 0.95±0.02 0.02±0.01 0.69±0.02 Ispra 462 1.33±0.28 1.62±0.22 0.41±0.32 0.93±0.03 0.04±0.02 0.71±0.03 Lecce 661 1.58±0.48 1.44±0.45 0.26±0.13 0.92±0.04 0.04±0.02 0.68±0.03 Messina 284 1.31±0.45 1.30±0.49 0.26±0.12 0.94±0.03 0.03±0.01 0.70±0.03 Modena 240 1.35±0.29 1.51±0.33 0.35±0.19 0.93±0.03 0.03±0.01 0.70±0.03 Moldova 541 1.22±0.23 1.63±0.24 0.29±0.16 0.94±0.03 0.03±0.02 0.70±0.02 Potenza 183 1.23±0.79 1.23±0.41 0.20±0.11 0.89±0.06 0.05±0.03 0.69±0.03 Rome 533 1.56±0.54 1.36±0.39 0.25±0.12 0.92±0.03 0.04±0.02 0.69±0.03 Thessaloniki 385 1.27±0.28 1.58±0.34 0.35±0.16 0.94±0.02 0.03±0.01 0.70±0.02 Toulon 365 1.34±0.43 1.53±0.33 0.20±0.11 0.94±0.02 0.03±0.01 0.69±0.02 Villefranche 353 0.93±0.39 1.55±0.34 0.25±0.15 0.95±0.02 0.03±0.01 0.70±0.02
Dust affected sites
Blida 332 2.02±0.39 0.82±0.41 0.32±0.17 0.89±0.02 0.06±0.02 0.72±0.03 Malaga 302 1.55±0.45 0.88±0.34 0.23±0.13 0.89±0.03 0.05±0.02 0.72±0.03 Granada 480 1.78±0.44 0.95±0.39 0.21±0.11 0.90±0.02 0.05±0.01 0.70±0.03 Forth Crete 483 1.57±0.52 1.39±0.42 0.24±0.10 0.94±0.03 0.03±0.01 0.70±0.02 Lampedusa 276 2.24±0.61 1.01±0.56 0.26±0.14 0.91±0.03 0.04±0.02 0.71±0.03 Erdemli 536 0.95±0.31 1.36±0.24 0.37±0.16 0.94±0.03 0.03±0.02 0.71±0.02 Sde Boker 1103 1.15±0.52 1.07±0.33 0.22±0.10 0.92±0.02 0.04±0.01 0.72±0.02 Nes Ziona 432 1.02±0.41 1.23±0.32 0.30±0.14 0.93±0.04 0.04±0.02 0.72±0.03 Oristano 232 1.52±0.63 1.17±0.50 0.28±0.17 0.89±0.02 0.06±0.02 0.71±0.03
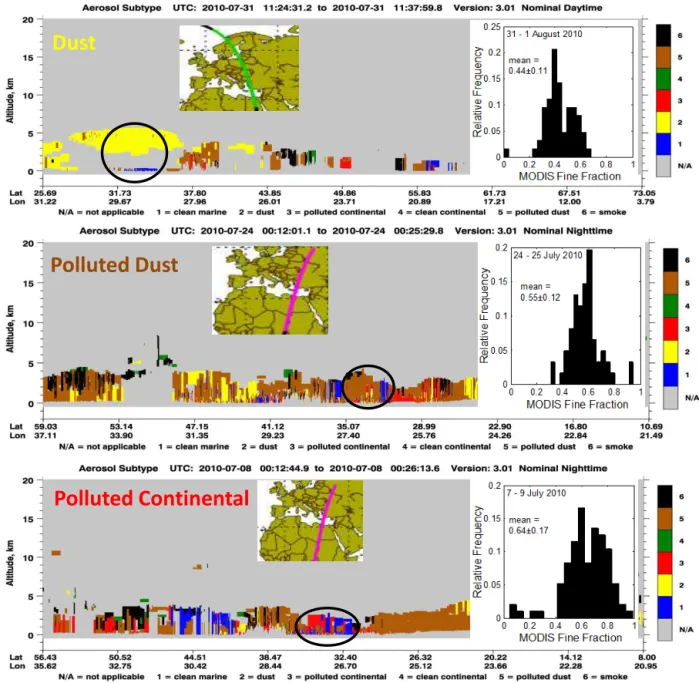
significantly above 1 km altitudes. June and August show el-evated (up to 2–5 km) aerosol supporting the earlier obser-vation from MODIS measurements (long-range transport of dust from the African and the Arabian regions). CALIOP-derived AOD also corroborated the MODIS observations i.e. significantly higher AOD in August (0.25±0.12) and June (0.19±0.09) as compared to July (0.16±0.10). Recently Ma et al. (2013) reported that CALIPSO AOD is significantly lower than that of MODIS AOD over the major dust source regions (Sahara, Gobi etc.) of the world. However, the dif-ference between these CALIOP- and MODIS-derived AODs is minimal (∼0.05–0.07) over the Mediterranean basin dur-ing the summer season, which is also reflected in the present study. Oo and Holz (2011) demonstrated underestimation of AOD in oceanic regions in which CALIOP identifies clean marine, but the fine mode fraction from the MODIS sug-gests a mixture of fine and coarse aerosols. Several attempts have been made to compare the CALIOP aerosol classifica-tion with AERONET and airborne High Spectral Resoluclassifica-tion Lidar (HSRL-1) (Mielonen et al., 2009; Burton et al., 2013). While mentioning the good agreement in 63–80 % of the cases between the most common aerosol types, these stud-ies have warned against uncritical use of CALIOP
classifica-tion in scientific studies. Before using the CALIOP aerosol classification in our study, we performed a cross check us-ing MODIS ff over the ROI. Figure 9 shows the assess-ment of MODIS ff for three different scenarios of dominant aerosol loading (dust, polluted dust and polluted continen-tal) over the ROI. The mean values of ff are 0.44±0.11, 0.55±0.12 and 0.64±0.17 for the dust, polluted dust and polluted continental dominant aerosol classes, respectively. Earlier studies have reported MODIS ff in the range of 0.25– 0.45 for marine aerosols, 0.37–0.51 for dust, and 0.83–0.92 for anthropogenic aerosols over the various oceanic regions of the world (Kaufman et al., 2005; Yu et al., 2009; Jones and Christopher, 2007, 2011). Relatively lower values of ff are found in our cases (as compared to above-mentioned studies). These could be understood as marine aerosols are present in all three cases in our study (Fig. 9, black cir-cles), which would likely decrease the average ff values for all three cases. Therefore, distribution of ff as compared to other above-mentioned studies is in close agreement with the aerosol classification for this present study.
400 500 600 700 800 900 1000 1100 0.86
0.88 0.9 0.92 0.94 0.96 0.98 1
Wavelength [nm]
SSA
Dust Polluted Continental Polluted Dust
400 500 600 700 800 900 1000 1100
0 0.02 0.04 0.06 0.08
Wavelength [nm]
A
A
O
D
400 500 600 700 800 900 1000 1100
0.5 0.55 0.6 0.65 0.7 0.75 0.8
Wavelength [nm]
ASYM
10-2 10-1 100 101 102
0 0.05 0.1 0.15 0.2 0.25
Particle Radius, R [µm]
d
V
/d
ln
R
[
µ
m
3/µ
m
2]
Figure 5.Spectral dependence of multi-year/multi-site average single scattering albedo (SSA), absorption aerosol optical depth (AAOD), asymmetry parameter (ASYM) and volume size distribution for dust, polluted dust and polluted continental over the Mediterranean basin. Total 259, 169 and 914 level 2 absorption data have been used to average for dust, polluted dust and polluted continental classes, respectively.
MO
DI
S(Aqu
a)
-A
O
D555
MO
DI
S(Aqu
a)
-A
O
D555
MODIS(Aqua)
-A
OD
555
Figure 6.Monthly mean AOD during June–August 2010 over the Mediterranean basin. Red rectangular boxes present the ROI.
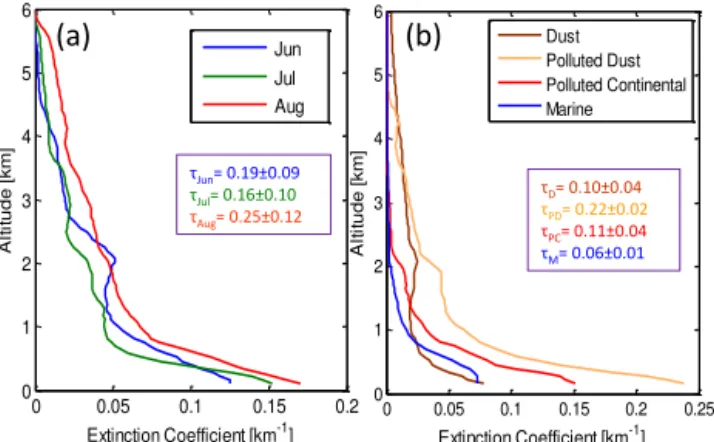
the Supplement). Dust and polluted dust aerosol are fre-quently found at higher (3–6 km) altitudes, whereas polluted continental and marine aerosol are located within bound-ary layer (below 1.0–2.0 km altitudes). The maximal ex-tinction has been shown by mixed aerosol (polluted dust
∼0.05–0.25 km−1) followed by pollution (polluted conti-nental ∼0.02–0.15 km−1) in the lower troposphere (be-low 2.0 km altitude). The vertical distributions of differ-ent aerosol types from this study are well corroborated with Nabat et al. (2013), which have nicely presented a 4-dimensional climatology of aerosol properties over the Mediterranean basin. The seasonal mean (2010 summer) AOD of different dominant aerosol types are 0.22±0.02, 0.11±0.04, 0.10±0.04 and 0.06±0.01 for polluted dust, polluted continental, dust and marine aerosol, respectively. The higher contribution from polluted dust (mixed pollution
+ dust) reflects the real scenario over the Mediterranean, where the probability of mixing of anthropogenic pollution and natural dust is found to reach a maximum during the summer season.
3.3 The effect of absorption on the atmospheric temperature profile
0 0.2 0.4 0.6 0.8 1 0 0.03 0.06 0.09 0.12 0.15 0.18
MODIS Fine Fraction
Re lat iv e F re q u e n c y
0 0.2 0.4 0.6 0.8 1
0 0.03 0.06 0.09 0.12 0.15 0.18 R e lat iv e Fr e q u e n c y
0 0.2 0.4 0.6 0.8 1
0 0.03 0.06 0.09 0.12 0.15 0.18 R e lat iv e Fr e q u e n c y
Eastern Mediterranean Sea
June 2010
July 2010
August 2010
Figure 7. Relative frequency of MODIS fine fraction (ff) occur-rence during June–August 2010 over the ROI.
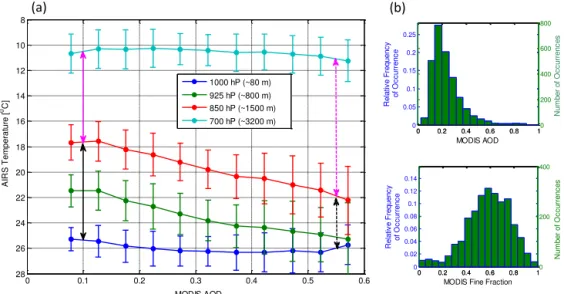
are approximated using atmospheric sounding data at Bet Dagan in the eastern Mediterranean (http://weather.uwyo. edu/upperair/sounding.html, Station number: 40179). As the AOD increases from the lowest bin (0.07) to the highest (0.58), there is an increase of ∼4◦C for 925 hPa (green) and 850 hPa (red) and no statistically significant changes (with respect to standard deviation) at 1000 hPa (blue) and 700 hPa (cyan). The increase in average temperature during high aerosol loading (AOD > 0.5) at 925 and 850 hPa can be attributed to enhanced heating due to absorbing particles in that layer. The CALIOP-derived aerosol vertical profiles (Fig. 8b) have also shown that the highest contributions of dominant aerosol are below 2 km altitude. The temperature difference between 850 and 1000 hPa level is a good mea-sure of stability in lower troposphere (Davidi et al., 2009). The mean temperature difference of∼8◦C (solid black
ar-0 0.05 0.1 0.15 0.2 0 1 2 3 4 5 6
Extinction Coefficient [km-1]
A lt it u d e [ km ] Jun Jul Aug
0 0.05 0.1 0.15 0.2 0.25
0 1 2 3 4 5 6
Extinction Coefficient [km-1]
A lt it u d e [ km ] Dust Polluted Dust Polluted Continental Marine
τD= 0.10±0.04 τPD= 0.22±0.02 τPC= 0.11±0.04
τM= 0.06±0.01
τJun= 0.19±0.09
τJul= 0.16±0.10
τAug= 0.25±0.12
(a) (b)
Figure 8.Vertical distribution of mean aerosol extinction coefficient for(a)June, July and August, and(b)different dominant aerosols during summer 2010. The calculated aerosol optical depths for re-spective extinction profiles are given in rere-spective colors. The stan-dard deviations of respective means are provided in supplementary materials (Fig. S4 in the Supplement).
row in Fig. 10a) in clean conditions (AOD∼0.08) between 1000 and 850 hPa is significantly lower than the standard adi-abatic lapse rate (∼14◦C for 1400 m). This indicates the
sta-ble atmosphere over the eastern Mediterranean. This aver-age temperature difference decreases twofold (∼4◦C, dot-ted black arrow in Fig. 10a) in the case of high aerosol loading (AOD∼0.58), indicating that the diabatic heating in the presence of absorbing aerosol substantially increased the already existing stability of the lower troposphere. How-ever, this role of absorbing aerosol is counteracted in the upper levels (between 850–700 hPa), where it adds instabil-ity to the already stable atmosphere (solid and dotted pink arrow in Fig. 10a). Fig. 10a shows that the difference be-tween the temperatures at 850 and 925 hPa is independent of aerosol loading, i.e. it is almost constant in the entire range of AOD (0.07 to 0.58). This observation suggests that the contribution of absorption from these two aerosol layers (at 850 and 925 hPa) is almost similar in magnitude. Figure S5 in the Supplement strengthened our abovementioned conclu-sion that the maximum observation due to absorbing aerosols (dust, polluted dust and polluted continental) occurs between
∼400 and∼2200 m altitude range with almost similar rel-ative frequency of occurrence. A similar effect of absorb-ing aerosol has been reported by Davidi et al. (2009, 2012), where they have found an increase of∼4◦C at 850 hPa in the case of smoke loading over the Amazon and∼5–6◦C in-crease in case of dust loading over the Atlantic. Ramanathan et al. (2001) have reported seasonal (JFM, 1999) and vertical averaged (0–3 km altitude) heating rate of∼0.3–0.6 K day−1
due to anthropogenic carbonaceous aerosols over the north-ern Indian Ocean region. Mineral dust layers have also shown heating rate of about 0.5 K day−1 over the Arabian Sea and
Polluted Continental
Polluted Dust
Dust
Figure 9. Assessment of CALIOP-derived aerosol classification (vertical feature mask: VFM) using MODIS fine fraction (ff) in three different cases of dust, polluted dust and polluted continental over the ROI. The relative frequency histogram of ff for each case is calculated over the ROI. Approximated latitudinal extent of ROI is shown by black circles for each case in VFM figure. The various colors of VFM represent different dominant aerosol types which are marked as integer number (1–6) in respective plots. The connotations of integer numbers are given at the bottom of each plot. The marine aerosols (blue color) are present in all three cases.
While this correlation between AIRS temperature and MODIS AOD is substantial with theoretical background re-lated to diabatic heating of absorbing aerosol, one can ques-tion the (1) AIRS artifact in temperature retrieval in case of dust (Maddy et al., 2012) and (2) meteorology-driven changes in temperature, especially in the case of dust out-breaks. Because of their large sizes (up to several microme-ter), dust particles are able to strongly interact with IR radia-tion and thus can affect the temperature retrieval in the ther-mal spectrum (Pierangelo et al., 2004; DeSouza-Machado et
0 0.2 0.4 0.6 0.8 1 0 0.02 0.04 0.06 0.08 0.1 0.12 0.14
MODIS Fine Fraction
R e la tiv e F re q u e n c y o f O c c u rre n c e
0 0.2 0.4 0.6 0.8 10
200 400 N u m b e r o f O c c u rre n c e s
0 0.2 0.4 0.6 0.8 1
0 0.05 0.1 0.15 0.2 0.25 MODIS AOD R e la tiv e F re q u e n c y o f O c c u rre n c e
0 0.2 0.4 0.6 0.8 10
200 400 600 800 N u m b e r o f O c c u rre n c e s
0 0.1 0.2 0.3 0.4 0.5 0.6
8 10 12 14 16 18 20 22 24 26 28 MODIS AOD A IR S T e m p e ra tu re [ 0C]
1000 hP (~80 m) 925 hP (~800 m) 850 hP (~1500 m) 700 hP (~3200 m)
(a) (b)
Figure 10. (a)MODIS AOD550vs. AIRS temperature at four different pressure levels (1000, 925, 850 and 700 hPa) for summer 2010. The vertical axis is in reverse order. The bold and dotted black arrows represent temperature differences between 850 and 1000 hPa levels (stability parameter) in cases of clean and hazy atmosphere, respectively. Similarly, the pink arrows show temperature differences between 700 and 850 hPa levels. The AIRS temperature data are sorted according to AOD and divided into equal spaced bins of 0.05 AOD550. Error bars
present the standard deviation of points in each bin.(b)Relative frequency distribution of occurrence (blue bar lines are relative frequency and green are number of occurrence, both are scaled) of AOD (upper panel) and ff (lower panel) for all observed data over the ROI.
different cases of MODIS ff (ff < 0.5 and ff > 0.5) in Fig. 11a. The number of sampled AOD pixels are comparably lower (around half) in case of ff < 0.5 than that of ff > 0.5 (Fig. 11b). The ff < 0.5 case associated with dust (left panel) shows a slightly cooler atmosphere (explanations are given below) than ff > 0.5 case (right panel) all along the profile, but the trend of d(T)/d(AOD) is quite similar in both cases (fine and coarse) and also represents the essence of Fig. 10a. From this analysis, it is clear that the observed perturbation in tempera-ture is apparent in both coarse (dust) and fine absorbing par-ticles (pollution). These observations further strengthen the conclusion that the temperature increase is solely attributed to diabatic heating by absorbing particles.
The plausible reason of cooler atmosphere in case ff < 0.5 could be explained by Fig. S6 in the Supplement. Figure S6a in the Supplement shows that the AOD occurrence associated with large particles is maximal in June as compared to other two later months or in other words June month is highly im-pacted by dust events as compared to rest of season. Also the mean temperature climatology shows a gradual increase as days progressed from June to August. The daily mean val-ues of AOD did not show any definite pattern with temper-ature except for a few events in June and August (marked as double headed arrow). All abovementioned analyses sug-gest that the coarse particles (dust events) dominant in early summer season which is also characterized by slightly lower atmospheric temperature. This could be a plausible reason of slightly lower atmospheric temperature in case of coarse particles (ff < 0.5) than that in fine particle case (ff > 0.5) in Fig. 11a.
3.4 Atmospheric heating due to different aerosol types: model assessment
The strong dependence of aerosol direct radiative forcing (ADRF) at top of the atmosphere (TOA) and at the surface (SRF) on solar zenith angle (SZA) has well observed by Boucher et al. (1998). In this study, the variation of radiative forcing of aerosol types (dust, polluted dust and polluted con-tinental) with solar zenith angle (SZA) at TOA, at SRF and in the atmosphere (ATM) are given in Fig. S7 in the Supple-ment. Our results agree with those of Boucher et al. (1998). In spite of the strong variability of ADRF (at TOA and SRF) with SZA, we used sza=600to show our results for daytime average (an approximation) because we compare our model assessment with the AIRS vs. MODIS analyses, which use instantaneous observations at 01:30 p.m. (LT) for each day. It is worth mentioning that using a single sza=600(that is close to the maximum instantaneous DRE (Direct Radiative Effect)) overestimates the calculated DRE as compared to co-sine of SZA weighted mean DRE at TOA and at SRF, but in the atmosphere (ATM) it will be slightly underestimated (Fig. S8 in the Supplement).
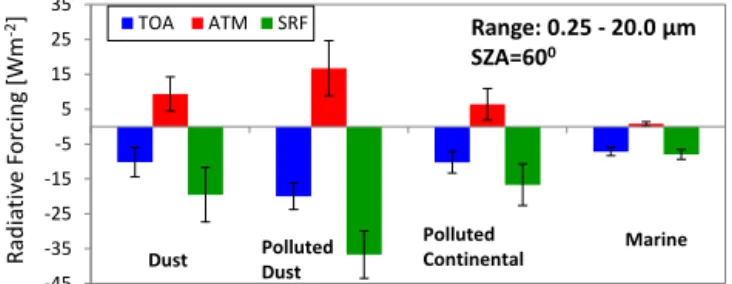
Figure 12 shows the clear-sky daytime averaged (SZA=600) aerosol radiative forcing (1Faer) of
0 0.2 0.4 0.6 0.8 1
0 0.05 0.1 0.15
MODIS AOD (ff<0.5)
R e la ti v e F re q u e n c y o f O c c u rr e n c e
0 0.2 0.4 0.6 0.8 10
50 100 150 200 N u m b e r o f O c c u rr e n c e s
0 0.2 0.4 0.6
0 0.05 0.1 0.15 0.2 0.25
MODIS AOD (ff>0.5)
R e la ti v e F re q u e n c y o f O c c u rr e n c e
0 0.2 0.4 0.60
100 200 300 400 500 N u m b e r o f O c c u rr e n c e s
0.1 0.2 0.3 0.4 0.5 8 10 12 14 16 18 20 22 24 26 28 MODIS AOD A IR S T [ 0 C]
1000 hP (~80 m) 925 hP (~800 m) 850 hP (~1500 m) 700 hP (~3200 m)
MODIS ff > 0.5
0.1 0.2 0.3 0.4 0.5 0.6 8 10 12 14 16 18 20 22 24 26 28 MODIS AOD A IR S T [ 0C]
1000 hP (~80 m) 925 hP (~800 m) 850 hP (~1500 m) 700 hP (~3200 m)
MODIS ff < 0.5
(a)
(b)
Figure 11.Same as(a)Fig. 10a and(b)Fig. 10b (upper panel) but separated in two cases of MODIS ff < 0.5 (left panel) and MODIS ff > 0.5 (right panel). The horizontal axis of Fig. 11a are different for two cases (ff < 0.5 and ff > 0.5) as AOD binning is done according to availability of data sets.
error bars show the total uncertainties in radiative forcing due to the uncertainty in the input parameters. We examined the dependence of forcing on each property, AOD, SSA andg(sensitivity analyses of forcing to various parameters) separately (Fig. S9 in the Supplement). The sensitivity analyses have shown that the aerosol forcing values strongly depends on the AOD values as compared to any other properties (SSA and g). The total uncertainty in forcing, owing to the combined influence of the uncertainties in the various properties is determined under the assumption that these uncertainties are not correlated (McComiskey et al., 2008).
All dominant aerosol types show negative radiative forc-ing at both the surface and the TOA. The higher values of | (1Faer)SRF| than that of | (1Faer)TOA| are a result
of the positive atmospheric forcing for almost all aerosol types, which reflect the absorbing behavior of these aerosols. However, this value ((1Faer)ATM) is close to zero in the
case of marine aerosol. The forcing values at TOA and at the surface are largest for polluted dust due to the high value of AOD. The maximal atmospheric forcing is ob-served in the case of polluted dust (16.7±7.9 Wm−2) fol-lowed by dust (9.4±4.9 Wm−2) and polluted continental
-45 -35 -25 -15 -5 5 15 25 35
TOA ATM SRF
Dust Polluted Dust
Polluted
Continental Marine
Range: 0.25 - 20.0 µm
SZA=600 Rad ia ti v e F o rc in g [W m -2]
Figure 12.Day time average radiative forcing at top of the atmo-sphere (TOA), at surface (SRF) and in the atmoatmo-sphere (ATM) for various dominant aerosol types over eastern Mediterranean during summer 2010. The error bars present the error in calculation of radiative forcing associated with errors in major input parameters (AOD, SSA and ASYM).
(Sect. 3.3). Di Biagio et al. (2010) showed that these at-mospheric forcing (at the summer solstice) could be in-creased up to+35 Wm−2for desert dust (DD),+23 Wm−2
for pollution (UI (Urban Industrial)-BB (Biomass Burn-ing)) and +34 Wm−2 for mixed aerosol (MA) in the high-est aerosol loading for these classes (AOD∼0.88 for DD, 0.44 for UI-BB, and 0.45 for MA) over the Mediterranean region. The regional mean values of aerosol forcing over the broader Mediterranean basin under clear sky conditions have been found to be+7.4±3.3,+19.2±2.9,+20.1±1.1 and
+7.7±4.0 Wm−2 for winter, spring, summer and autumn, respectively (Papadimas et al., 2012). The global mean at-mospheric forcing (SW) of dust has been recently reported to be in the range of +1.57 to +1.73 Wm−2 using GEOS-Chem global three dimensional GEOS-Chemical Transport Model coupled with Fu-Lion-Gu (FLG) radiative transfer model (Zhang et al., 2013). They also reported the FLG-derived ra-diative forcing over major dust prone regions of world: Sa-hara (+15.22 Wm−2), Gobi (+15.79 Wm−2), Arabian Sea (+5.07 Wm−2)and eastern Asia (+4.96 Wm−2).
Table 3 presents the daytime average aerosol radiative forcing in short wavelength (SW: 0.25–4.0 µm) and long wavelength (LW: 4.0–20 µm) regime for dominant aerosol types. The LW radiative forcing is positive both at SRF and TOA since aerosol produced planetary and surface warm-ing through interaction with infrared (IR) radiation. Fig-ure S10 in the Supplement shows radiative forcing of differ-ent aerosols types as a function of wavelength for both SW and LW region. The importance of the particle size in the LW regime can be seen from the Fig. S10 in the Supplement and Table 3, where dust and polluted dust (diameter up to sev-eral micrometers) show higher forcing values as compared to polluted continental aerosol (diameter less than 1 µm). It is worth noting that we cannot expect significant radiative forcing of anthropogenic pollution in the LW region due to the small sizes of these particles. Bergamo et al. (2008) have reported that the IR surface direct radiative forcing of anthro-pogenic aerosol reach peak values close to 0.35 Wm−2 (sig-nificantly larger than the TOA values) at most of the Mediter-ranean sites during summer and offset 3–6 % of the negative solar (SW) radiative forcing. Our results suggest that the role of absorbing aerosol are mainly associated with the SW re-gion, where it absorbs and scatters the incoming SW solar radiation and thus produces the planetary and surface cool-ing effect. However, LW radiative forccool-ing at SRF offset about 11.3 and 8.6 % of the negative solar (SW) radiative forcing in case of dust and polluted dust, respectively.
Our results along with other earlier studies show signifi-cant atmospheric heating due to different absorbing aerosol types over the Mediterranean basin. Moreover the coupling of natural and anthropogenic pollution leads to higher heat-ing in the atmosphere. It is interestheat-ing to investigate how much atmospheric heating (in terms of temperature change) and at which altitudes is contributed by absorbing aerosol. Figure 13 shows the atmospheric heating rate (K day−1)
pro-Figure 13.SBDART-derived heating rate profiles of dominant ab-sorbing aerosol types (dust, polluted dust and polluted continental) over eastern Mediterranean basin during summer 2010.
files of dust, polluted dust and polluted continental over the eastern Mediterranean during summer 2010. Polluted dust shows the maximal heating rate (0.2–0.9 K day−1) in the lower troposphere (< 2.0 km altitudes) followed by the pol-luted continental (0.1–0.5 K day−1) aerosol. We also found a relatively small heating (< 0.1 K day−1) at high altitudes
(> 3.0 km), in the case of both dust and polluted dust. The similarities in the shape of the vertical heating profiles (Fig. 13) and aerosol extinction profiles (Fig. 8b) suggest that the aerosol optical depth distribution plays a major role in the radiative forcing. Zhang et al. (2013) found that dust par-ticles could heat the atmosphere by more than 0.5 K day−1 over African and Asian source regions. Huang et al. (2009) have also shown that atmospheric heating of dust particles could reach up to 3 K day−1 in heavy dust layers over the Taklimakan Desert in northwestern China.
4 Implications on regional atmospheric dynamics By a good approximation, we can consider that the absorb-ing properties of aerosol are somewhat similar in all summer seasons and AOD is the main factor that affects the aerosol diabatic heating (on yearly basis) over the ROI. Retrieval of the effect of absorbing aerosol loading on atmospheric tem-perature profile reveals an increase of∼4◦C due to aerosol
Table 3. Daytime average aerosol radiative forcing [Wm−2] in short wavelength (SW) and long wavelength (LW) region for different absorbing aerosols during summer 2010 over the eastern Mediterranean basin.
Aerosol Type SW (0.25–4.0 µm) LW (4–20.0 µm)
(1Faer)SRF (1Faer)TOA (1Faer)SRF (1Faer)TOA
Dust −21.95 −11.05 2.47 0.91
Polluted Dust −39.95 −20.60 3.31 0.64
Polluted Continental −17.41 −10.27 0.78 0.07
Table 4.Summertime observed approximated heating rate [dT/dt ± standard deviation] within the aerosol layer and MODIS-AOD (± standard deviation) over the ROI in the eastern Mediterranean basin for 10 years (2003–2012).
Year 2003 2004 2005 2006 2007 2008 2009 2010 2011 2012
Heating 1.4 1.4 1.4 1.7 1.6 1.7 1.3 1.7 1.5 1.3
(K day−1) ±0.4 ±0.7 ±0.5 ±0.9 ±0.6 ±0.8 ±0.3 ±0.8 ±0.4 ±0.4
AOD 0.2 0.2 0.2 0.24 0.23 0.24 0.19 0.25 0.21 0.19
±0.06 ±0.10 ±0.07 ±0.13 ±0.09 ±0.11 ±0.05 ±0.12 ±0.06 ±0.07
overestimated heating rate from AIRS vs. MODIS observa-tion as compared to model calculaobserva-tions is attributed to the treatment of different aerosol types by the RTM, whereas the remote sensing calculation combined the effect of all aerosol types present. In addition, the different AOD used in both methods (CALIOP-derived in RTM and MODIS-derived in another one) could be an important reason for these differ-ences. By now, it is evident that the absorbing aerosol is heat-ing the atmospheric layers, so how is it goheat-ing to affect or modulate the summertime regional dynamics over the east-ern Mediterranean?
In general, the increase in temperature due to aerosol absorption stabilizes the lower atmosphere, leading to the weakening of convection in the lower atmosphere and may inhibit cloud formation (Ackerman et al., 2000). However, the summertime Mediterranean atmospheric condition is al-ready too stable to form convective clouds over the region. The diabatic heating adds even more stability, which will significantly inhibit the atmospheric ventilation and could protect the aerosol from meteorological dilution. In other words, the absorbing aerosol loading over the significantly large area of the eastern Mediterranean Sea may create a low pressure in the lower atmosphere and may receive more pollution from nearby high pressure regions. Hence, the ef-fect of absorption properties of the regional aerosols en-hances the formation of a “pollution pool” over the region. Our results also suggest that the coupling between natural dust emissions and pollution leads to stronger heating. This suggests that a policy to reduce anthropogenic light absorb-ing pollution will have beneficial climatic impacts in the re-gion. In a follow-up study, we will investigate the climate effects of these absorbing aerosols in more detail using the
chemistry–climate coupled EMAC (ECHAM5/MESSy At-mospheric Chemistry) model.
5 Conclusions
A comprehensive study on the effects of absorbing aerosols on the regional atmospheric dynamics over the eastern Mediterranean basin (between 24.5 to 34.5◦E and 32.5 to 35.5◦N) has been carried out using the state-of-art remote sensing analyses from multi-satellite and ground-based ob-servations, coupled with a radiative transfer model. The re-sults of this study can be summarized as follows:
1. The seasonal mean MODIS-AODs (2010–2012) are in the ranges of 0.24–0.25, 0.20–0.23, 0.17–0.19 and 0.17–0.18 in spring, summer, autumn, and winter, re-spectively.
2. The CALIOP-derived AODs of dominant aerosol types are 0.22±0.02, 0.11±0.04, 0.10±0.04 and 0.06±0.01 for polluted dust, polluted continental, dust and marine aerosol, respectively.
3. Direct measurement of the effect of aerosol loading (MODIS) on atmospheric temperature profiles (AIRS) shows a warming of∼1.7±0.8 K day−1in the aerosol layer, which is likely due to direct absorption of incom-ing shortwave solar radiation.
5. In summer 2010, the daytime average atmospheric forcing is found to be +16.7±7.9, +9.4±4.9 and
+6.4±4.5 Wm−2 for polluted dust, dust and polluted
continental aerosols, respectively.
The findings from this study lead to a well-approximated as-sessment of the effects of absorbing aerosols, and the cou-pling of pollution and natural dust on the radiation budget in the eastern Mediterranean. These results enable to formulate mitigation and adaptation scenarios based on reliable obser-vations and scientific understanding.
The Supplement related to this article is available online at doi:10.5194/acp-14-7213-2014-supplement.
Acknowledgements. This research was funded by a grant from
the German Israeli Science Foundation (GIF), Project no. 1136-26.8/2011. The various satellite data sets were obtained from the NASA Langley Research Centre Atmospheric Science Data Center. The efforts of PIs of various AERONET sites used in this study are highly appreciated. Authors would like to thanks the reviewers for his valuable comments and suggestions.
Edited by: M. Kanakidou
References
Abdou, W. A., Diner, D. J., Martonchik, J. V., Bruegge, C. J., Kahn, R. A., Gaitley, B. J., Crean, K. A., Remer, L. A., and Holben, B.: Comparison of coincident Multiangle Imaging Spectroradiome-ter and Moderate Resolution Imaging SpectroradiomeSpectroradiome-ter aerosol optical depths over land and ocean scenes containing Aerosol Robotic Network sites, J. Geophys. Res.-Atmos., 110, D10S07, doi:10.1029/2004JD004693, 2005.
Ackerman, A. S., Toon, O. B., Stevens, D. E., Heymsfield, A. J., Ra-manathan, V., and Welton, E. J.: Reduction of tropical cloudiness by soot, Science, 288, 1042–1047, 2000.
Aumann, H. H., Chahine, M. T., Gautier, C., Goldberg, M. D., Kalnay, E., McMillin, L. M., Revercomb, H., Rosenkranz, P. W., Smith, W. L., Staelin, D. H., Strow, L. L., and Susskind, J.: AIRS/AMSU/HSB on the Aqua mission: Design, science objec-tives, data products, and processing systems, IEEE T. Geosci. Remote., 41, 253–264, 2003.
Basart, S., Pérez, C., Cuevas, E., Baldasano, J. M., and Gobbi, G. P.: Aerosol characterization in Northern Africa, Northeastern Atlantic, Mediterranean Basin and Middle East from direct-sun AERONET observations, Atmos. Chem. Phys., 9, 8265–8282, doi:10.5194/acp-9-8265-2009, 2009.
Bergamo, A., Tafuro, A. M., Kinne, S., De Tomasi, F., and Perrone, M. R.: Monthly-averaged anthropogenic aerosol direct radiative forcing over the Mediterranean based on AERONET aerosol properties, Atmos. Chem. Phys., 8, 6995–7014, doi:10.5194/acp-8-6995-2008, 2008.
Boucher, O., Schwartz, S. E., Ackerman, T. P. Anderson, T. L. Bergstrom, B. Bonnel, B., Chylek, P., Dahlback, A., Fouquart, Y., Fu, Q., Halthore, R. N., Haywood, J. M. Iversen, T., Kato,
S., Kinne, S., Kirkevag, A., Knapp, K. R., Lacis, A., Laszlo, I., Mishchenko, M. I., Nemesure, S., Ramaswamy, V., Roberts, D. L., Russell, P., Schlesinger, M. E., Stephens, G. L., Wa-gener, R., Wang, M., Wong, J., and Yang, F.: Intercomparison of models representing direct shortwave radiative forcing by sulfate aerosols, J. Geophys. Res.-Atmos., 103, 16979–16998, 1998. Burton, S. P., Ferrare, R. A., Vaughan, M. A., Omar, A. H.,
Rogers, R. R., Hostetler, C. A., and Hair, J. W.: Aerosol classification from airborne HSRL and comparisons with the CALIPSO vertical feature mask, Atmos. Meas. Tech., 6, 1397– 1412, doi:10.5194/amt-6-1397-2013, 2013.
Davidi, A., Koren, I., and Remer, L.: Direct measurements of the effect of biomass burning over the Amazon on the atmo-spheric temperature profile, Atmos. Chem. Phys., 9, 8211–8221, doi:10.5194/acp-9-8211-2009, 2009.
Davidi, A., Kostinski, A. B., Koren, I., and Lehahn, Y.: Observa-tional bounds on atmospheric heating by aerosol absorption: Ra-diative signature of transatlantic dust, Geophys. Res. Lett., 39, L04803, doi:10.1029/2011GL050358, 2012.
Derimian, Y., Karnieli, A., Kaufman, Y. J., Andreae, M. O., An-dreae, T. W., Dubovik, O., Maenhaut, W., Koren, I., and Holben, B. N.: Dust and pollution aerosols over the Negev desert, Israel: Properties, transport, and radiative effect, J. Geophys. Res. At-mos., 111, D05205, doi:10.1029/2005JD006549, 2006. DeSouza-Machado, S. G., Strow, L. L., Hannon, S. E., and
Mot-teler, H. E.: Infrared dust spectral signatures from AIRS, Geo-phys. Res. Lett., 33, L03801, doi:10.1029/2005GL024364, 2006. Di Biagio, C., di Sarra, A., and Meloni, D.: Large atmo-spheric shortwave radiative forcing by Mediterranean aerosols derived from simultaneous ground-based and spaceborne ob-servations and dependence on the aerosol type and single scattering albedo, J. Geophys. Res. Atmos., 115, D10209, doi:10.1029/2009JD012697, 2010.
Di Iorio, T., di Sarra, A., Sferlazzo, D. M., Cacciani, M., Meloni, D., Monteleone, F., Fuà, D., and Fiocco, G.: Seasonal evolution of the tropospheric aerosol vertical profile in the central Mediter-ranean and role of desert dust, J. Geophys. Res. Atmos., 114, D02201, doi:10.1029/2008JD010593, 2009.
Di Sarra, A., Pace, G., Meloni, D., De Silvestri, L., Piacentino, S., and Monteleone, F.: Surface shortwave radiative forcing of dif-ferent aerosol types in the Mediterranean, Geophys. Res. Lett., 35, L02714, doi:10.1029/2007GL032395, 2008.
Diao, M., L. Jumbam, J., Sheffield, E. F. Wood, and Zondlo, M. A.: Validation of AIRS/AMSU-A water vapor and temperature data with in situ aircraft observations from the surface to UT/LS from 87◦N–67◦S, J. Geophys. Res.-Atmos., 118, 6816–6836, doi:10.1002/jgrd.50483, 2013.
Diner, D. J., Beckert, J. C., Reilly, T. H., Bruegge, C. J., Conel, J. E., Kahn, R. A., Martonchik, J. V., Ackerman, T. P., Davies, R., Gerstl, S. A. W., Gordon, H. R., Muller, J.-P., Myneni, R., Sellers, P. J., Pinty, B., and Verstraete, M. M.: Multiangle Imag-ing Spectroradiometer (MISR) Instrument Description and Ex-periment Overview, IEEE T. Geosci. Remote., 36, 1072–1087, doi:10.1109/36.700992, 1998.
Dubovik, O., Holben, B. N., Eck, T. F., Smirnov, A., Kaufman, Y. J., King, M. D., Tanre, D., and Slutsker, I.: Variability of absorption and optical properties of key aerosol types observed in world-wide locations, J. Atmos. Sci., 59, 590–608, 2002.
Eck, T. F., Holben, B. N., Reid, J. S., Dubovik, O., Smirnov, A., O’Neill, N. T., Slutsker, I., and Kinne, S.: Wavelength de-pendence of the optical depth of biomass burning, urban, and desert dust aerosols, J. Geophys. Res.-Atmos., 104, 31333– 31349, doi:10.1029/1999JD900923, 1999.
Eck, T. F., Holben, B. N., Sinyuk, A., Pinker, R. T., Goloub, P., Chen, H., Chatenet, B., Li, Z., Singh, R. P., Tripathi, S. N., Reid, J. S., Giles, D. M., Dubovik, O., O’Neill, N. T., Smirnov, A., Wang, P., and Xia, X.: Climatological aspects of the optical prop-erties of fine/coarse mode aerosol mixtures, J. Geophys. Res.-Atmos., 115, D19205, doi:10.1029/2010JD014002, 2010. Eck, T. F., Holben, B. N., Reid, J. S., Mukelabai, M. M., Piketh,
S. J., Torres, O., Jethva, H. T., Hyer, E. J., Ward, D. E., Dubovik, O., Sinyuk, A., Schafer, J. S., Giles, D. M., Sorokin, M., Smirnov, A., and Slutsker, I.: A seasonal trend of single scattering albedo in southern African biomass-burning particles: Implications for satellite products and estimates of emissions for the world’s largest biomass-burning source, J. Geophys. Res. Atmos., 118, 6414–6432, doi:10.1002/jgrd.50500, 2013.
Erel, Y., Dayan, U., Rabi, R., Rudich, Y., and Stein, M.: Tracing Trans-Boundary Transport of Pollutants by Mineral Dust, Envi-ron. Sci. Technol., 40, 2996–3005, 2006.
Forster, P., Ramaswamy, V., Artaxo, P., Berntsen, T., Betts, R., Fa-hey, D. W., Haywood, J., Lean, J., Lowe, D. C., Myhre, G., Nganga, J., Prinn, R., Raga, G., Schulz, M., and Van Dorland, R.: Changes in Atmospheric Constituents and in Radiative Forc-ing, in: Climate Change 2007: The Physical Science Basis, Con-tribution of Working Group I to the Fourth Assessment Report of the Intergovernmental Panel on Climate Change, edited by: Solomon, S., Qin, D., Manning, M., Chen, Z., Marquis, M., Av-eryt, K. B., Tignor, M., and Miller, H. L., Cambridge University Press, Cambridge, United Kingdom and New York, NY, USA, 2007.
Gerasopoulos, E., Kouvarakis, G., Babasakalis, P., Vrekoussis, M., Putaud, J.-P., and Mihalopoulos, N.: Origin and vari-ability of particulate matter (PM10) mass concentrations over
the eastern Mediterranean, Atmos. Environ., 40, 4679–4690, doi:10.1016/j.atmosenv.2006.04.020, 2006.
Giles, D. M., Holben, B. N., Eck, T. F., Sinyuk, A., Smirnov, A., Slutsker, I., Dickerson, R. R., Thompson, A. M., and Schafer, J. S.: An analysis of AERONET aerosol absorption properties and classifications representative of aerosol source regions, J. Geo-phys. Res.-Atmos., 117, D17203, doi:10.1029/2012JD018127, 2012.
Hess, M., Koepke, P., and Schult, I.: Optical Properties of Aerosols and Clouds: The Software Package OPAC, B. Am. Meteorol. Soc., 79, 831–44, 1998.
Holben, B. N., Eck, T. F., Slutsker, I., Tanre, D., Buis, J. P., Setzer, A., Vermote, E., Reagan, J. A., Kaufman, Y. J., Nakajima, T., Lavenu, F., Jankowiak, I., and Smirnov, A.: AERONET–A fed-erated instrument network and data archive for aerosol charac-terization, Remote Sens. Environ., 66, 1–16, doi:10.1016/S0034-4257(98)00031-5, 1998.
Holben, B. N., Tanre, D., Smirnov, A., Eck, T. F., Slutsker, I., Abuhassan, N. Newcomb, W. W., Schafer, J. S., Chatenet, B.,
Lavenu, F., Kaufman, Y. J., Castle J. V., Setzer, A., Markham, B., Clark, D., Frouin, R., Halthore, R., Karneli, A., O’Neill, N. T., Pietras, C., Pinker, R. T., Voss, K., and Zibordi, G.: An emerg-ing ground-based aerosol climatology: Aerosol optical depth from AERONET, J. Geophys. Res.-Atmos., 106, 12067–12097, doi:10.1029/2001JD900014, 2001.
Huang, J., Fu, Q., Su, J., Tang, Q., Minnis, P., Hu, Y., Yi, Y., and Zhao, Q.: Taklimakan dust aerosol radiative heating derived from CALIPSO observations using the Fu-Liou radiation model with CERES constraints, Atmos. Chem. Phys., 9, 4011–4021, doi:10.5194/acp-9-4011-2009, 2009.
Jones, T. A. and Christopher, S. A.: MODIS derived fine mode fraction characteristics of marine, dust, and anthro-pogenic aerosols over the ocean, constrained by GOCART, MOPITT, and TOMS, J. Geophys. Res.-Atmos., 112, D22204, doi:10.1029/2007JD008974, 2007.
Jones, T. A. and Christopher, S. A.: A reanalysis of MODIS fine mode fraction over ocean using OMI and daily GOCART sim-ulations, Atmos. Chem. Phys., 11, 5805–5817, doi:10.5194/acp-11-5805-2011, 2011.
Kahn, R. A., Garay, M. J., Nelson, D. L., Yau, K. K., Bull, M. A., Gaitley, B. J., Martonchik, J. V., and Levy, R. C.: Satellite-derived aerosol optical depth over dark water from MISR and MODIS: Comparisons with AERONET and implications for climatological studies. J. Geophys. Res.-Atmos., 112, D18205, doi:10.1029/2006JD008175, 2007.
Kahn, R., Gaitley, B., Martonchik, J., Diner, D., Crean, K., and Hol-ben, B.: MISR global aerosol optical depth validation based on two years of coincident AERONET observations. J. Geophys. Res.-Atmos., 110, D10S04. doi:10.1029/2004JD004706, 2005. Kallos, G., Astitha, M., Katsafados, P., and Spyrou, C.: Long-range
transport of anthropogenically and naturally produced particu-late matter in the Mediterranean and North Atlantic: Current state of knowledge, J. Appl. Meteorol. Clim., 46, 1230–1251, doi:10.1175/JAM2530.1, 2007.
Kaufman, Y. J. and Koren, I.: Smoke and pollution aerosol effect on cloud cover, Science, 313, 355–658, 2006.
Kaufman, Y. J., Tanré, D., Dubovik, O., Karnieli, A., and Remer, L. A.: Absorption of sunlight by dust as inferred from satel-lite and ground-based remote sensing, Geophys. Res. Lett., 28, 1479–1482, 2001.
Kaufman, Y. J., Boucher, O., Tanré, D., Chin, M., Remer, L. A., and Takemura, T.: Aerosol anthropogenic component es-timated from satellite data, Geophys. Res. Lett., 32, L17804, doi:10.1029/2005GL023125, 2005.
Kazadzis, S., Kouremeti, N., Bais, A., Kazantzidis, A., and Meleti, C.: Aerosol forcing efficiency in the UVA region from spec-tral solar irradiance measurements at an urban environment, Ann. Geophys., 27, 2515–2522, doi:10.5194/angeo-27-2515-2009, 2009.
Khain, A. P.: Notes on state-of-the-art investigations of aerosol ef-fects on precipitation: a critical review, Environ. Res. Lett., 4, 015004, doi:10.1088/1748-9326/4/1/015004, 2009.
Koren, I., Martins, J. V., Remer, L. A., and Afargan, H.: Smoke Invigoration Versus Inhibition of Clouds over the Amazon, Sci-ence, 321, 946–949, doi:10.1126/science.1159185, 2008. Leibensperger, E. M., Mickley, L. J., Jacob, D. J., Chen, W.-T.,
anthro-pogenic aerosols – Part 1: Aerosol trends and radiative forcing, Atmos. Chem. Phys., 12, 3333-3348, doi:10.5194/acp-12-3333-2012, 2012.
Lelieveld, J., Berresheim, H., Borrmann, S., Crutzen, P. J., Den-tener, F. J., Fischer, H., Feichter, J., Flatau, P. J., Heland, J., Holzinger, R., Korrmann, R., Lawrence, M. G., Levin, Z., Markowicz, K. M., Mihalopoulos, N., Minikin, A., Ramanathan, V., De Reus, M., Roelofs, G. J., Scheeren, H. A., Sciare, J., Schlager, H., Schultz, M., Siegmund, P., Steil, B., Stephanou, E. G., Stier, P., Traub, M., Warneke, C., Williams, J., and Ziereis, H.: Global air pollution crossroads over the Mediterranean, Sci-ence, 298, 794–799, doi:10.1126/science.1075457, 2002. Levy, R. C., Remer, L. A., Mattoo, S., Vermote, E. F., and
Kauf-man, Y. J.: Second-generation operational algorithm: Retrieval of aerosol properties over land from inversion of Moderate Resolu-tion Imaging Spectroradiometer spectral reflectance, J. Geophys. Res., 112, D13211, doi:10.1029/2006JD007811, 2007.
Li, Z., Niu, F., Fan, J., Liu, Y., Rosenfeld, D., and Ding, Y.: Long-term impacts of aerosols on the vertical development of clouds and precipitation, Nat. Geosci., 4, 888–894, 2011.
Ma, X., Bartlett, K., Harmon, K., and Yu, F.: Comparison of AOD between CALIPSO and MODIS: significant differences over ma-jor dust and biomass burning regions, Atmos. Meas. Tech., 6, 2391–2401, doi:10.5194/amt-6-2391-2013, 2013.
Maddy, E. S., DeSouza-Machado, S. G., Nalli, N. R., Barnet, C. D., Strow, L. L., Wolf, W. W., Xie, H., Gambacorta, A., King, T. S., Joseph, E., Morris, V., Hannon, S. E., and Schou, P.: On the effect of dust aerosols on AIRS and IASI operational level 2 products, Geophys. Res. Lett., 39, L10809, doi:10.1029/2012GL052070, 2012.
Mallet, M., Dubovik, O., Nabat, P., Dulac, F., Kahn, R., Sciare, J., Paronis, D., and Léon, J. F.: Absorption properties of Mediter-ranean aerosols obtained from multi-year ground-based remote sensing observations, Atmos. Chem. Phys., 13, 9195–9210, doi:10.5194/acp-13-9195-2013, 2013.
Marconi, M., Sferlazzo, D. M., Becagli, S., Bommarito, C., Calzo-lai, G., Chiari, M., di Sarra, A., Ghedini, C., Gómez-Amo, J. L., Lucarelli, F., Meloni, D., Monteleone, F., Nava, S., Pace, G., Piacentino, S., Rugi, F., Severi, M., Traversi, R., and Ud-isti, R.: Saharan dust aerosol over the central Mediterranean Sea: PM10 chemical composition and concentration versus optical
columnar measurements, Atmos. Chem. Phys., 14, 2039–2054, doi:10.5194/acp-14-2039-2014, 2014.
Marey, H. S., Gille, J. C., El-Askary, H. M., Shalaby, E. A., and El-Raey, M. E.: Aerosol climatology over Nile Delta based on MODIS, MISR and OMI satellite data, Atmos. Chem. Phys., 11, 10637–10648, doi:10.5194/acp-11-10637-2011, 2011.
Markowicz, K. M., Flatau, P. J., Ramana, M. V., Crutzen, P. J., and Ramanathan, V.: Absorbing mediterranean aerosols lead to a large reduction in the solar radiation at the surface, Geophys. Res. Lett., 29, 1968, doi:10.1029/2002GL015767, 2002. McClatchey, R. A., Fenn, R. W., Selby, J. E. A., Volz, F. E., and
Gar-ing, J. S.: Optical properties of the atmosphere, 3rd Edn., AFCRL Environ. Res. Papers No. 411, 108 pp., 1972.
McComiskey, A., Schwartz, S. E., Schmid, B., Guan, H., Lewis, E. R., Ricchiazzi, P., and Ogren, J. A.: Direct aerosol forcing: Cal-culation from observables and sensitivities to inputs, J. Geophys. Res.-Atmos., 113, D09202, doi:10.1029/2007JD009170, 2008.
Mélin, F. and Zibordi, G.: Aerosol variability in the Po Valley an-alyzed from automated optical measurements, Geophys. Res. Lett., 32, L03810, doi:10.1029/2004GL021787, 2005.
Meloni, D., di Sarra, A., DeLuisi, J., Di Iorio, T., Fiocco, G., Junkermann, W., and Pace, G.: Tropospheric aerosols in the Mediterranean: 2. Radiative effects through model simula-tions and measurements, J. Geophys. Res.-Atmos., 108, 4317, doi:10.1029/2002JD002807, 2003.
Mielonen, T., Arola, A., Komppula, M., Kukkonen, J., Koski-nen, J., de Leeuw, G., and LehtiKoski-nen, K. E. J.: Comparison of CALIOP level 2 aerosol subtypes to aerosol types derived from AERONET inversion data, Geophys. Res. Lett., 36, L18804, doi:10.1029/2009GL039609, 2009.
Moulin, C., Lambert, C. E., Dayan, U., Masson, T. M. V., Ramonet, M., Bousquet, P., Legrand, M., Balkanski, Y. J., Guelle, W., Marticorena, B., Bergametti, G., and Dulac, F.: Satellite climatology of African dust transport in the Mediter-ranean atmosphere, J. Geophys. Res.-Atmos., 103, 13137– 13144, doi:10.1029/98JD00171, 1998.
Nabat, P., Somot, S., Mallet, M., Chiapello, I., Morcrette, J. J., Solmon, F., Szopa, S., Dulac, F., Collins, W., Ghan, S., Horowitz, L. W., Lamarque, J. F., Lee, Y. H., Naik, V., Na-gashima, T., Shindell, D., and Skeie, R.: A 4-D climatology (1979–2009) of the monthly tropospheric aerosol optical depth distribution over the Mediterranean region from a comparative evaluation and blending of remote sensing and model products, Atmos. Meas. Tech., 6, 1287–1314, doi:10.5194/amt-6-1287-2013, 2013.
Omar, A. H., Winker, M. D., Vaughan, M. A., Hu, Y., Trepte, C. R., Ferrare, R. A., Lee, K.-P., Hostetler, C. A., Kittaka, C., Rogers, R. R., Kuehn, R. E., and Liu, Z.: The CALIPSO automated aerosol classification and lidar ratio selection algorithm, J. At-mos. Ocean. Tech., 26, 1994–2014, 2009.
Oo, M. and Holz, R.: Improving the CALIOP aerosol optical depth using combined MODIS-CALIOP observations and CALIOP in-tegrated attenuated total color ratio, J. Geophys. Res.-Atmos., 116, D14201, doi:10.1029/2010jd014894, 2011.
Pace, G., di Sarra, A., Meloni, D., Piacentino, S., and Chamard, P.: Aerosol optical properties at Lampedusa (Central Mediter-ranean). 1. Influence of transport and identification of dif-ferent aerosol types, Atmos. Chem. Phys., 6, 697–713, doi:10.5194/acp-6-697-2006, 2006.
Papadimas, C. D., Hatzianastassiou, N., Matsoukas, C., Kanaki-dou, M., Mihalopoulos, N., and Vardavas, I.: The direct effect of aerosols on solar radiation over the broader Mediterranean basin, Atmos. Chem. Phys., 12, 7165–7185, doi:10.5194/acp-12-7165-2012, 2012.
Peña, O. and Pal, U.: Scattering of electromagnetic radiation by a multilayered sphere, Comput. Phys. Commun., 180, 2348–2354, 2009.
Pierangelo, C., Chédin, A., Heilliette, S., Jacquinet-Husson, N., and Armante, R.: Dust altitude and infrared optical depth from AIRS, Atmos. Chem. Phys., 4, 1813–1822, doi:10.5194/acp-4-1813-2004, 2004.