Article
J. Braz. Chem. Soc., Vol. 28, No. 10, 1988-1994, 2017. Printed in Brazil - ©2017 Sociedade Brasileira de Química 0103 - 5053 $6.00+0.00
*e-mail: [email protected]
Boron Isotopic Ratio in Brazilian Red Wines: a Potential Tool for Origin and
Quality Studies?
Cibele M. S. de Almeida,a Ana Cristina Almeida,b Tatiana D. Saint’Pierreb and
José Marcus Godoy*,b
aLaboratório de Ciências Químicas, Centro de Ciência e Tecnologia,
Universidade Estadual do Norte Fluminense Darcy Ribeiro, Avenida Alberto Lamego 2000, Parque Califórnia, 28013-602 Campos dos Goytacazes-RJ, Brazil
bDepartamento de Química, Pontifícia Universidade Católica do Rio de Janeiro,
Rua Marquês de São Vicente, 225, Gávea, 22451-900 Rio de Janeiro-RJ, Brazil
For the first time, the boron isotopic ratio is reported for Brazilian red wines. The boron concentration, 11B/10B isotopic ratio and δ11B were determined in 89 red wines produced in Campanha Gaúcha, Serra Gaúcha (SG), and Vale dos Vinhedos (VV) in South Brazil and Vale do São Francisco (VSF) in Northeast Brazil. A broad boron concentration range, < 0.07 to 20.4 mg L-1, was observed, where a few values were above the maximum allowed concentration according to the International Code of Oenological Practices (14.0 mg L-1). The obtained 11B/10B ratios were quite different from those observed in the literature. The ratios were quite similar among the Southern Brazilian wine producing areas, but a large difference was observed when compared with the Northeastern wines, allowing for the differentiation between these two important Brazilian wine regions. The results have also shown that is possible, based on the boron isotopic ratio, to differentiate the Brazilian red wines from Chilean, Italian and Portuguese red wine.
Keywords: Brazilian red wines, boron isotopic ratio, ICP-MS, ICP OES, authenticity studies
Introduction
Boron has two natural isotopes, 10B (19.9%) and 11B
(80.1%),1 and is an oligo-element essential to plant health
and growth. In wines, boron is present in a concentration of 0.1 to 10 mg L-1, expressed as boric acid,2-4 with a
maximum acceptable boric acid concentration of 80 mg L-1
(14 mg L-1 B), according to the International Organisation
of Vine and Wine (OIV).5
The boron isotopic variation can be expressed either as the 11B/10B ratio or as δ11B,6-10 where δ11B is defined as:
(1)
where (11B/10B)
sample is the 11B/10B isotopic ratio of the
sample and (11B/10B)
standard is the 11B/10B isotopic ratio
according to the NIST 951a Boron Acid Isotopic Standard.
Boron can be regarded as an important tracer for understanding mass transfer processes in terrestrial systems, which is of great interest in geochemical, biological and environmental sciences.11-16
According to Vorster et al.,7 if the natural variation
in the 11B/10B ratio of the soil is reflected in the vines, it
can become an important tool in provenance studies of agricultural products, such as wines, helping to minimize adulteration and fraud in these products.
The 11B/10B ratio has been applied in wine geographical
provenance studies to elucidate the country or even region
inside a country. Coetzee and Vanhaecke6 observed
differences that allowed them to differentiate between
wines produced in South Africa, France and Italy. Bruyn3
was able to observe differences among the soils and wines from the South African regions of Swartland, Stellenbosh and Robertson. Combining the boron isotopic ratio with elemental analysis, Vorster et al.7 and Coetzee et al.8
included, aiming for the development of a fingerprint for each wine-producing area of the country.
Of course, the applied equipment directly influences the obtained uncertainty. Quadrupole inductively coupled plasma mass spectrometry (Q-ICP-MS) has poor precision (relative standard deviation (RSD) = 0.1-0.5%) compared to thermal ionization mass spectrometry (TIMS) (RSD = 0.002-0.005%) and multicollector ICP-MS (RSD = 0.2-0.002%). However, with careful control and optimization of its operation conditions, useful results for wine provenance studies can be obtained by applying Q-ICP-MS.4,6-8
It should be pointed out that beside lead, which was also applied to Brazilian red wines,17 other isotopes have
been utilized in viticulture, Santesteban et al.9 presented
a review about this subject. Delta(D) and delta(O-18) are quite applied to mineral water provenance studies18 and its
use could be extended to detect water addiction in wines.9
Grapevines are considered plants with C3 photosynthesis cycle and present a δ(13C) around −25‰ while sugar cane
is a C4 plant with a δ(13C) about −11‰, therefore, sugar
addition will alter the observed delta value.9,19 However,
water deficit could also alter the δ(13C) and has to be taken
into account.9,19 Particularly interesting is the application
of δ(87Sr) since wine/soil delta values are close to one,8
but, the same authors showed that, in order to obtain better discrimination among the wine regions, smaller uncertainty is necessary and, in this direction, the application of boron had provided better results.8
The present study represents the first study of the boron isotopic ratio in Brazilian red wines. Sixty percent of the wine produced in Brazil is bottled outside of its producing region, making it difficult to trace its identity and follow its quality.20 Another characteristic is the organization of
the production system based on producer cooperatives, which includes up to 370 families, resulting in wine that is produced from vines from different families and eventually involving different cities than the designated origin. Therefore, at the consumer level, one has to trust the information printed on the label, including the location of the vines and the presence of additives. Based on these arguments, we decided to perform the present work on wines bought at the consumer level to evaluate the application of boron content and boron isotopic ratio as a tool to evaluate the wine provenance and quality.
Experimental
Sampling and sample treatment
Information related to the involved wine regions, sample collection and sample treatment is described in detail by
Almeida et al.17 A total of 89 Brazilian red wines were
analyzed: 10 from Campanha Gaúcha, 36 from Vale dos Vinhedos, 33 from Serra Gaúcha and 10 from Vale do São Francisco.
For the quantitative determination of boron by applying inductively coupled plasma optical emission spectrometry
(ICP OES), the samples were diluted 1:100 with Milli-Q®
quality water. Based on the obtained boron content, the samples were diluted accordingly to obtain a boron concentration of approximately 20 µg L-1, in order to avoid
dead-time corrections during isotopic ratio determination.17
Reagents and standard solutions
All solutions were prepared with Milli-Q® quality
water. Suprapur nitric acid (65%) (Merck) was used in the oxidation of the wine samples, mannitol (20%) (Sanobiol) and PA-grade ethanol (Merck) were used in the matrix effects studies.
During the uncertainty and accuracy testing, the following standard reference materials (SRM) were applied: NIST SRM 951a, acid boric isotopic standard,
(10B/11B = 0.2473 ± 0.00024) and 95% 10B-enriched
NIST SRM 952, enriched acid boric isotopic standard, (94.949 ± 0.005%, 10B/11B = 18.80 ± 0.02). Stock solutions
(10 mg L-1) were prepared using 1% HNO
3 and preserved
under refrigeration. The blank corresponds to 1% HNO3,
prepared using Suprapur nitric acid (65%) and Milli-Q®
quality water.
Instrumentation
The boron content was determined by applying an Optima 4300 DV ICP OES (PerkinElmer), equipped with a cyclonic chamber-type twister (Glass Expansion). The corresponding operational parameters are described in Table 1.
The boron isotope ratios were determined using an ICP-MS (Agilent, model 7500ce), equipped with an octopole reaction system (ORS), a low-flow nebulizer (MicroMist) connected to a quartz nebulizer chamber (Scott) mounted on a Peltier block, which was kept at 2 °C, and a quartz torch with a 2.5 mm diameter injector. Nickel sampler and skimmer cones were utilized. Additional operational conditions are given in Table 1.
Isotopic ratio determination
Due to the large relative mass difference involved
in the 10B/11B isotopic ratio measurement, which leads
ICP-MS, the sequence proposed by Coetzee and Vanhaecke6
was applied: standard - sample 1 - standard - sample 2 - standard.
The uncertainty in the mass bias correction factor (β) and the uncertainty in the calculated atom ratio were derived as proposed by Godoy et al.21
Although the mass bias correction was applied only during sample analysis and accuracy testing and not during the first method development steps, as ethanol affects the tests, a larger deviation from the certified value was applied as a decision criteria.
Data analysis
The boron isotope ratios were analyzed using one-way analysis of variance (ANOVA). The degree of discrimination among the different regions may be an indication of the possible application of this technique to verify the existence of significant differences among the regions.
Results and Discussion
Matrix effects: carbon content
Potential tailing effects of the 12C peak on the 11B peak
can lead to a higher 11B/10B ratio, as reported by Coetzee and
Vanhaecke,6 mainly when dealing with samples with high
carbon content. According to Barbaste et al.,22 the effect
of ethanol on the 11B/10B ratio can be reduced by using a
cooled nebulizer chamber, as utilized in the present work. If ethanol has an influence on the 11B peak, the 11B/10B
ratio should increase with ethanol content. Solutions of
NIST SRM 951a (20 µg L-1) were prepared containing
0.125, 0.25, 0.50 and 1.0% ethanol. As shown in Table 2, an effect was not observed even at 1% ethanol, which corresponds to a wine sample diluted 1:10.
Another possible way to investigate the 12C effect on the 11B/10B ratio is by successive dilution of the wine sample,
since wine contains organic compounds other than ethanol. As shown in Figure 1, a matrix effect was observed. At a wine dilution of 1:50, a very high 11B/10B ratio was observed
due to the 12C tailing effect on the 11B peak. The effect is
quickly reduced, and minor changes were observed at dilutions higher than 1:100. As low boron concentrations lead to poor measurement statistics, a higher dilution should be applied only when the boron content allows.
Mannitol effect
Boron loss by volatilization during sample treatment steps, by evaporation or acid dilution, is a concern in studies involving this element. One important boron characteristic is the formation of cis-diol complexes with a large variety of organic compounds; however, the observed yield is variable.23 Notwithstanding, it is known that mannitol is
one of the most efficient polyalcohols for this purpose and is usually applied in the volumetric determination of boric acid.24
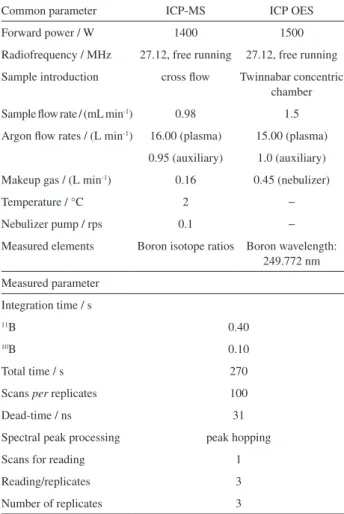
Based on this finding, to minimize boron loss, NIST SRM 951a solutions were prepared at different boron concentrations (20, 30 and 100 µg L-1) with and without the Table 1. Operating conditions, data acquisition modes and other
information for the determination of boron concentration and isotope ratios by ICP OES and ICP-MS, respectively
Common parameter ICP-MS ICP OES
Forward power / W 1400 1500
Radiofrequency / MHz 27.12, free running 27.12, free running
Sample introduction cross flow Twinnabar concentric chamber
Sample flow rate / (mL min-1) 0.98 1.5
Argon flow rates / (L min-1) 16.00 (plasma) 15.00 (plasma)
0.95 (auxiliary) 1.0 (auxiliary)
Makeup gas / (L min-1) 0.16 0.45 (nebulizer)
Temperature / °C 2 −
Nebulizer pump / rps 0.1 −
Measured elements Boron isotope ratios Boron wavelength: 249.772 nm
Measured parameter
Integration time / s
11B 0.40
10B 0.10
Total time / s 270
Scans per replicates 100
Dead-time / ns 31
Spectral peak processing peak hopping
Scans for reading 1
Reading/replicates 3
Number of replicates 3
Table 2. Ethanol effect on the 11B/10B isotopic ratio
Sample 11B/10B (standard deviation)
0.125% ethanol 4.0510 (0.0034)
0.25% ethanol 4.0485 (0.0023)
0.5% ethanol 4.0514 (0.0005)
addition of mannitol (0.2% final concentration), as proposed by Bruyn.3 It should be noted that mannitol addition has the
side effect of imparting a higher carbon content to the sample, showing the previously mentioned effect on the 11B/10B ratio.
Therefore, the potential volatilization effect was verified by monitoring 10B, while the 12C influence was monitored based
on the 11B/10B ratio. It was found that mannitol addition
did not have the expected effect on the 10B intensity but
did enhance the 12C influence on the 11B/10B ratio. As a
consequence, it was decided not to use mannitol addition.
Boron concentration effect
Based on our previous experience with lead,17 we
decided to fix the boron concentration at approximately
20 µg L-1. However, as boron has a lower ionization
efficiency than lead and higher optimal concentration
(100 µg L-1) was proposed by Bruyn,3 Coetzee and
Vanhaecke,6 Vorster et al.,7 and Coetzee et al.,8 we decided
to investigate the influence of boron content, in particular, taking into account the necessity to work with a boron concentration that is as low as possible in order to minimize the 12C effect. It was observed that between 10-30 µg L-1,
despite of the existence of statistically valid differences among the isotopic ratio results, no clear trend on the 10B/11B
ratio was observed, may be due to the lack of mass bias correction. However, on the other hand, at 100 µg L-1, the
concentration effect is noticeable (Table 3).
Application to red wine samples: boron content and isotopic ratio determination
To test the achieved accuracy and precision, ten
measurements on the 20 µg L-1 NIST SRM 951a solution
were performed and the mass bias correction was applied. The obtained mean value and standard deviation were 0.2436 and 0.0053, respectively, which is statistically equivalent (95%) to the certified value (10B/11B = 0.2473 ± 0.00024).
The relative standard error is approximately 0.5%, which fits with the expected value for Q-ICP-MS.
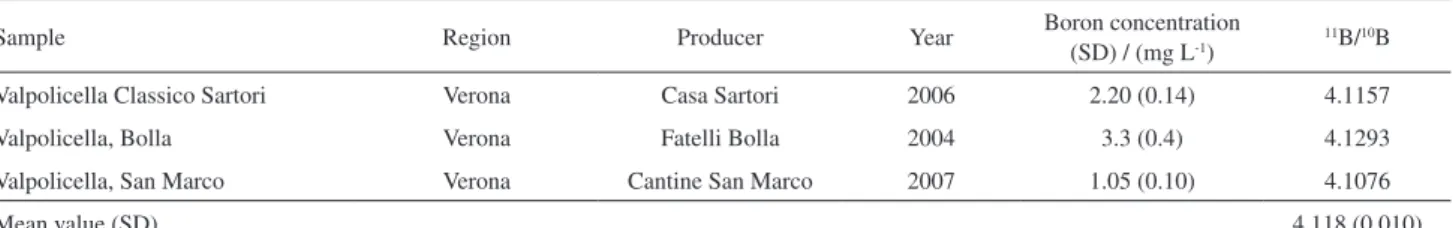
Additionally, in order to test the accuracy, the boron isotopic ratio and boron content were determined for three Valpolicella wines bought in wine shops. The obtained values (Table 4) are in agreement with those published by
Coetzee and Vanhaecke6 (mean value = 4.143, SD = 0.002).
The obtained results for the Brazilian red wines are shown in Table S1, Supplementary Information. The boron concentration ranged between < 0.070 and 20.4 mg kg-1.
However, only a few brands presented values above
14 mg kg-1, the maximum allowed concentration proposed
by the OIV.5 Four of them originated from the same
winery (V6) but were produced from different vines. This finding may be related either to some local soil-specific characteristic or to a practice adopted by the winery. The other high concentration came from winery V7, where three wines were analyzed: two presented values below the detection limit and one presented 18.7 mg kg-1.
Figure 1. Sample dilution effect on the 11B/10B isotopic ratio in a red
wine sample.
Table 3. Boron concentration effect on the 11B/10B isotopic ratio (n = 15)
Solution 10B/11B (standard deviation)
NIST 951a, 10 µg L-1 4.2626 (0.0067)
NIST 951a, 20 µg L-1 4.0733 (0.0013)
NIST 951a, 30 µg L-1 4.1203 (0.0004)
NIST 951a, 100 µg L-1 4.9505 (0.0065)
Table 4. Boron concentration and 11B/10B isotopic ratio on Italian red wine samples
Sample Region Producer Year Boron concentration
(SD) / (mg L-1)
11B/10B
Valpolicella Classico Sartori Verona Casa Sartori 2006 2.20 (0.14) 4.1157
Valpolicella, Bolla Verona Fatelli Bolla 2004 3.3 (0.4) 4.1293
Valpolicella, San Marco Verona Cantine San Marco 2007 1.05 (0.10) 4.1076
Mean value (SD) 4.118 (0.010)
In fact, low boron concentrations are not expected for Vale dos Vinhedos wines. From a total of 36 samples, only three presented low values, two being from winery V7, which requires further study. In this direction, Vale dos Vinhedos is in fact a sub-region of Serra Gaúcha, and several Serra Gaúcha wines presented boron concentrations below the detection limit. The great majority of wines that presented concentration ranges below the limit of detection, mainly from the region of Serra Gaúcha, according to the information on the labels, are so-called “soft table” red wines. These wines are inferior in quality to those produced with Vitis vinifera grapes and are made from American red grapes, such as Isabel. Other wines from this region are fine red varietal wines made from Cabernet Sauvignon, Cabernet Franc, Merlot, Tannat and blends of these grapes. Some were produced by cooperatives, and most of them were from Bento Gonçalves/Vale dos Vinhedos.
The range of boron content in Brazilian wines was
broader than those reported by Ozbek and Akman25 in
Turkish red wines (7.94 to 10.7 mg L-1). For Portuguese
wines, Rodrigues et al.26 were able to distinguish between
wines from three wine regions, Alentejo, Dão and Bairrada, where Bairrada had the highest boron concentration (mean
value of approximately 5.0 mg L-1). Hernandez et al.27
studied the boron content in wines of the region of Tacoronte-Acentejo (DOC region) and obtained a mean value of 7.0 mg L-1.
Among the three wine regions in Southern Brazil, Campanha Gaúcha presented the narrowest 11B/10B isotopic
ratio range of 4.032-4.072. This reflects the fact that the analyzed wines from this region came from only two different wineries located in the same county.
As Vale dos Vinhedos represents a Serra Gaúcha sub-region, both presented similar 11B/10B isotopic ratio
ranges of 3.857-4.094 and 3.799-4.088, respectively. It was not possible to distinguish these three Southern Brazilian winery regions based only on the boron concentration and
11B/10B isotopic ratio, similar to the results observed when
applying lead isotopes.25
Also similar to the reported results for lead isotopes,17
the measured 11B/10B isotopic ratio of wines produced in the
Vale do São Francisco region were distinguishably different from those produced in the Southern region. Thus, the
11B/10B isotopic ratio can be applied as a tool to differentiate
these two Brazilian winery regions. Higher 11B/10B isotopic
ratios of 4.110-5.152 were observed, and treating this last value as an outlier, the range becomes 4.110-4.173.
It was observed that the low 11B/10B isotopic ratio values
of Serra Gaúcha wines is related to the boron content being lower than 1 mg kg-1, which can be connected to the
10B peak measurement statistics since the samples were
diluted 1:100. Therefore, in further evaluations, only values associated with a boron concentration higher than this value were considered. Figure 2, where the 11B/10B isotopic ratio
is plotted against the boron concentration, was built based on this guideline. The figure shows that it is possible to apply the 11B/10B isotopic ratio as a tool to differentiate
between wines produced in the Southern region from those produced in the São Francisco Valley. It is also possible to verify that the 11B/10B isotopic ratio does not depend on the
boron concentration in the wine. This boron differentiation among South and Northeastern regions becomes more clear when using a box plot (Figure 3).
Table S2 (Supplementary Information) presents the boron concentrations and 11B/10B isotopic ratios of
wines from Portugal, Italy, Spain, France, USA, South Africa, Chile and Argentina. Two French and two Spanish
Figure 3. Box plot indicating the 11B/10B isotopic ratios of Brazilian
red wine according to the producing region (VV = Vale dos Vinhedos, SG = Serra Gaúcha, VSF = Vale do São Francisco).
Figure 2. Variation in the 11B/10B isotopic ratios with boron concentrations
wines presented boron concentrations above the OIV
maximum allowed concentration (14 mg L-1), while the
remaining were between < 0.07 and 9.0, as observed in the literature.4,6-8,25-27 The boron isotopic ratios for Italian,
French and South African wines have been reported in the literature, and the obtained values are in agreement with the expected ratios for the two wines sampled first. However, for the South African wines, only the first value fits with the expected value (4.185-4.223), and the other three are much higher. The first sample originated from West Cape, while the other three came from Stellenbosch and were produced by the same winery. As they were produced at the same winery, this may be related to the applied process and production additives.
Figure 4 shows a comparison between the boron isotopic ratio on Brazilian red wines and those observed on Argentinean, Chilean, Portuguese and Italian red wines, it is possible to verify that based on the 11B/10B isotopic ratio
it is feasible to differentiate the Brazilian wines from the Chilean, Portuguese and Italian wines.
Conclusions
The analyzed wine samples exhibited large variations in boron concentration. In wines from the Southern Brazilian
region, the values ranged from < 0.07 to 20.4 mg L-1,
whereas in the Northeast region a narrow range of 3.8 to
11.1 mg L-1 was observed. From 94 samples, only five
exceeded the OIV maximum allowed limit, with four being from the same winery. Similar to the analysis of lead isotopic ratios, based on the boron content together with its isotopic ratio, it was not possible to distinguish among the three Southern Brazilian vinery regions; however, it was possible to discriminate the South region from the
Northeastern region. Additionally, it was verified, that based on boron isotopic ratio, it is possible to discriminate the Brazilian red wines from the Chilean, Portuguese and Italian red wines.
Supplementary Information
Supplementary information is available free of charge at http://jbcs.sbq.org.br.
Acknowledgments
Cibele M. S. Almeida would like to say thank you for the fellowship from CNPq, Brazil. The authors would like also to express their gratitude to Embrapa Vinhos and Ruy Tonietto for their support during project formulation.
References
1. Berglund, M.; Wieser, M. E.; Pure Appl. Chem. 2011, 83, 397. 2. Catarino, S.; Curvelo-Garcia, A. S.; Sousa, R. B.; Cienc. Tec.
Vitivinic. 2008, 23, 3.
3. Bruyn, R.; available at https://ujcontent.uj.ac.za/vital/access/ manager/Repository/uj:8639, accessed in January 2017. 4. Guo, W.; Wu, Z.; Hu, S.; Jin, L.; Qiu, K.; Guo, Q.; Gan, Y.; RSC
Adv. 2016, 6, 47394.
5. The International Organisation of Vine and Wine, available at http://www.oiv.int/public/medias/3740/f-code-annexe-limites-maximales-acceptables.pdf, accessed on October 20, 2016. 6. Coetzee, P. P.; Vanhaecke, F.; Anal. Bioanal. Chem. 2005, 383,
977.
7. Vorster, C.; Greeff, L.; Coetzee, P. P.; S. Afr. J. Chem. 2010, 63, 207.
8. Coetzee, P. P.; Greeff, L.; Vanhaecke, F.; S. Afr. J. Enol. Vitic. 2011, 32, 28.
9. Santesteban, L. G.; Miranda, C.; Barbarin, I.; Royo, J. B.; Aust. J. Grape Wine Res. 2015, 21, 157.
10. Wieser, M. E.; Yver, S. S.; Krouse, H. R.; Cantagallo, M. I.;
Appl. Geochem. 2001, 16, 317.
11. Kaliwoda, M.; Marschall, H. R.; Marks, M. A. W.; Ludwing, T.; Altherr, R.; Markl, G.; Lithos 2011, 125, 52.
12. Vanderpool, R. A.; Johnson, P. E.; J. Agric. Food Chem. 1992,
40, 462.
13. Williams, L. B.; Hervig, R. L.; Wieser, M. E.; Hutcheon, I.;
Chem. Geol. 2001, 174, 445.
14. Williams, L. B.; Hervig, R. L.; Holloway, J. R.; Hutcheon, I.;
Geochim. Cosmochim. Acta 2001, 65, 1769.
15. Williams, L. B.; Hervig, R. L.; Hutcheon, I.; Geochim. Cosmochim. Acta 2001, 65, 1783.
16. Noireaux, J.; Gaillardet, J.; Sullivan, P. L.; Brantley, S. L.;
Procedia Earth Planet. Sci. 2014, 10, 218. Figure 4. Box plot including 11B/10B isotopic ratio values on Brazilian
17. Almeida, C. M. S.; Almeida, A. C.; Godoy, M. L. D. P.; Saint’Pierre, T. D.; Godoy, J. M.; J. Braz. Chem. Soc.2016,
27, 1026.
18. Godoy, J. M.; Godoy, M. L. D. P.; Neto, A.; J. Geochem. Explor.
2012, 119-120, 1.
19. Martinelli, L. A.; Ometto, J. P. H. B.; Ferraz, E. S.; Victoria, R. L.; de Camargo, P. B.; Moreira, M. Z.; Desvendando Questões Ambientais com Isótopos Estáveis; Oficina de Textos: São Paulo, Brazil, 2009.
20. http://www.cnpuv.embrapa.br/publica/anais/cbve10/, accessed in February 2017.
21. Godoy, M. L. D. P.; Godoy, J. M.; Roldão, L. A.; Tauhata, L.;
J. Environ. Radioact. 2009, 100, 613.
22. Barbaste, M.; Robinson, K.; Guilfoyle, S.; Medina, B.; Lobinski, R.; J. Anal. At. Spectrom. 2002, 17, 135.
23. Liakopoulos, G.; Stavrianakou, S.; Nikolopoulos, D.; Karvonis, E.; Vekkos, K.-A.; Psaroudi, V.; Karabourniotis, G.; Plant Soil
2009, 323, 177.
24. Alcarde, J. C.; Catani, R. A.; Souza, O. S.; An. Esc. Super. Agric., “Luiz de Queiroz”, Univ. Sao Paulo 1972, XXIX, 273. 25. Ozbek, N.; Akman, S.; Food Sci. Technol. 2005, 61, 532. 26. Rodrigues, S. M.; Otero, M.; Alves, A. A.; Coimbra, J.; Coimbra,
M. A.; Pereira, E.; Duarte, A. C.; J. Food. Compos. Anal. 2011,
24, 548.
27. Herandez, G. G.; de La Torre, A. H.; León, J. J. A.; Food Chem.
1997, 60, 339.