Article
J. Braz. Chem. Soc., Vol. 23, No. 1, 57-64, 2012. Printed in Brazil - ©2012 Sociedade Brasileira de Química 0103 - 5053 $6.00+0.00
A
*e-mail: [email protected]
Evaluation of Solid-Phase Microextraction using a Polythiophene Film and
Liquid Chromatography with Spectrophotometric Detection for the
Determination of Antidepressants in Plasma Samples
Juciene A. Caris, Andréa R. Chaves and Maria Eugênia C. Queiroz*
Departamento de Química, Faculdade de Filosofia Ciências e Letras de Ribeirão Preto, Universidade de São Paulo, 14040-903 Ribeirão Preto-SP, Brazil
A fase extratora de politiofeno (PTh), desenvolvida por eletropolimerização em haste de aço inox, foi avaliada para microextração em fase sólida (SPME) e análise por cromatografia líquida com detecção espectrofotométrica (LC-UV) de antidepressivos inibidores seletivos da recaptação de serotonina (citalopram, paroxetina, fluoxetina e sertralina) em amostras de plasma. A influência das variáveis da eletropolimerização (velocidade de varredura de potencial, potencial e ciclos de varredura) foi avaliada no desempenho SPME. As variáveis SPME (tempo de extração, temperatura, pH da matriz, força iônica e procedimento de dessorção), assim como a influência das proteínas do plasma no mecanismo de sorção, foram também avaliadas. O método SPME-PTh/LC-UV desenvolvido para a determinação de antidepressivos em amostras de plasma apresentou faixa linear de resposta do limite de quantificação (LOQ, 200-250 ng mL-1) a 4000 ng mL-1 e precisão interensaio com coeficiente de variação no intervalo de 11 a 15%. O método proposto poderá ser utilizado para a determinação de antidepressivos em amostras de plasma humano para análises toxicológicas de urgência, após a ingestão acidental ou suicida de doses altas de medicamentos.
Polythiophene (PTh) phase electropolymerized on the stainless steel wire was evaluated as solid-phase microextraction (SPME), and analysis by liquid chromatography with spectrophotometric detection (LC-UV) for determination of new-generation antidepressants, selective serotonin reuptake inhibitors (SSRIs) (citalopram, paroxetine, fluoxetine and sertraline), in plasma samples. The influence of electropolymerization variables (scan rate, potential range and scan cycles) was evaluated on SPME performance. The SPME variables (extraction time, temperature, matrix pH, ionic strength and desorption procedure), as well as the influence of plasma proteins on sorption mechanisms were also evaluated. The SPME/LC-UV method developed for determination of antidepressants in plasma sample presented a linear range between the limit of quantification (LOQ, 200-250 ng mL-1) to 4000 ng mL-1, and interday precision with coefficient of variation (CV) ranged from 11 to 15%. The proposed method can be a useful tool for the determination of antidepressants in human plasma samples in urgent toxicological analysis after the accidental or suicidal intake of higher doses of medications.
Keywords: solid-phase microextraction, polythiophene, antidepressants, liquid chromatography
Introduction
Mood disorders represent a considerable portion of the diseases prevailing worldwide, with high suicide rates. The World Health Organization (WHO) estimates that depressive disorders will become the second most prevalent cause of illness-produced disability by 2020.1
Depressive disorders have been found to be significant risk factors for suicide. The use of drugs, like antidepressants
The development of highly efficient analytical instrumentation for the endpoint determination of drugs from biological samples involves sample pretreatment, which is usually necessary for the extraction, isolation and concentration of drugs encountered in complex matrices. This is because most analytical instruments cannot handle sample matrices directly.8
In the last decade, Arthur and Pawliszyn9 introduced
the solid-phase microextraction (SPME) technique. This solventless technique combines analyte extraction and concentration in a single step, thereby reducing the required time for sample preparation. SPME has been successfully applied to the extraction of volatile and semi-volatile drugs from various sample matrices.8-10 However, the application
of SPME to ionizable drug species is limited due to the neutral charge of commercial SPME coatings. This results in low coating/sample partition coefficient and poor analyte recovery. One promising alternative for the extraction of polar and ionic compounds is the use of conductive polymers as extraction phases.10,11
The conducting polymer coatings as polythiophene films12-16 presented multifunctional properties. Thus, their
polymerization on metal wires by electrochemical or chemical methods has been described as a promising alternative for the development of new phases for the SPME technique, therefore expanding the potential application of this method.17
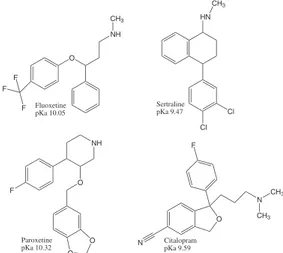
In the present work, polythiophene films were electropolymerized (cyclic voltammetry) on the surface of metal (stainless steel) wires, for the development of SPME phases. These polymeric films were evaluated as SPME phases for the liquid chromatography (LC) analysis of selective serotonin reuptake inhibitor (SSRI) antidepressants (Figure 1) in plasma samples for toxicological analysis purposes. The influence of plasma protein on the SPME process was also evaluated.
Experimental
Reagents and analytical standards
The fluoxetine and paroxetine analytical standards were donated by Eli Lilly Co. (Indianapolis, IN, USA) and Libbs Farmacêutica Ltda. (São Paulo-SP, Brazil), respectively. Citalopram and sertraline were acquired from F. Hoffmann-La Roche Ltd. (Basel, Switzerland).
The diluted standard solutions of antidepressants were prepared considering the therapeutic range. For this purpose, their respective stock solutions (1 mg mL-1) were
diluted in methanol. These solutions remained stable for 45 days when they were stored at −20 °C. The water used
to prepare the mobile phase was previously purified in a Milli-Q system (Millipore, Bedford, MA, USA).
Methanol, acetonitrile (both, HPLC grade), anhydrous dibasic sodium phosphate 99.4% and hydrochloric acid 38% were purchased from J. T. Baker Chemical Co. (Phillipsburg, NJ, USA). Monobasic monohydrate sodium phosphate 99.6% and sodium borate 99.5% were acquired from Mallinckrodt Baker Inc. (Phillipsburg, NJ, USA). Sodium perchlorate (NaClO4) and tetrabutylammonium
tetrafluoroborate (TBATFB) both 98% were provided by Acros Organics (Morris Plains, NJ, USA). The thiophene monomer 99% electrochemical grade was purchased from Sigma-Aldrich (St.Louis, MO, USA).
Plasma samples
The blank plasma (drug-free) with negative serology for hepatitis B and C, Chagas disease, HTLV I/II, TGP and syphilis was kindly supplied by Hospital das Clínicas de Ribeirão Preto (University of São Paulo, Ribeirão Preto-SP, Brazil).
The synthetic plasma sample was prepared by using sodium chloride (145 mmol L-1), potassium chloride
(4.5 mmol L-1), calcium chloride (32.5 mmol L-1), magnesium
chloride (0.8 mmol L-1), urea (2.5 mmol L-1) and d-glucose
(4.7 mmol L-1).18 The pH of synthetic plasma solution was
adjusted to 7.4 using sodium hydroxide solution (1 mol L-1).
Chromatographic conditions
All the analyses were performed on a Varian ProStar 230 liquid chromatograph (Palo Alto, CA, USA) with UV detector (λ = 230 nm). The drugs were separated in
a LiChrospher
60 RP-Select B (5 µm, 250 × 4 mm i.d.)
column equipped with an RP-Select B, LiCroCART
4-4 pre-column. The mobile phase consisted of methanol and phosphate buffer solution (0.05 mol L-1, pH 4.5) (60:40, v/v).
O NH CH3
Fluoxetine pKa 10.05
F
F F
Cl Cl HN
CH3
Sertraline pKa 9.47
O O O
NH
F
Paroxetine pKa 10.32
O F
N CH3
CH3
N Citalopram pKa 9.59
Elution was carried out in the isocratic mode at room temperature (25 °C) and flow rate of 1.0 mL min−1. The
mobile phase was filtered and degassed prior to use.
Electropolymerization process
For the development of SPME polythiophene phase, the cyclic voltammetry experiments were performed using a three-electrode system (Potentiostat/Galvanostat model PG Omnimetra 3901, coupled to a microcomputer operating with the software PG 3901). A platinum wire was utilized as the counter electrode, a silver/silver chloride (Ag/AgCl) electrode was used as reference and a cylindrical stainless steel 316 [1 cm × 2.32 mm i.d., composed of iron, nickel
(7 to 20%) and chromium (17 to 25%)] was employed as the working electrode. Initially, the stainless steel was polished with steel wool and washed with ultra-pure water in an ultrasonic bath for 30 min. These electrodes were kept in acetone.
For the electrodeposition of thiophene, 0.1 mol L-1
NaClO4 (electrolyte) in an acetonitrile solution containing
0.3 mol L-1 of the monomer was evaluated at a scan rate
of 50 mV s-1, within the −0.2 to 1.7 V potential range.
Furthermore, TBATFB (0.5 mol L-1) in acetonitrile solution
containing 0.3 mol L-1 of the monomer was also evaluated
at a scan rate of 100 mV s-1, within the −0.2 and 2.2 V
potential range.
The influence of the film thickness on the SPME performance was evaluated with 20 and 50 scan cycles for polythiophene electropolymerization in NaClO4
(0.1 mol L-1) solution, and with 10, 15, 20 and 30 cycles
in TBATFB (0.5 mol L-1) solution.
Scanning electron microscopy (SEM) of PTh coated SS surfaces
The surface of the polythiophene film coated on SS wire was cut into a 1 cm-long piece and then analyzed on a Zeiss EVO50 scanning electron microscope (20 kV accelerating potential).
Optimization of the SPME process
The SPME (electropolymerized polythiophene phase) variables such as time, temperature, matrix pH, sample volume and ionic strength were optimized in human plasma samples and investigated in triplicate assays. The stirring speed and polythiophene film dimension were kept constant during the optimization.
The influence of the matrix pH on the SPME performance was evaluated by the following procedure: in
a glass vial (5 mL) sealed with a silicone septum, 3.0 mL buffer solution [0.05 mol L-1, phosphate buffer (pH 4.0 and
7.0) and borate buffer (pH 9.0)] were added to 250 µL of a sample spiked with the drug standard solutions, which resulted in a drug concentration of 500 ng mL-1. The
polythiophene electropolymerized electrode was immersed into the sample and the extractions were performed under magnetic stirring at a rate of 1200 rpm for 40 min at 25 °C. Then, the polythiophene electrode was inserted into a conical vial containing the mobile phase (static mode, 250 µL) for 15 min at 25 °C. 20 µL of this extract were injected into the LC-UV system.
The volume of the plasma sample (250, 500 and 1000 µL), extraction time (10, 20, 30 and 40 min) and temperature (25, 40 and 50 °C) were optimized to establish the sorption equilibrium between the drugs and the extraction phase. The influence of ionic strength on the SPME performance was also examined by addition of NaCl (0, 5 and 10% m/v).
For the desorption process, different solvents were evaluated (water, methanol and mobile phase). After the desorption process, the electrode was washed with methanol/water (1:1, v/v) solution for 20 min to ensure total removal of the analytes and plasma endogenous compounds.
Results and Discussion
Electropolymerization process
Cyclic voltammetry is a convenient tool for the coating of metallic electrodes. The one-step production of films, the fiber-to-fiber reproducibility and the control of fiber thickness by changing the number of scan cycles must be highlighted among its advantages.19-21
Some organic solvents and supporting electrolytes have been used in the electropolymerization of polythiophene film and its derivatives.15,16,20 The electrochemical properties
of polythiophene films largely depend on the supporting electrolyte, especially on the type of anion.22-25 According
to Wu and Pawliszyn,26 the use of different electrolytes
enables manipulation of the functionality of the resulting polymers. Therefore, two electrolyte solutions (namely TBATFB and NaClO4) in acetonitrile were evaluated for
the electrodeposition of polythiophene in order to increase the selectivity and efficiency of the extraction phase.12,27
The polythiophene phase electropolymerized in TBATFB/acetonitrile 0.5 mol L-1 electrolyte solution
by mean of 20 scan cycles resulted in homogenous and more stable films, as well as higher SPME efficiency. The polythiophene phase electropolymerized using over 20 scan cycles resulted in a morphologically unstable film regarding the SPME process.
The obtained cyclic voltammogram using the prepared electrode under the optimal electrodeposition conditions is shown in Figure 2.
The shape and the peak positions observed in the cyclic voltammograms can reflect the properties of the polymer.28
The increasing current on successive cycles shows that the thickness polymer is increasing. The regular increase of the current on successive cycles also illustrates that the polymer is regularly increasing into a packed structure (Figure 2).
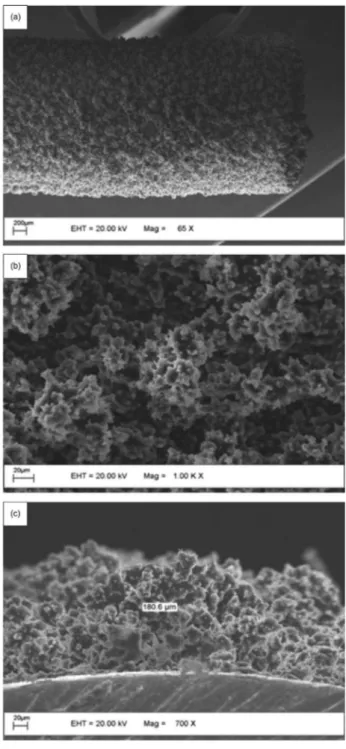
The morphology of the polythiophene phase (optimized electropolymerization conditions) was investigated by scanning electron micrography (SEM) (Figure 3). According to the SEM images, these films presented porous structure, which resulted in larger surface areas and favored the extractive capacity of the polymeric phase (Figure 3a and b). The thickness of the polythiophene coating (ca. 180.6 µm) was also estimated by SEM (Figure 3c).
According to the SS wire geometry (surface area 0.771 cm2) and the polythiophene coating average thickness
(180.6 µm), the developed polythiophene film presented an approximate volume of 14 µL.
Optimization of SPME variables
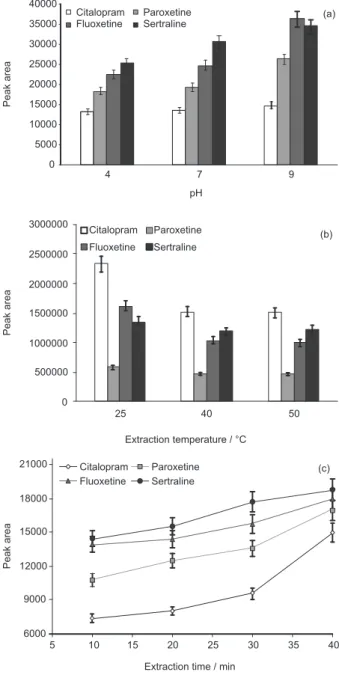
Drug ionization is related to the pH of the matrix (biological fluid), so the this variable could affect SPME performance. Thus, the pH adjustment could improve the sensitivity of the method.29 As shown in Figure 4a,
the dilution of the plasma sample with phosphate buffer 0.05 mol L-1 pH 9.0 increased the efficiency of the SPME
procedure. In this condition, the drugs were partially ionizable, according to the pKa of the antidepressants (9.47 to 10.32).10,30 Plasma dilution with buffer solution at
pH values higher than 9.0 resulted in precipitation of the proteins, thus, pH values above pH 9.0 were not evaluated.
The increase in the extraction temperature from 25 to 50 °C decreased the average peak area of the extracted drugs (Figure 4b). With a temperature increase, diffusion coefficients and Henry`s constants are increased and partition coefficients to the extraction phase are decreased.31 Figure 2. Cyclic voltammogram for the electrodeposition of polythiophene
(SS electrode) in TBATFB/acetonitrile solution (0.5 mol L-1) at a scan rate
of 100 mV s-1, during 20 cycles.
Thus, the subsequent extraction was carried out at room temperature (25 °C) to ensure stability and robustness of the polythiophene films.
Representative extraction time profiles (10-40 min) at 25 °C are shown in Figure 4c. Although the sorption equilibrium had not been reached at 40 min, this time was selected for subsequent analysis to save time. However, the extraction time and mass transfer conditions were strictly controlled to ensure good precision.29
Olszowy et al.16 compared the extraction efficiency of
SPME-PTh phases to adrenolytic drug analysis in aqueous and plasma medium. The equilibrium time for this analysis had not been found until 16 min for both samples (aqueous
and plasma). So, the authors conducted extractions out of equilibrium time (10 min) to improve the total time analysis.16
In the selected condition (pH 9.0, 40 min and 25 ºC), the proposed SPME-polythiophene/LC method displayed precision and accuracy for analysis of antidepressants. In agreement with Figure 4c, the competitive process among drugs and polythiophene phase was not observed up to 40 min.
The influence of the ionic strength on the extraction process was evaluated by adding NaCl to the plasma sample (0, 5 and 10%) (data not shown). The polythiophene phase exhibited reduced extraction efficiency in saline solution because of the competition among the salt cations and the analytes. Probably, this happened due to electrostatic or ion-pairing interactions. This likely reduced the ability of the drugs to move into the fiber coating.8 In low saline
concentration, there was no change in the extraction performance.
Among the evaluated solvents for the desorption process (water, methanol and mobile phase), the mobile phase (phosphate buffer 0.05 mol L-1, pH 4.5 and methanol
40:60, v/v) gave the best SPME performance (data not shown). The polythiophene phase showed to be stable in mobile phase.
Since the SPME process based on equilibrium sorption is not exhaustive (i.e., only a fraction of the sample is extracted),31,32 the volume of the plasma sample was also
optimized. Different sample volumes (250, 500 and 1000 µL) were subjected to SPME-PTh/LC-UV analysis (Figure 5). According to the obtained results, a plasma sample volume above 250 µL slightly increases the efficiency of the polythiophene fiber on SPME performance. However, a small plasma volume, which was diluted with buffer solution, decreased the matrix viscosity and increased the diffusion
Figure 4. The effect of pH of plasma samples (a), temperature (b) and time (c) on SPME performance.
Figure 5. The effect of plasma sample volume on SPME performance: plasma sample spiked with antidepressants at a concentration of 1000 ng mL-1 and diluted in 3.0 mL phosphate buffer, pH 9.0, 0.05 mol L-1 under
coefficients. This could reduce the extraction time and increase the lifetime of the polythiophene phase.
The optimized results, among those evaluated for direct SPME-PTh, were obtained under the conditions: 250 µL plasma sample diluted with 3.0 mL borate buffer solution (0.05 mol L-1, pH 9.0), followed by immersion of
the polythiophene electropolymerized electrode into the sample. The extractions were performed under magnetic stirring at a rate of 1200 rpm for 40 min at 25 °C. For the desorption process, the polythiophene electrode was inserted into a conical vial containing the mobile phase (static mode, 250 µL) for 15 min at 25 °C.
Analytical validation of the SPME-PTh/LC method
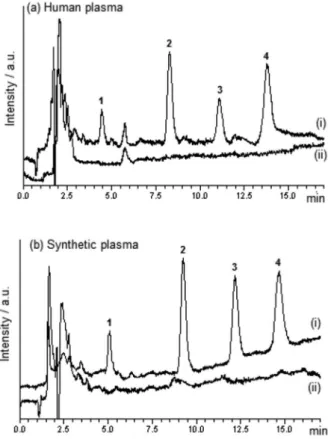
The selectivity of the SPME/LC method can be demonstrated by the chromatograms of (i) blank plasma spiked with antidepressants at 500 ng mL-1 and (ii)
blank plasma (Figure 6). These chromatograms do not present interfering peaks at the retention time of the antidepressants. The synthetic plasma consisted of a solution with ionic strength and viscosity similar to that of the human plasma, but without the presence of human plasma proteins.18
Antidepressants may be prescribed in combination with different psychotropic agents and other drugs. Consequently, an evaluation of the interference (co-elution) of potential co-administered drugs was required. Different drug standards were injected in the LC-UV system to evaluate the co-elution with the analytes in the applied chromatographic conditions (Table 1). On the basis of the retention times, other drugs do not co-elute with the analytes.
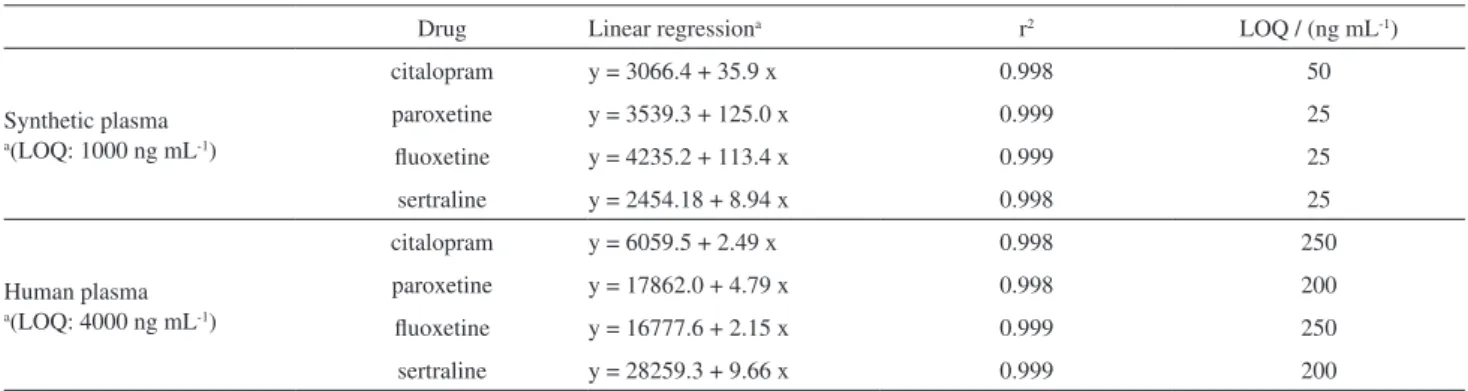
The linearity and limit of quantification (LOQ) of the proposed SPME-PTh/LC method for human and synthetic plasma samples are illustrated in Table 2. The evaluated intervals for both plasma samples were linear, with correlation coefficients greater than 0.998. The LOQ was determined as the lowest concentration of the calibration curve, with CV lower than 15%, and chromatographic signal ten times greater than the signal-to-noise ratio.
The angular coefficients of the calibration curve (method sensitivity) and LOQ values of the SPME-PTh/LC method obtained for the synthetic plasma are lower than those obtained for the human plasma, Table 2.
The sensitivity of the SPME-PTh/LC method in human plasma samples could be improved using a fluorescence detector, which presented LOQ values in the order of 50 ng mL-1 (data not shown).
Table 3 lists the values of interassay precision and accuracy of the SPME-PTh/LC method for determination of antidepressants in synthetic and human plasma samples.
Although the sensitivity of the method were reduced due to adsorption of plasma endogenous compounds onto the SPME phase (matrix effect), the polythiophene phase presented selectivity for extraction of antidepressants from the plasma sample.
Figure 6. SPME/LC chromatograms of (i) blank plasma spiked with antidepressants at 500 ng mL-1 and (ii) blank plasma, for analysis of
(a) human plasma and (b) synthetic plasma, containing (1) citalopram, (2) paroxetine, (3) fluoxetine and (4) sertraline.
Table 1. Retention time of the studied drugs as possible interferents
Drugs Retention time / min
Ascorbic acid 1.05
Primidone 1.95
Caffeine 2.58
Phenacetine 3.14
Diclofenac 3.67
Moclobemide 3.73
Diazepam 4.19
Propanolol 5.04
Citalopram 5.21
Clonazepam 5.85
Carbamazepine 5.97
Phenytoin 6.13
Mirtazapine 7.34
Paroxetine 9.72
Fluoxetine 13.06
In addition, the relative recovery (Table 4) of drugs from human plasma compared with drug recovery from synthetic plasma was also calculated by using the mean slopes of the constructed curves for the human and synthetic plasma samples (equation 1). The relative recovery correlates the analytical sensitivity of the method in different matrices, human and synthetic plasma samples, thus illustrating the effect of the endogenous compounds on the SPME process.
(1)
The recovery rates of the plasma samples of the SPME/LC method using polythiophene phase for determination of adrenolytic drugs (metoprolol, oxprenolol, mexiletine, propranolol and propaphenon) were lower than those obtained for aqueous samples. The authors did not obtain enough sensitivity for therapeutic drug monitoring analysis (LC-UV method), but according to them, some modifications could improve the method sensitivity.16
The fiber-to-fiber reproducibility, or rather, the reproducibility of the electrochemical coating procedure,
was also investigated. The average results (n = 5) from the SPME-PTh/LC determination carried out with three different fibers were very similar, with coefficients of variation (CV) ranging from 7 to 13%. These assays were carried out with human plasma samples spiked with drugs (500 ng mL-1).
Conclusion
The developed PTH film electropolymerized in acetonitrile solution containing TBATFB is an inexpensive promising alternative for the development of new phases for the SPME technique.
Although the sensitivity of the method was reduced due to adsorption of plasma endogenous compounds onto the SPME phase (matrix effect), the polythiophene phase presented selectivity for extraction of antidepressants from the plasma sample. The competitive process (limited number of surface sites) among drugs and polythiophene phase was not observed.
The sensitivity of the SPME-PTh/LC method in human plasma samples could be improved using a fluorescence detector, which presented LOQ values in the order of 50 ng mL-1.
The proposed method can be a useful tool for the determination of antidepressants in human plasma samples in urgent toxicological analysis after the accidental or suicidal intake of medication in higher doses.
Table 2. Linearity and limit of quantification (LOQ) of SPME-PTh/LC for simultaneous analysis of antidepressants in plasma samples
Drug Linear regressiona r2 LOQ / (ng mL-1)
Synthetic plasma
a(LOQ: 1000 ng mL-1)
citalopram y = 3066.4 + 35.9 x 0.998 50
paroxetine y = 3539.3 + 125.0 x 0.999 25
fluoxetine y = 4235.2 + 113.4 x 0.999 25
sertraline y = 2454.18 + 8.94 x 0.998 25
Human plasma
a(LOQ: 4000 ng mL-1)
citalopram y = 6059.5 + 2.49 x 0.998 250
paroxetine y = 17862.0 + 4.79 x 0.998 200
fluoxetine y = 16777.6 + 2.15 x 0.999 250
sertraline y = 28259.3 + 9.66 x 0.999 200
Table 3. Accuracy and inter-assay precision (coefficient of variation, CV) of the SPME-PTh/LC-UV method for analysis of plasma samples
Drugs
Added concentration /
(ng mL-1)
Accuracy / % (n = 5)
CV / % (n = 5)
Synthetic plasma
citalopram 50 101 5.6
paroxetine 25 98 3.7
fluoxetine 25 112 3.9
sertraline 25 92 6.8
Human plasma
citalopram 250 82 13
paroxetine 200 76 15
fluoxetine 250 87 11
sertraline 200 79 14
Table 4. Ratio between the slopes of the SPME/LC calibration curves obtained for the human and synthetic plasma samples, and recovery, as estimated by equation 1
Drugs Ratio between
the slopes
Relative recovery / %
Citalopram 0.25 25
Paroxetine 0.19 19
Fluoxetine 0.39 39
Acknowledgments
This work was supported by grants from Fundação de Amparo à Pesquisa do Estado de São Paulo (FAPESP) and Conselho Nacional de Desenvolvimento Científico e Tecnológico (CNPq).
References
1. Feldmann Jr., R. E.; Sawa, A.; Seidler, G. H.; J. Psychiatr. Res. 2007, 41, 713.
2. Nash, J.; Nutt, D.; Psychiatry2007, 6, 289.
3. Frey, R.; Schreinzer, D.; Stimpfl, T.; Vycudilik, W.; Berzlanovich, A.; Kasper, S.; Eur. Neuropsychopharmacol.2000, 10, 133. 4. Ohberg, A.; Vuori, E.; Klaukka, T.; Lonnqvist, J.; J. Affect.
Disord.1998, 50, 225.
5. Jick, S. S.; Dean, A. D.; Jick, H.; Br. Med. J.1995, 310, 215. 6. Rubino, A.; Roskell, N.; Tennis, P.; Mines, D.; Weich, S.;
Andrews, E.; Br. Med. J.2007, 334, 242.
7. Malmvik, J.; Liiwenhielm, C. G. P.; Melander, A.; Eur. J. Clin.
Pharmacol.1994, 46, 291.
8. Kataoka, H.; Trends Analyt. Chem.2003, 22, 232. 9. Arthur, C. L.; Pawliszyn, J.; Anal. Chem. 1990, 62, 2145. 10. Chaves, A. R.; Chiericato Jr., G.; Queiroz, M. E. C.;
J. Chromatogr., B: Anal. Technol. Biomed. Life Sci.2009,
877, 587.
11. Wu, J.; Pawliszyn, J.; Anal. Chim. Acta2004, 520, 257. 12. Gbatu, T. P.; Ceylan, O.; Sutton, K. L.; Rubinson, J. F.; Galal, A.;
Caruso, J. A.; Mark Jr., H. B.; Anal. Commun.1999, 36, 203. 13. Yates, B. J.; Temsamani, K. R.; Ceylan, O.; Oztemiz, S.; Gbatu,
T. P.; La Rue, R. A.; Tamer, U.; Mark Jr., H. B.; Talanta2000,
58, 739.
14. Tamer, U.; Yates, B.; Galal, A.; Gbatu, T.; LaRue, R.; Schmiesing, C.; Temsamani, K.; Ceylan, O.; Mark Jr., H.;
Microchim. Acta2003, 143, 205.
15. Olszowy, P.; Szultka, M.; Fuchs, P.; Kegler, R.; Mundkowski, R.; Miekisch, W.; Schubert, J.; Buszewski, B.; J. Pharm. Biomed. Anal.2010, 53, 1022.
16. Olszowy, P.; Szultka, M.; Ligor, T.; Nowaczyk, J.; Buszewski, B.;
J. Chromatogr., B: Anal. Technol. Biomed. Life Sci.2010,
878, 2226.
17. Mehdinia, A.; Ghassempour, A.; Rafati, H.; Heydari, R.; Anal.
Chim. Acta2007, 587, 82.
18. Holme, S.; Heaton, W. A.; Transfus. Sci.1994, 15, iv. 19. Bagheri, H.; Babanezhad, E.; Es-haghi, A.; J. Chromatogr., A
2007, 1152, 168.
20. Li, X.; Li, C.; Chen, J.; Li, C.; Sun, C.; J. Chromatogr., A 2008,
1198-1199, 7.
21. Huang, M.; Jiang, G.; Cai, Y.; J. Sep. Sci.2005, 28, 2218. 22. Kabasakaloglu, M.; Kiyak, T.; Toprak, H.; Aksu, M. L.; Appl.
Surf. Sci. 1999, 152, 115.
23. Shen, L.; Xu, J.; Wei, Z.; Xiao, Q.; Pu, S.; Eur. Polym. J.2005,
41, 1738.
24. Abou-Elenien, G. M.; El-Maghraby, A. A.; El-Abdallah, G. M.;
Synth. Met. 2004, 146, 109.
25. Vignali, M.; Edwards, R. A. H.; Serantoni, M.; Cunnane, V. J.;
J. Electroanal. Chem. 2006, 591, 59.
26. Wu, J.; Pawliszyn, J.; J. Chromatogr., A 2001, 909, 37. 27. Sarac, A. S.; Geyik, H.; Parlak, E. A.; Serantoni, M.; Prog. Org.
Coat. 2007, 59, 28.
28. Zhou, M.; Heinze, J.; Electrochim. Acta 1999, 44, 1733. 29. Mester, Z.; Sturgeon, R.; Spectrochim. Acta, Part B2005, 60,
1243.
30. Vasskog, T.; Berger, U.; Samuelsen, P. J.; Kallenborn, R.; Jensen
E.; J. Chromatogr., A2006, 1115, 187.
31. Lord, H.; Pawliszyn, J.; J. Chromatogr., A2000, 902, 17. 32. Theodoridis, G.; Koster, E. H. M.; de Jong, G. J.; J. Chromatogr.,
B: Anal. Technol. Biomed. Life Sci. 2000, 745, 49.
Submitted: December 20, 2010
Published online: October 18, 2011