Article
Printed in Brazil - ©2015 Sociedade Brasileira de Química0103 - 5053 $6.00+0.00A
*e-mail: [email protected]
Size Reduced Iron Nitroprusside Particles: an Electrochemical Mediator for the
Quantification of Peroxodisulfate and Nitrite
Samrat Devaramani,a Ramakrishnappa Thippeswamy*,a and Nathan S. Lawrenceb
aCenter for Nano and Material Sciences, Kanakapura Main Road, Jakkasandra, 562112 Karnataka, India
bSchlumberger Cambridge Research, High Cross, Madingley Road, CB3 0EL Cambridge, UK
Iron nitroprusside (FeNP) particles have been synthesized from drop by drop (n-FeNP) and bulk mixing (BM) (b-FeNP) methods. FeNP particles obtained from both methods were characterized using X-ray diffraction (XRD) and scanning electron microscopy (SEM). n-FeNP particles were used in constructing modified carbon paste electrode (CPE), which has been further used for electrochemical studies. The effect of pH and electrolyte cation on the electrochemical behavior of n-FeNP modified CPE has been studied in detail. Oxidation of nitrite and reduction of peroxodisulfate reactions have been electrocatalyzed at two redox centers of n-FeNP modified CPE. Based on the electrochemical experiments conducted and Tafel plots, mechanism for both the reactions has been proposed. Both the analytes were estimated in soil and ground water samples using n-FeNP modified CPE and the results were validated with the help of standard methods.
Keywords: size reduced, iron nitroprusside, peroxodisulfate, nitrite, soil, water sample
Introduction
Peroxodisulfate is used in several industries for various purposes such as chemical etching in the electronics industry, for pulp and paper processing in paper industry, in primary components of consumer products such as hair coloring, swimming pool treatment products and used in food additives as a flour treatment agent. It is frequently used as a cause for ground water decontamination and soil remediation.1 Peroxodisulfate is very hazardous when it is
in contact with skin, eyes, ingested and inhaled. Prolonged exposure may result in skin burns and ulcerations with over-exposure by inhalation causing respiratory irritation.2
Electroreduction of peroxodisulfate anion, its dependences on the various factors and complications caused by adsorbate formation were studied.3 Polynuclear
mixed-valent metal oxide/metalocyanide and heteropolytungstate composite films were prepared but only electrocatalytic reduction of peroxodisulfate was performed on them just to check their electrocatalytic mediation without giving much emphasis on developing method for peroxodisulfate.4-6
Few methods have been reported for the detection of peroxodisulfate using Prussian Blue, poly(brilliant cresyl blue) and naphthol green B.7-10
Nitrite enters environment from inorganic fertilizer, sewage, human and farm animal waste. It is used as an antimicrobial, a color fixative and a preservative agent in food products.11 Hence, nitrite has become ubiquitous in
environmental and in food systems. Due to the potential toxicity of the nitrite, serious concerns have been raised on its levels in various matrices.12 World Health Organization
recommends 3 mg L-1 nitrite as the maximum limit
in drinking water.13 Nitrite can diminish the
oxygen-carrying capability of an infant’s blood, causing the skin to turn a bluish color called blue baby syndrome.14
It can also react with amines to form carcinogenic
N-nitrosamines.15,16 Compton and co-workers17 have
reviewed the importance, various strategies adopted for the development of methods for the detection and determination of nitrite. Some important reaction pathways that form the basis for most of the methods are generalized. Developed methods spill in various categories such as florescence,18,19 spectrophotometry,20-22 chromatography23
and electrochemistry.24-27 Among them electrochemical
methods are known to be advantageous because they are sensitive and less laborious. Wide variety of substances like pthalocyanine complex of iron or copper,28,29 organic
compound such as p-duroquinone (tetramethyl-p
-benzoquinone),30 copper nanoparticles,31 and surfactant
used as the mediators for the electrocatalytic oxidation of nitrite to develop electrochemical methods. Nitrite was quantified on the carbon paste electrode modified with Prussian Blue complex. Also the mechanistic parameters, such as anodic transfer coefficient, Tafel slope, and standard heterogeneous second order rate constant were evaluated.33 Similarly another polynuclear mixed metalion
complex, i.e., palladium pentacyanonitrosyl ferrate has been chemically deposited on the aluminum electrode and worked as an electrochemical sensor for the quantification of nitrite. The mechanism and kinetics of the catalytic oxidation of nitrite reaction were investigated using cyclic voltammetry, rotating disk electrode (RDE) voltammetry and chronoamperometry.34
Prussian Blue (PB) or ferric hexacyanoferrate is one of the coordination compounds known since ancient days. Other metal hexacyanoferrates (MHCF) where M = Cu, Ni, Pb, Ag, Co, etc., are known as Prussian Blue analogues. Karyakin35 reviewed the fundamental aspects
of deposition, structure and electrochemistry of Prussian Blue and its analogues. Because of the sensitivity and selectivity MHCF have been used as electrochemical sensors for the electroinactive ions like Tl+, Cs+, K+,36-38
easily oxidizable organic and inorganic compounds,39,40
transducer for hydrogen peroxide and also as biosensors.41,42
Hence, MHCFs can be considered as advanced sensing materials. Pentacyanonitrosyl ferrate is also called as a nitroprusside and it can be considered as another important member of polycyanide metal complexing agents. Similar to hexacyanoferrate, nitroprusside also reacts with various metal ions like Fe, Cu, Ni, Pb, Ag, Co, etc., to form the respective metal nitroprussides. Cadmium nitroprusside has been electrodeposited on glassy carbon electrode (GCE) and the various parameters influencing its electrochemical behavior were studied in detail.43 Conducting surfaces
like glassy carbon or aluminum electrodes are generally used for the electrodeposition of wide variety of metal nitroprussides from the aqueous solution containing a mixture of metal ion and nitroprusside ion or any one of them. Those modified electrodes were used for sensing sulfide, iodide, hydrazine, ascorbic acid, dopamine, etc.44-48 Carbon ceramic electrodes have been constructed
using lead and tin nitroprussides as the modifiers and used for the detection of L-cysteine and hydrogen peroxide.49,50
It is clear that metal nitroprussides also undergo reversible electron transfer and got wide applications like Prussian Blue and its analogues. Iron nitroprusside (FeNP) possesses two redox centers at the formal potentials 0.18 and 0.86 V, very similar to PB.51,52 Though its
electrochemical properties are very similar to PB, FeNP has not been utilized as much as Prussian Blue.
From the above literature it is clear that peroxodisulfate/ nitrite ions exist in water samples, soil matrices and food products. Due to the potential toxicity and ubiquitous nature, there is a pressing need for the development of method for the determination of both analytes. Size reduced FeNP particles (n-FeNP) have been synthesized and used as a modifier to construct FeNP modified carbon paste electrode (CPE). Two sets of redox peaks exhibited by the n-FeNP modified CPE were used as the reaction centers for the electrocatalytic reduction of peroxodisulfate and nitrite oxidation. Water and soil matrices have been selected to examine the applicability of the prepared sensor.
Experimental
Materials
All experiments were carried out using double distilled water. All chemicals used are of analytical grade obtained from Sigma-Aldrich and used as received. Electrolyte solutions have been prepared by dissolving the respective salts in suitable buffer solutions.
A solution of 0.5 mol L-1 KNO
3 has been prepared by
dissolving appropriate quantity of KNO3 salt in buffer
solution of desired pH. This solution is used as electrolyte. Acetate and phosphate solutions of 0.1 mol L-1 have been
used to prepare buffer solutions.
Iron nitroprusside: synthesized using both bulk mixing and drop by drop methods inspired by the literature procedure53 briefly described below.
Drop by drop (DbD) method: using dropping funnel 10 mL of 0.01 mol L-1 sodium nitroprusside aqueous
solution was added dropwise to 10 mL of 0.02 mol L-1
ferrous ammonium sulfate solution which was under vigorous stirring and thermostated at 5-10 °C. Iron nitroprusside complex obtained from this procedure is addressed as n-FeNP here onwards.
Bulk mixing method: 10 mL each of 0.01 mol L-1
sodium nitroprusside and 0.02 mol L-1 ferrous ammonium
sulfate maintained at 5-10 °C were mixed at once. Iron nitroprusside complex obtained from this procedure is addressed as b-FeNP here onwards.
CPEs: modified and bare CPEs were constructed by following the same composition and procedure explained in the literature.53 Handmade modified carbon paste electrode
was prepared by thoroughly mixing the graphite powder with n-FeNP at 15:1 mass ratio and adding 38% (m/m) of mineral oil to the overall weight. Then, the resulting mixture was finely mixed by grinding in an agate mortar for 10-15 min. The obtained paste was packed into the capillary tube from the wider end. A copper wire was inserted from the opposite end of the capillary to obtain the electrical contact. Bare carbon paste electrode was prepared by following the above procedure but without using modifier, i.e., FeNP. These electrodes were dried for 24 h at room temperature and the resistivity was measured using a multimeter, which has been found to be 10-15 Ω.
Instrumentation
Electrochemical experiments were performed using CH Instruments electrochemical work station (model CHI 660D) in a standard three electrode cell. Modified carbon paste electrode was used as a working electrode, Pt wire as the counter electrode and Ag/AgCl as the reference electrodes. All the samples were characterized by X-ray diffraction (XRD) (Bruker aXS Model D8 Advance powder X-ray diffractometer, Cu Kα source λ = 1.5418 Å, θ-2θ geometry).
Infrared (IR) spectra were recorded using a Bruker Alpha-T FTIR spectrometer (diamond crystal attenuated total reflectance (ATR) mode, resolution 4 cm-1, 400-4000 cm-1).
Scanning electron micrographs (SEM) were obtained using Quanta-200 scanning electron microscope by dispersing sample on a conducting carbon tape.
Methods
Procedure for cyclic voltammetry
Ten milliliters of 0.5 mol L-1 KNO
3 solution was taken
in the electrochemical cell with three electrode system. Nitrogen gas was purged slowly for about 15 min to remove the dissolved oxygen. Then, the cyclic voltammogram was recorded by sweeping the potential from –0.2 to 1.2 V with a scan rate of 0.05 V s-1.
Procedure for amperometry
Ten milliliters of 0.5 mol L-1 KNO
3 solution was taken
in the electrochemical cell with three electrode system. Nitrogen gas was purged slowly for about 15 min to remove the dissolved oxygen. The electrolyte solution was kept stirring at the rate of 300 rpm. Potential of the solution was kept at 0.1 V vs. saturated calomel electrode (SCE) for
peroxodisulfate and 1.15 V vs. SCE in case of nitrite. Once
the background current reached a constant value, aliquots of the analyte were added by successive addition method and the amperogram was recorded.
Sample preparation
Water sample was analyzed without any pretreatment just after filtering using Whatman filter paper No. 41. Soil sample was prepared using the procedure described by Pandurangappa and Venkataramanappa54 with small
modification. Soil sample was collected from the agriculture land. It has been dried and ground to get a fine powder. Then it was sieved with 20 mesh sieves. One gram of soil sample was taken in a beaker and extracted using 5 mL 0.5% CaCO3 for five times. Mixture was centrifuged
to get a clear solution. Clear centrifugate was collected and made up to the mark with distilled water in 50 mL volumetric flask.
Results and Discussion
Characterization of iron nitroprusside particles
Synthesized FeNP was characterized using XRD and SEM to obtain the information about their phase purity, surface morphology and size of the particles. XRD pattern (Figure 1a) consisted of sharp reflections at d-spacing corresponding to b-FeNP and it is well synchronized with the XRD pattern of Crystallographica pdf No. 1-239. SEM images of FeNP synthesized from both the methods were compared. Size of the FeNP particles was observably decreased and the agglomeration was found to be significantly less in case of particles obtained from drop by drop method. In contrast to this, bigger and completely agglomerated FeNP particles resulted from the bulk mixing method (Figure 1b). The decrease in size and less agglomeration of the particles obviously result in the enhanced electrocatalytic activity.55 Hence, n-FeNP has
been used in all further studies.
Optimization studies
Effect of pH
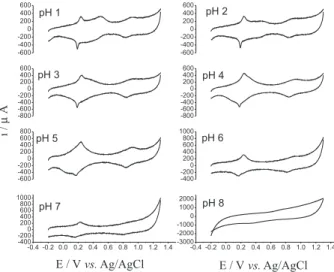
Effect of pH on the behavior of n-FeNP modified CPE was studied over the pH range 1-8 using 0.05 mol L-1
acetate and phosphate buffers containing 0.5 mol L-1
KNO3. In acidic conditions (pH 1-5) redox couples at
0.18 and 0.86 V were observed due to Fe(III)/Fe(II) and [Fe(II)(CN)5NO]/[Fe(III)(CN)5NO] conversions,
respectively,56 with little effect of pH on peak potentials
couples disappeared as the pH of the solution raised to 8 (Figure 2). This can be explained due to hydrolysis of FeNP in alkaline condition.57 After analyzing the obtained data, pH 4
was chosen as the optimum condition for further analysis. Also, from the literature, it was clear that optimized pH is suitable for the analysis of nitrite and peroxodisulfate.34,58
Effect of electrolyte cation
During the electrochemical process there will be change in the charge of the complex anion of the n-FeNP mediator and this will be compensated by the electrolyte cations present in the solution. Hence, performance of different alkali metal cations has been tested in maintaining the electroneutrality of the FeNP. Cyclic voltammograms (CVs) were recorded for n-FeNP modified CPE in 0.5 mol L-1 solution of different cations, i.e., Li+, Na+ and
K+, prepared using acetate buffer solution of pH 4 (CVs
not shown). Well-defined voltammograms with good peak currents are observed in the case of K+ ions, however, poorer
responses with decreased peak currents were observed with other cations. This behavior is commonly observed in case of metal hexacyanoferrates and metal nitroprussides due to their zeolite (cage)-like structure.51,59,60 Size of the
hydrated-cation radii is in the reverse order as that of their
cation radii. Hence, the hydrated K+ ions have the smallest
size (1.25 Å) while the hydrated Na+ and Li+ ions have the
greatest size (1.85 and 2.35 Å, respectively). Cage radius of the FeNP might be smaller than that of hydrated Na+
and Li+ ions but is greater than that of the hydrated K+
ions, hence, K+ ions can easily diffuse through the lattice
structure of the n-FeNP complex and this results in
well-Figure 1. (A) XRD pattern of b-FeNP compound synthesized by bulk mixing method. (B) SEM images of FeNP prepared from bulk mixing (a) and DbD
(b) methods.
-600 -400 -200 0 200 400 600
-600 -400 -200 0 200 400 600
-800 -600 -400 -200 0 200 400 600
-800 -600 -400 -200 0 200 400 600
-600 -400 -2000 200 400 600 800
-400 -200 0 200 400 600 800 1000
-0.4 -0.2 0.0 0.2 0.4 0.6 0.8 1.0 1.2 1.4 -400
-200 0 200 400 600 800 1000
-0.4 -0.2 0.0 0.2 0.4 0.6 0.8 1.0 1.2 1.4 -3000
-2000 -1000 0 1000 2000
pH 2
pH 3 pH 4
pH 5 pH 6
E / Vvs.Ag/AgCl
i
/
µ
A
pH 7 pH 1
E / Vvs.Ag/AgCl
pH 8
Figure 2. Cyclic voltammograms of n-FeNP modified CPE recorded in 0.5 mol L-1 KNO
defined voltammograms.61 Thus, 0.5 mol L-1 KNO
3 solution
was used in all further studies.
Characterization of iron nitroprusside particle modified carbon paste electrode
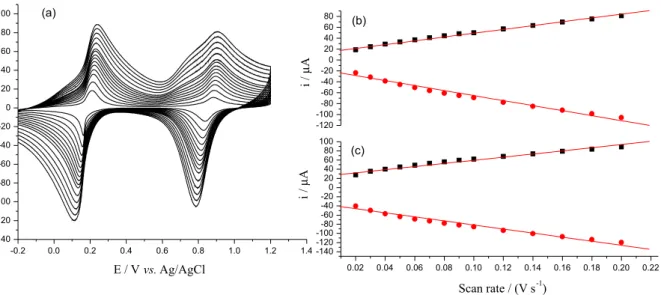
CVs were recorded for n-FeNP modified CPE in 0.5 mol L-1 KNO
3 solution of pH 4 at 0.05 V s-1 (Figure 3a),
and consist of two redox couples, one at 0.18 V and the other at 0.86 V due to the conversion of Fe(III)/Fe(II) and [Fe(II)(CN)5NO]/[Fe(III)(CN)5NO], respectively, which is
consistent with literature data.52 To confirm that the redox
reaction occurring at the n-FeNP modified CPE is surface confined, CVs were recorded for the n-FeNP modified CPE at different scan rates (Figure 3a). Anodic and cathodic currents resulting at +0.15 and +0.87 V were plotted against scan rates (Figures 3b and 3c). Both anodic and cathodic currents at two potentials were directly proportional to the scan rates over the range studied. This confirms the redox process occurring on the modified electrode is surface confined.62
Characterization of redox reactions on iron nitroprusside particle modified carbon paste electrode
CVs were recorded in the absence and presence of 0.6 mmol L-1 nitrite in 0.5 mol L-1 KNO
3 at pH 4 and
0.05 V s-1 (Figure 4). Anodic peak current was significantly
increased with decrease in the cathodic peak current at +0.86 V. This infers the mediated oxidation of nitrite at the n-FeNP modified CPE.
Similarly, CVs were recorded in the absence and presence of 1 mmol L-1 peroxodisulfate (Figure 5). Cathodic
peak current was considerably increased with decrease in the anodic peak current at 0.18 V due to the electrocatalytic
reduction of peroxodisulfate without altering the redox peaks at 0.86 V. Therefore, electrocatalytic oxidation of nitrite and reduction of peroxodisulfate can be carried out using the n-FeNP modified CPE.
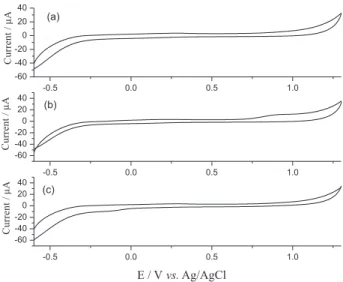
Then, CVs were recorded for the bare CPE in the absence and presence of both the analytes by following the above-described CV procedure (Figure 6). Electrocatalytic response of the n-FeNP modified CPE towards the analytes was comparatively greater when compared with that of the bare CPE.
To understand the type of process involved in the oxidation of nitrite and reduction of peroxodisulfate, CVs were recorded using n-FeNP modified CPE in the presence of 2 mmol L-1 peroxodisulfate and 0.6 mmol L-1 nitrite at
varied scan rates (not shown). Electrocatalytic currents
-0.2 0.0 0.2 0.4 0.6 0.8 1.0 1.2 1.4
-140 -120 -100 -80 -60 -40 -20 0 20 40 60 80 100 i / µ A
E / Vvs.Ag/AgCl (a)
0.02 0.04 0.06 0.08 0.10 0.12 0.14 0.16 0.18 0.20 0.22 -140 -120 -100 -80 -60 -40 -20 0 20 40 60 80 100 -120 -100 -80 -60 -40 -20 0 20 40 60 80 i / µ A i / µ A (c) (b)
Scan rate / (V s-1)
Figure 3. (a) Overlaid cyclic voltammogram of n-FeNP modified CPE in 0.5 mol L-1 KNO
3 solution of pH 4 at varied scan rates, i.e., from 0.02-0.2 V s-1;
(b) plot of Iaand Icat 0.87 V vs. scan rate; (c) plot of Ia and Icat 0.15 V vs. scan rate.
-0.4 -0.2 0.0 0.2 0.4 0.6 0.8 1.0 1.2 1.4
-0.2 -0.1 0.0 0.1 0.2 0.3 0.4 0.5 0.6
E / V
i / µ A (a) (b)
Figure 4. Overlaid CVs of n-FeNP modified CPE in 0.5 mol L-1 KNO 3
solution of pH 4 in the absence (a) and in the presence (b) of 0.6 mmol L-1
nitrite at 0.05 V s-1 scan rate.
-0.2 0.0 0.2 0.4 0.6 0.8 1.0 1.2 1.4
-140 -120 -100 -80 -60 -40 -20 0 20 40 60 80 100 i / µ A
E / Vvs.Ag/AgCl (a)
0.02 0.04 0.06 0.08 0.10 0.12 0.14 0.16 0.18 0.20 0.22
-140 -120 -100 -80 -60 -40 -20 0 20 40 60 80 100 -120 -100 -80 -60 -40 -20 0 20 40 60 80 i / µ A i / µ A (c) (b)
Scan rate / (V s-1)
-0.4 -0.2 0.0 0.2 0.4 0.6 0.8 1.0 1.2 1.4
-0.2 -0.1 0.0 0.1 0.2 0.3 0.4 0.5 0.6
E / V
due to the oxidation of nitrite at 0.87 V at varied scan rates were plotted against the square root of scan rates. Similarly, cathodic peak currents due to the reduction of peroxodisulfate at 0.18 V and different scan rates were plotted vs. the square root of scan rates (not shown). In
both the above cases electrocatalytic currents were found to be proportional to the square root of the scan rates. This confirms both processes, i.e., electrocatalytic oxidation of nitrite and reduction of peroxodisulfate are diffusion controlled.63 This behavior is suitable for the quantitative
estimation of analytes. Further, plot of scan rate normalized currents (Ia and Ic) against scan rate resulted in graphs
(Figures 7a and 7b) having typical shape of electrochemical (EC’) catalytic process for both reactions.64
To obtain the information about the number of electrons participating in the rate-determining step of reduction of peroxodisulfate, Tafel plots (Figure 8A) were drawn by obtaining data from the rising part of the cathodic peak of current-voltage curves (not shown) recorded in the presence of 4 and 5 mmol L-1
peroxodisulfate at 0.02 V s-1 scan rate. Similarly, Tafel
plots (Figure 8B) were drawn by using the data from the rising part of the anodic peak of CVs (not shown) recorded in the presence of 1.5 and 2 mmol L-1 nitrite at
0.02 V s-1 scan rate to get the information about the number
of electrons participating in the rate determining step of the oxidation of nitrite. In the presence of two different concentrations, i.e., 4 and 5 mmol L-1 peroxodisulfate,
the value of Tafel slope obtained was almost equal to 4.5 V decade-1. Similarly, in the presence of 1.5 and
2 mmol L-1 nitrite, the value of Tafel slope obtained
was nearly equal to 6.4 V decade-1. Assuming that one
-0.2 0.0 0.2 0.4 0.6 0.8 1.0 1.2 1.4
-120 -100 -80 -60 -40 -20 0 20 40 60 80 i / µ A
E / Vvs.Ag/AgCl (b)
(a)
Figure 5. Overlaid CVs of n-FeNP modified CPE in 0.5 mol L-1 KNO 3
solution of pH 4 in the absence (a) and in the presence (b) of 1 mmol L-1
peroxodisulfate at 0.05 V s-1 scan rate.
-0.5 0.0 0.5 1.0
-60 -40 -20 0 20 40
-0.5 0.0 0.5 1.0
-60 -40 -20 0 20 40
-0.5 0.0 0.5 1.0
-60 -40 -20 0 20 40 (c)
E / Vvs.Ag/AgCl
C u rr en t / µ A C u rr en t / µ A C u rr en t / µ A (b) (a)
Figure 6. Overlaid CVs of bare CPE (a) in 0.5 mol L-1 KNO
3 solution at
pH 4 and 0.05 mV s-1 scan rate; (b) in the same conditions as in (a) and
in the presence of 0.6 mmol L-1 nitrite; and (c) in the same conditions as
in (a) and in the presence of 1 mmol L-1 peroxodisulfate.
0.00 0.02 0.04 0.06 0.08 0.10
210 215 220 225 230 235 (a)
Scan rate / (V s-1) ia (s c a n ra te ) -1 /2 / ( µ A (V s -1 ) -1 /2 )
0.02 0.04 0.06 0.08 0.10
160 180 200 220 240 ic (s c a n ra te ) -1 /2 / ( µ A (V s -1 ) -1 /2 )
Scan rate / (V s-1) (b)
Figure 7. (a) Plot of scan rate normalized anodic current at 0.87 V vs. scan rate; (b) plot of scan rate normalized cathodic current at 0.15 V vs. scan rate.
-0.2 0.0 0.2 0.4 0.6 0.8 1.0 1.2 1.4
-120 -100 -80 -60 -40 -20 0 20 40 60 80 i / µ A
E / Vvs.Ag/AgCl (b)
electron (n= 1) is participating in the rate-limiting steps of both reactions, the value of transfer coefficient (α) will
be equal to 0.26 and 0.37 in the case of peroxodisulfate and nitrite, respectively. For most electrode processes α
ranges between 0.75 and 0.25. Hence, it is clear that one electron is participating in the rate-limiting steps of both the reactions and they are independent of concentration of analytes.62,65-67
From the conducted electrochemical studies, it can be inferred that the oxidation of nitrite and reduction of peroxodisulfate at n-FeNP modified CPE are the mediated reactions and one electron participates in rate limiting steps of both the reactions. Though no experiments have been conducted to confirm the resulting products, with the help of the reported literature34,58,68 the following mechanisms
have been proposed:
Calibration curve
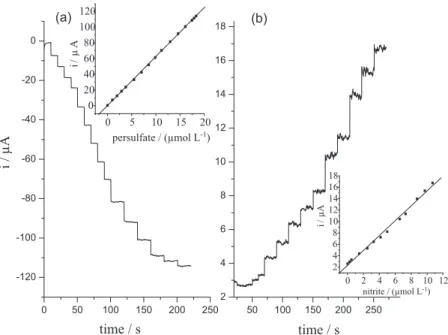
Varied concentrations (0.98, 1.92, 2.83, 3.70, 5.35, 6.89, 8.33, 9.67, 10.93, 12.68, 14.23, 15.75, 17.10, 17.53 and 17.94 µmol L-1) of peroxodisulfate resulted after
adding various volumes of 0.5 mmol L-1 peroxodisulfate
solution to electrochemical cell and the amperogram was recorded using the procedure described above by keeping the potential at 0.1 V vs. SCE (Figure 9a). Under
the optimized conditions, a concentration calibration of 0.98-17.94 µmol L-1 S
2O82– (r2 = 0.999) with limit of
detection (LOD) = 0.3 µmol L-1 (3σ) was obtained. By
keeping the potential at 1.15 V vs. SCE the amperogram
was recorded in the presence of varied concentrations (0.25, 0.49, 1.46, 2.5, 3.29, 4.15, 4.98, 6.56, 7.3, 8.72, 9.7 and 10.68 µmol L-1) of nitrite to obtain the linear
range of 0.25-10.68 µmol L-1 NO
3– (r2 = 0.996) with
LOD = 60 nmol L-1 (3σ) (Figure 9b).
Important features of the methods developed for the quantification of nitrite/peroxodisulfate based on the modified electrodes are listed in Table 1 along with the proposed method. It can be inferred from Table 1 that the analytical figures of merit of the proposed method are almost equivalent/superior when compared with the listed methods.
Interference study
Interference from the various cations (Ca2+, Mg2+, Na+,
NH4+) and anions (CO32–, PO42–, NO3–, Br–, Cl–, F–, SO32–)
generally present in water and soil matrices was checked using the amperometric technique for each analyte separately by following the procedures explained above. Any ion which caused error of ≥ 5% in determining the analyte was considered as interfered. SO32– interfered seriously even
at 2 ppm level in the determination of nitrite. This was overcome by adding 1 mL of 1% formaldehyde solution to sample matrix to form the stable CH2OHSO3– adduct.74
Application study
To check the applicability of the method, soil and ground water samples were chosen because the probability
K2FeII [FeII
(CN)5NO] → KFeII [FeIII
(CN)5NO] + K+ + e–
(E)
↑
↓
2 KFeII [FeIII
(CN)5NO] + NO2– + 2 K+
+ H2O → 2 K2FeII [FeII
(CN)5NO] + NO3– + 2H+
(C') slow
FeIII [FeIII
(CN)5NO] + K+ + e–
→ KFeII [FeIII
(CN)5NO] (E)
↑
↓
2 KFeII[FeIII(CN)5NO] + S2O82–→ 2 FeIII[FeIII(CN)5NO] + 2 K++ 2 SO42–(C') slow
0.03 0.04 0.05 0.06 0.07
-4.22 -4.20 -4.18 -4.16 -4.14 -4.12 -4.10 -4.08 -4.06 -4.04 -4.02 -4.00
E / Vvs.Ag/AgCl
(b)
(a) (A)
y = -3.89 + (-4.50)x
r2
= 0.987
y = -3.87 + (-4.42)x
r2 = 0.997 lo g Ic / µ A
0.74 0.76 0.78 0.80 0.82 0.84 0.86
-5.5 -5.4 -5.3 -5.2 -5.1 -5.0 -4.9 -4.8 -4.7 -4.6
E / Vvs.Ag/AgCl
lo g Ia / µ A (b) (a) (B)
y = -10.12 + 6.44x
r2
= 0.997
y = -10.24 + 6.48x
r2
= 0.996
Figure 8. Tafel plots derived from the rising part of the cyclic
voltammograms recorded for the n-FeNP modified CPE in the presence of (A) 4 and 5 mmol L-1 peroxodisulfate (curves (a) and (b), respectively)
and (B) 1.5 and 2.0 mmol L-1 nitrite (curves (a) and (b), respectively) at
a scan rate of 0.02 V s-1 in 0.5 mol L-1 KNO
3.
0.03 0.04 0.05 0.06 0.07
-4.22 -4.20 -4.18 -4.16 -4.14 -4.12 -4.10 -4.08 -4.06 -4.04 -4.02 -4.00
E / Vvs.Ag/AgCl
(b)
(a) (A)
y = -3.89 + (-4.50)x
r2
= 0.987
y = -3.87 + (-4.42)x
r2 = 0.997 lo g Ic / µ A
0.74 0.76 0.78 0.80 0.82 0.84 0.86
-5.5 -5.4 -5.3 -5.2 -5.1 -5.0 -4.9 -4.8 -4.7 -4.6
E / Vvs.Ag/AgCl
lo g Ia / µ A (b) (a) (B)
y = -10.12 + 6.44x
r2
= 0.997
y = -10.24 + 6.48x
r2
Table 2. Estimation of nitrite and peroxodisulfate in soil and ground water samples
Sample
Originally found
Added Finally found
Proposed method Proposed method Standard method
NO2– / ppm S2O82– /
(mmol L-1) NO2– / ppm
S2O82- /
(µmol L-1) NO2– / ppm
S2O82– /
(mmol L-1) NO2– / ppm
S2O82– /
(mmol L-1)
Soil 6.0 ± 0.26 – 5.0 2.5 10.8 ± 0.3 2.3 ± 0.74 11.0 ± 0.11 2.4 ± 0.34
Ground water 2.0 ± 0.31 – 4.0 7.0 5.6 ± 0.27 6.8 ± 0.51 5.9 ± 0.0 9 7.0 ± 0.23
Values are the average of three measurements.
Table 1. Comparison of important features of the methods developed for the quantification of nitrite/peroxodisulfate
Modifier Analyte Linear range Limit of detection Sample analyzed Reference
PdNP Nitrite 0.5-100 mmol L-1 – – 34
Prussian Blue Nitrite 0.0-1600 µmol L-1 3.36 µmol L-1 – 33
Graphene/poly-cyclodextrin/MWCNTs/GCE Nitrite 5-6750 µmol L-1 1.65 µmol L-1 – 69
Nafion/SLGnP-TPA-Mb/GCE Nitrite 0.5-2500 µmol L-1 0.1 µmol L-1 – 70
NR/NiOx NWs/CPE Peroxodisulfate 0.1 µmol L-1-12 mmol L-1 30 nmol L-1 River water 71
PbPCNF/CCE Peroxodisulfate 5-50 µmol L-1 1.58 µmol L-1 – 72
(FAD)/NiOx/ GC Peroxodisulfate 3 µmol L-1-1.5 mmol L-1 0.38 µmol L-1 – 73
n-FeNP Nitrite 0.25-10.68 µmol L-1 60 nmol L-1 Soil and water Proposed method
n-FeNP Peroxodisulfate 0.98-17.94 µmol L-1 0.3 µmol L-1 Soil and water Proposed method
PdNP: Palladium nitroprusside; MWCNT: multi-walled carbon nanotube; SLGnP: single-layer graphene nanoplatelet; TPA: tetrasodium 1,3,6,8-pyrenetetrasulfonic acid; NR/NiOx NWs/CPE: neutral red/nickel oxide nanowires modified carbon paste electrode; PbPCNF/CCE: lead pentacyanonitrosylferrate/carbon ceramic electrode; (FAD)/NiOx/GC: flavin adenine dinucleotide/nickel oxide/glassy carbon electrode.
Figure 9. Amperometric response of n-FeNP modified CPE for successive addition of various volumes of (a) 0.5 mmol L-1 peroxodisulfate solution and
(b) 0.05 mmol L-1 nitrite solution under the above described conditions. Insets show the respective calibration graph.
0 50 100 150 200 250
-120 -100 -80 -60 -40 -20 0
50 100 150 200 250
2 4 6 8 10 12 14 16 18
0 5 10 15 20
0 20 40 60 80 100 120
persulfate / (µmol L )-1
nitrite / (µmol L )-1
i/
µ
A
i
/
µ
A
0 2 4 6 8 10 12
2 4 6 8 10 12 14 16 18
i
/
µ
A
time / s
(b) (a)
time / s
of finding both analytes in these samples is higher. The sample solutions were carefully prepared by following the above-described procedures. Then, suitable quantity of the sample solution was taken and analyzed using the described amperometric procedure. Known quantity of the analyte was added to the treated samples and estimated
to examine its recovery. Nitrite and peroxodisulfate were also estimated from the Griess-Ilosvey and iodimetric methods, respectively,75 to validate the results obtained
Conclusions
Drop by drop method results in reduced size and less agglomerated FeNP particles, which were confirmed by SEM images. Both redox active centers of FeNP have been successfully utilized to develop an electrochemical sensor for the quantification of peroxodisulfate and nitrite. From the current voltage graphs it was clear that both reactions proceed through an EC’ mechanism and one
electron transfer takes place in rate-limiting steps. Both the analytes were estimated in soil and ground water samples using the proposed method. Obtained results were found in good agreement with the results obtained from standard analytical methods. Using the developed single electrochemical sensor, two analytes such as nitrite and peroxodisulfate in water and soil samples can be quantified.
Acknowledgements
Financial support by the Center for Nano and Material Sciences (CNMS), Jain University, is acknowledged by S. D. and R. T.
References
1. ERM-West, Inc.; In-Situ Persulfate Oxidation Interim Remedial Measure Work Plan; Arkema, Inc.: Portland, Oregon, 2005. 2. SIDS Initial assessment report, SIAM 20, UNEP Publications,
Paris, France, 2005. Available at http://www.chem.unep.ch/ irptc/sids/OECDSIDS/Persulfates.pdf, accessed in January 2015.
3. Botukhova, G. N.; Petriiz, O. A.; Russ. J. Electrochem.2013, 49, 1145.
4. Chen, S. M.; Hsueh, S. H.; J. Electroanal Chem.2004, 566, 291.
5. Chu, H. W.; Thangamuthu, R.; Chen, S. M.; Electrochim. Acta
2008, 53, 2862.
6. Guo, W.; Xu, L.; Li, F.; Xu, B.; Yang, Y.; Liu, S.; Sun, Z.; Electrochim. Acta 2010, 55,523.
7. de Oliveira, M. F.; Mortimer, R. J.; Stradiotto, N. R.; Microchem. J.2000, 64, 155.
8. de Oliveira, M. F.; Saczk, A. A.; Gomes Neto, J. A.; Roldan, P. S.; Stradiotto, N. R.; Sensors 2003,3, 371.
9. Lin, K. C.; Hang, J. Y.; Chen, S. M.; Int. J. Electrochem. Sci.
2012,7,9161.
10. Umasankar, Y.; Wang, S. H.; Chen, S. M.; Anal. Methods2011, 3,2604.
11. Yue, X. F.; Zhang, Z. Q.; Yan, H. T.; Talanta 2004, 62, 97. 12. Bruning-Fann, C. S.; Kaneene, J. B.; Vet. Hum.Toxicol 1993,
35, 52.
13. World Health Organization (WHO); Guidelines for Drinking Water Quality, 3rd ed.; WHO: Geneva, 2004.
14. Kim-Shapiro, D. B.; Gladwin, M. T.; Patel, R. P.; Neil, H.; J. Inorg. Biochem. 2005, 99, 237.
15. Lijinsky, W.; Epstein, S. S.; Nature 1970, 225,21. 16. Mirvish, S. S.; Cancer Lett.1995, 93,17.
17. Moorcroft, M. J.; Davis, J.; Compton, R. G.; Talanta 2001, 54, 785.
18. Huang, Z.; Korenaga, T.; Helaleh, M. I. H.; Mikrochim. Acta
2000, 134, 179.
19. Wada, M.; Kurose, M.; Nakamura, A.; Kuroda, N.; Tanigawa, M.; Nakashima, K.; Nippon Kasei Gakkaishi2000, 5, 11. 20. Abbas, M. N.; Mostafa, G. A.; Anal. Chim. Acta2000, 410,
185.
21. Miro, M.; Cladera, A.; Estela, J. M.; Cerda, V.; Analyst 2000, 125, 943.
22. Barzegar, M.; Mousavi, M. F.; Nemati, A.; Microchem. J. 2000, 65, 159.
23. Kage, S.; Kudo, K.; Ikeda, N.; J. Chromatogr. B: Biomed. Sci. Appl.2000, 742,363.
24. Davis, J.; Compton, R. G.; Anal. Chim. Acta 2000, 404,241. 25. Wu, M.; Wang, S.; Lihua Jianyan, Huaxue Fence 2000, 36,244. 26. Reshetilov, A. N.; Iliasov, P. V.; Knackmuss, H. J.; Boronin,
A. M.; Anal. Lett.2000, 33,29.
28. Moorcroft, M. J.; Nei, L.; Davis, J.; Compton, R. G.; Anal. Lett.
2000, 33,3127.
29. Santos, W. J. R.; Lima, P. R.; Tanaka, A. A.; Tanaka, S. M. C. N.; Kubota, L. T.; Food Chem.2009, 113, 1206.
30. Sousa, A. L.; Santos, W. J. R.; Luz, R. C. S.; Damos, F. S.; Kubota, L. T.; Tanaka, A. A.; Tanaka, S. M. C. N.; Talanta 2008,
75,333.
31. Raoof, J. B.; Ojani, R.; Ramine, M.; J. Solid State Electrochem.
2009, 13, 1311.
32. Ying, Z.; Liqiang, L.; Yaping, D.; Li, L.; Microchim. Acta2009,
167, 123.
33. Jyh-Myng, Z.; Annamalai Senthil, K.; Huey-Wen, C.; Electroanalysis 2001, 13,1171.
34. Pournaghi-Azar, M. H.; Dastangoo, H.; J. Electroanal. Chem.
2004, 567,211.
35. Karyakin, A. A.; Electroanalysis2001, 13,813.
36. Jain, A. K.; Singh, R. P.; Bala, C.; Anal. Lett.1982, 15, 1557. 37. Jain, A. K.; Singh, R. P.; Bala, C.; J. Chem. Technol. Biotechnol.
1984, 34A,363.
38. Cox, J. A.; Das, B. K.; Anal. Chem.1985, 57,2739.
39. Jayasri, D.; Narayanan, S. S.; Sens. Actuators, B2006, 119, 135.
40. Shankaran, D. R.; Narayanan, S. S.; Sens. Actuators, B1999, 55, 191.
41. Zen, J. M.; Chung, H. H.; Kumar, A. S.; Analyst2000, 125,1633. 42. Karyakin, A. A.; Karyakina, E. E.; Gorton, L.; Anal. Chem.
43. Razmi, H.; Heidari, K.; Electrochim. Acta 2005, 50, 4048. 44. Paim, L. L.; Stradiotto, N. R.;Electrochim. Acta2010, 55, 4144. 45. Pournaghi-Azar, M. H.; Nahalparvari, H.; J. Electroanal. Chem.
2005, 583, 307.
46. Razmi, H.; Agazadeh, M.; Habibi-A, B.; J. Electroanal. Chem.
2003, 547, 25.
47. Razmi, H.; Hossaini Sadr, M.; Habibi-A, B.; J. Electroanal. Chem.2005, 574, 207.
48. Pournaghi-Azar, M. H.; Razmi-Nerbin, H.; J. Electroanal. Chem.2000, 488,17.
49. Razmi, H.; Heidari, H.; Anal. Biochem. 2009, 388, 15. 50. Razmi, H.; Habibi, E.; Anal. Biochem.2009, 392,126. 51. Karyakin, A. A.; Electroanalysis 2001, 13,813.
52. do Carmo, D. R.; da Silva, R. M.; Stradiotto, N. R.; J. Braz. Chem. Soc.2003, 14, 616.
53. Devaramani, S.; Malingappa, P.; Electrochim. Acta2012, 85, 579.
54. Pandurangappa, M.; Venkataramanappa, Y.; Anal. Methods
2011, 3,1838.
55. Berrettoni, M.; Giorgetti, M.; Zamponi, S.; Conti, P.; Ranganathan, D.; Zanotto, A.; Saladino, M. L.; Caponetti, E.; J. Phys. Chem. C2010, 114, 6401.
56. do Carmo, D. R.; da Silva, R. M.; Stradiotto, N. R.; Portugaliae Electrochimica Acta2004, 2, 271.
57. Shankaran, D. R.; Narayanan, S. S.; Sens. Actuators, B1999, 86, 180.
58. de Oliveira, M. F.; Mortimer, R. J.; Stradiotto, N. R.; Microchem. J. 2000, 64, 155.
59. Prabakar, S. J. R.; Narayanan, S. S.; Talanta 2007, 72, 1818. 60. Pournaghi-Azar, M. H.; Sabzi, R.; J. Electroanal. Chem.2003,
543, 115.
61. Jayasri, D.; Narayanan, S. S.; Sens. Actuators, B2006, 119, 135.
62. Bard, A. J.; Faulkner, L. R.; Electrochemical Methods: Fundamentals and Applications, 2nd ed.; Wiley: New York,
2001.
63. Razmi, H.; Agazadeh, M.; Habibi-A, B.; J. Electroanal. Chem.
2003, 547, 25.
64. Periente, F.; Lorenzo, E.; Tobalina, F.; Abruna, H. D.; Anal. Chem.1995,67, 3936.
65. Pournaghi-Azar, M. H.; Sabzi, R. E.; Electroanalysis 2004, 16, 860.
66. Razmi, H.; Habibi, E.; Anal. Biochem.2009, 392, 126. 67. Razmi, H.; Heidari, H.; Anal. Biochem.2009, 388, 15. 68. Razmi, H.; Heidari, H.; Electroanalysis2008,21,2370. 69. Zhang, Y.; Yuan, R.; Chai, Y. Q.; Li, W. J.; Zhong, X.; Zhong,
H. A.; Biosens. Bioelectron. 2011, 26,3977.
70. Yue, R.; Lu, Q.; Zhou, Y. K.; Biosens. Bioelectron. 2011,26, 4436.
71. Savaria, Z.; Soltaniana, S.; Noorbakhshb, A.; Salimic, A.; Najafia, M.; Servatid, P.; Sens. Actuators, B 2013, 176, 335. 72. Razmi, H.; Heidari, H.; Electroanalysis2008,21, 2370. 73. Abollah, S.; Abdollah, N.; Abolfazl, S.; J. Solid State
Electrochem.2011,15, 2041.
74. Williams, W. J.; Handbook of Anion Determination; Butterworths: London, 1979.
75. Greenberg, A. E.; Clesceri, L. S.; Standard Methods for the Examination of Water and Waste Water, 22nd ed.; American
Health Association: Washington, DC, 2012.