Article
Printed in Brazil - ©2014 Sociedade Brasileira de Química0103 - 5053 $6.00+0.00A
*e-mail: [email protected]
Antioxidant Capacity in Tilapia Fillets Enriched with Extract of
Acerola Fruit Residue
Fabiana Carbonera,*,a Paula F. Montanher,a Sylvio V. Palombini,a
Swami A. Maruyama,a Thiago Claus,a Hevelyse M. C. Santos,b Sheisa C. Sargi,b
Makoto Matsushitaa and Jesuí V. Visentainera
aDepartment of Chemistry and bGraduate Program of Food Science, State University of Maringa,
Av. Colombo, 5790, 87020-900 Maringa-PR, Brazil
Este trabalho avaliou o efeito da suplementação com extrato etanólico de resíduo de acerola (EEAR) na capacidade antioxidante de filés de tilápias no intervalo de 60 dias. Diferentes metodologias foram utilizadas seguindo procedimento QUENCHER e foram analisadas as frações hidrofílicas e lipofílicas do ensaio de capacidade de absorção de oxigênio radical (ORACFL). A composição em ácidos graxos também foi avaliada, sendo observadas elevadas concentrações dos ácidos linoleico e oleico nos filés, assim como, razões ácidos graxos poli-insaturados/ácidos graxos saturados (PUFA/SFA) satisfatórias. Os maiores valores de capacidade antioxidante nos ensaios 2,2-difenil-1-picrilhidrazil (DPPH) e capacidade redutora de ferro (FRAP) (1778,87 e 4892,77 µmol capacidade antioxidante equivalente ao Trolox (TEAC) g−1, respectivamente) foram encontrados em 15 dias e esses ensaios apresentaram o maior valor de correlação (R = 0,9388). O ensaio ORACFL indicou que a fração hidrofílica é a maior contribuinte na capacidade antioxidante total (TAC). Dessa forma, o significativo aumento observado na capacidade antioxidante torna a suplementação com EEAR uma potente ferramenta na elevação da capacidade antioxidante dos filés.
This work evaluated the effect of supplementation with ethanolic extract of acerola fruit residue (EEAR) on the antioxidant capacity of tilapia fillets over a period of 60 days. Different methodologies were used following the QUENCHER procedure, and the hydrophilic and lipophilic fractions of the oxygen radical absorbance capacity (ORACFL) assay were analysed. The fatty acid composition was also evaluated, as high concentrations of linoleic and oleic acids were observed in the fillets, as well as satisfactory polyunsaturated fatty acids/saturated fatty acids (PUFA/SFA) ratios. The highest antioxidant capacities in 2,2-diphenyl-1-picrylhydrazyl (DPPH) and ferric reducing antioxidant power (FRAP) assays (1778.87 and 4892.77 µmol Trolox equivalent antioxidant capacity (TEAC) g−1, respectively) were found at 15 days, and these trials showed the highest correlation coefficient (R = 0.9388). The ORACFL assay indicated that the hydrophilic fraction is the largest contributor to the total antioxidant capacity (TAC). Thus, the significant increase observed in antioxidant capacity makes supplementation with EEAR a potent tool in the elevation of the antioxidant capacity of tilapia fillets.
Keywords: tilapia, fatty acids, antioxidant capacity, QUENCHER procedure, ORACFL assay
Introduction
The Nile tilapia (Oreochromis niloticus), originally from Africa, is the most common freshwater fish grown in aquaculture systems in Brazil,1 accounting for
approximately 40% of the total national production in this modality.2 At the global level, tilapia is ranked fourth in
aquaculture production, and more than 3 million tons of this species were produced in 2010.3
Freshwater fish such as tilapia show low concentrations in α-linolenic acid (LNA, 18:3n-3), eicosapentaenoic acid (EPA, 20:5n-3), docosahexaenoic acid (DHA, 22:6n-3) and other polyunsaturated omega-3 fatty acids (PUFA n-3).4,5 The intake of these PUFA (n-3) is related to
Studies conducted in recent years indicate that compounds that show antioxidant capacity play an important role in the body’s defence system, reducing the incidence of cardiovascular disease, cancers and degenerative processes related to reactive oxygen species.7
These substances have also been used to supplement the diets of animals in order to obtain better quality products for human consumption.8
Among the main sources of compounds with antioxidant capacity are fruits, with particular emphasis on acerola (Malpighia emarginata DC.), which shows high concentrations of polyphenols, carotenoids and vitamin C.9-11 Besides consumption in its fresh form, acerola
is also used industrially in the production of concentrate juices, jams, pulps and extracts, generating residues (peels and seeds), which when discarded improperly may cause environmental problems.12,13 However, according to
Oliveira et al.,12 such residues also show compounds with
antioxidant capacity, which allows a better usage of it in food products for humans and animals.
In the present study, the QUENCHER procedure was used to measure antioxidant capacity. This procedure avoids the solvent extraction and hydrolysis steps. Considering that both soluble and insoluble parts of foods simultaneously are exposed to radical compounds, the measure of the total antioxidant capacity of a given food becomes more accurate. Furthermore, these results are more realistic regarding the antioxidant activity of food in the human gastrointestinal tract, since the simultaneous actions of all of the antioxidants present in the samples are taken into account.7
The oxygen radical absorbance capacity (ORACFL)
method using fluorescein (FL) as the fluorescent probe is also becoming widely used for assessing antioxidant capacity in food.14,15 The ORAC
FL method is based on
the inhibition of the peroxyl-radical-induced oxidation initiated by thermal decomposition of the azo-compound 2,2’-azobis(2-amidino-propane) dihydrochloride (AAPH). Thus, the ORACFL assay utilizes a biologically relevant
radical source and is the only method that combines both inhibition time and degree of inhibition for an antioxidant into a single value, reproducing the mechanism of action and prevention of free radicals in human body.14,16,17
Furthermore, a slight modification in the ORACFL assay
introduced by Huang et al.,18 applying randomly methylated
β-cyclodextrin (RMCD) as a molecular host to enhance the solubility of lipophilic compounds in aqueous solution, allowed the measurement of the antioxidant capacity of both lipophilic and hydrophilic components in a given sample separately using the same peroxyl-free radical source, the AAPH.15
Given the important role that antioxidants play in the human body along with the scarcity of studies employing total antioxidant capacity determination in meat products, this work aimed to evaluate the effect of supplementation with extract of acerola fruit residue in the antioxidant capacity of tilapia fillets for a period of 60 days, taking into account the different mechanisms and reaction conditions of the distinct employed assays in the results interpretation, and also assess the fatty acid composition.
Experimental
Experimental diets
Two pelleted diets, a control diet and a diet supplemented with ethanolic extract of acerola fruit residue (EEAR), were formulated according to the nutritional requirements of tilapia.19 The feed ingredients were milled, sieved, and
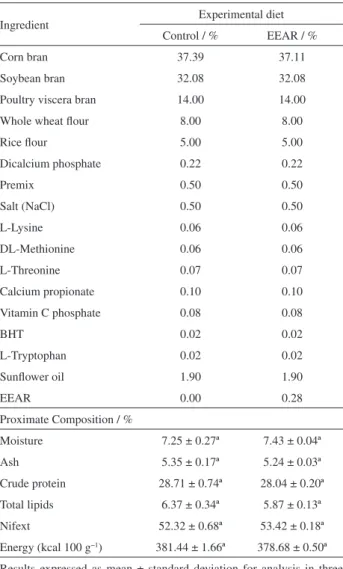
then mixed with water to obtain the pellets, and these were dried in an oven with air circulation at 55 °C for 10 h. The pellets were vacuum packed, protected from light and kept at −18 °C until use in fish feeding. Formulation and proximate composition of the experimental diets are presented in Table 1.
Preparation of the ethanolic extract of acerola fruit residue (EEAR)
The residue was produced using fresh acerola fruits obtained commercially from Maringa, Parana State, Brazil. In this procedure, portions containing 350 g of acerola fruits were ground and posteriorly passed through a 50 mesh (297 µm) sieve. The residue retained on the sieve was subsequently washed with 200 mL of water to obtain the acerola fruit residue. The extraction of antioxidants was carried out at a ratio of 1:10 (w/v)20 between acerola residue
and ethanol under magnetic stirring for 2 h. After filtration, the extract was concentrated under reduced pressure at 40 °C and subsequently lyophilized in a laboratory freeze dryer (CHRIST, ALPHA 1-2 LD plus), at −52 °C and 0.060 mbar during 24 h.
Feeding trial and fish sampling
the new conditions. After this period, a sample (6 fish of each tank) was removed, and the zero-time (0 days of supplementation) analyses were performed. After that, the experiment was initiated by providing a diet supplemented with EEAR. At periods of 15, 30, 45 and 60 days, new samplings were performed by collecting 6 fish tank−1. Fish
were sacrificed, disembowelled, washed, filleted, packed in polyethylene bags in nitrogen (N2) atmosphere and stored
at −18 °C for later analysis.
Chemical analysis
The moisture, ash and crude protein contents of the diets were determined according to AOAC Official Methods 930.15, 942.05 and 960.52, respectively.21 Total lipid
contents of both diets and tilapia fillets were extracted according to Bligh and Dyer.22 The Nifext fractions were
estimated by the difference, and the energy values of the diets were calculated based on conversion factors according to Brazil.23
Fatty acid composition
The fatty acid methyl esters (FAME) of the diets and tilapia fillets were prepared by total lipid methylation as described by Hartman and Lago.24 The methyl esters were
separated by gas chromatography in a Thermo 3300 gas chromatograph, fitted with a flame ionization detector (FID) and a fused-silica capillary column (100 m × 0.25 mm i.d., 0.25 µm cyanopropyl CP-7420 select FAME). The ultra-pure gas flows were 1.2 mL min−1 carrier gas (hydrogen),
30 mL min−1 make-up gas (nitrogen), 350 mL min−1 synthetic
air and 35 mL min−1 hydrogen flame gas. The injected
sample volume was 2.0 µL with split injection ratio 1:80. The injector and detector temperatures were 200 and 240 °C, respectively. The column temperature was maintained at 165 °C for 7 min, followed by a heating rate of 4 °C min−1
until 185 °C, which was maintained for 4.67 min. After that, a new heating rate of 6 °C min−1 was applied until 235 ºC,
which was maintained for 5 min, totalling 30 min of analysis. Retention times and peak areas were determined using the software Chromquest 5.0.
For the identification of fatty acids, the retention times were compared to those of standard methyl esters (Sigma, USA). Quantification of fatty acids was performed using tricosanoic acid methyl ester (Sigma, USA) as an internal standard (IS). Theoretical FID correction factor values were used in the calculations to obtain concentration values.25
Fatty acid contents were calculated in mg g−1 of total lipids
(mg g−1 of TL) by using equation 1.
(1)
where FA is mg of fatty acids per g of total lipids, Ax is the
peak area (fatty acids), AIS is the peak area of IS methyl
ester of tricosanoic acid (23:0), WIS is the IS weight (mg)
added to the sample, Wx is the sample weight (g), CFx is
the theoretical correction factor and CFAE is the conversion
factor necessary to express results as mg of fatty acids rather than as methyl esters.
Antioxidant capacity
The samples were previously lyophilized employing the same conditions used in the preparation of the EEAR
Table 1. Feed ingredients and proximate composition of the experimental diets
Ingredient Experimental diet
Control / % EEAR / %
Corn bran 37.39 37.11
Soybean bran 32.08 32.08
Poultry viscera bran 14.00 14.00
Whole wheat flour 8.00 8.00
Rice flour 5.00 5.00
Dicalcium phosphate 0.22 0.22
Premix 0.50 0.50
Salt (NaCl) 0.50 0.50
L-Lysine 0.06 0.06
DL-Methionine 0.06 0.06
L-Threonine 0.07 0.07
Calcium propionate 0.10 0.10
Vitamin C phosphate 0.08 0.08
BHT 0.02 0.02
L-Tryptophan 0.02 0.02
Sunflower oil 1.90 1.90
EEAR 0.00 0.28
Proximate Composition / %
Moisture 7.25 ± 0.27ª 7.43 ± 0.04ª
Ash 5.35 ± 0.17ª 5.24 ± 0.03ª
Crude protein 28.71 ± 0.74ª 28.04 ± 0.20ª
Total lipids 6.37 ± 0.34ª 5.87 ± 0.13ª
Nifext 52.32 ± 0.68ª 53.42 ± 0.18ª
Energy (kcal 100 g−1) 381.44 ± 1.66ª 378.68 ± 0.50ª
and passed through an 80 mesh (177 µm) sieve before the QUENCHER procedure and the preparation of hydrophilic and lipophilic extracts of ORACFL assay.
2,2-diphenyl-1-picrylhydrazyl (DPPH), ferric reducing antioxidant power (FRAP) and 2,2’-azino-bis(3-ethylbenzothiazoline-6-sulfonic acid (ABTS) assays were applied to the diets and fillets following the QUENCHER procedure. The work solutions were prepared according to Serpen, Gökmen and Fogliano.26 The stock solution
of DPPH was obtained by dissolving 40 mg of DPPH in 200 mL of ethanol/water mixture (50:50, v/v). The absorbance value of 0.75-0.80 at 525 nm was set by diluting the stock solution in approximately 800 mL of ethanol/ water (50:50, v/v) mixture.
The FRAP solution was prepared by diluting an aqueous solution of 10 mmol L−1 2,4,6-tris(2-pyridyl)-s-triazine
(TPTZ) and 20 mmol L−1 ferric chloride in 300 mmol L−1
sodium acetate buffer (pH 3.6) at a ratio of 1:1:10 (v/v/v), as described by Benzie and Strain.27
For the ABTS assay, the work solution of ABTS was prepared according to Re et al.28 by reacting the ABTS
stock solution (7 mmol L−1) with potassium persulfate
(2.45 mmol L−1). The final solution was allowed to stand
protected from light at room temperature for 12-16 h before use. The absorbance value of 0.75-0.80 at 734 nm was set diluting 10 mL of the work solution in approximately 800 mL of ethanol/water (50:50, v/v) mixture.26
For the application of DPPH, FRAP and ABTS assays following the QUENCHER procedure, 10 mg of each sample was weighed into centrifuge tubes protected from light, and 10 mL of the respective working solutions were added to start the reactions. With the exception of fillet samples in which, to employ the FRAP assay, a dilution was necessary, 5 mg of sample and 25 mL of the reagent solution were used. All tubes were shaken for 60 min and posteriorly centrifuged at 9200 g for 5 min. The absorbance of the supernatants were measured in a spectrophotometer UV-visible (Thermo SCIENTIFIC, GENESYS 10uv Scanning) at 525 nm (for DPPH assay), 593 nm (for FRAP assay) or 734 nm (for ABTS assay).26
6-hydroxy-2,5,7,8-tetramethylchromane-2-carboxylic acid (Trolox) was used as a standard reference to convert the inhibition capability of each sample to the Trolox equivalent antioxidant capacity (TEAC), as described by Serpen, Gökmen and Fogliano.26
The procedures for preparing the hydrophilic (H-ORACFL) and lipophilic (L-ORACFL) extracts for
ORACFL analysis were performed according to Prior et al..14
In these procedures, 0.5 g of each dried sample was weighed into centrifuge tubes, and the lipophilic content was firstly extracted with 10 mL of hexane. After adding solvent,
the tubes were vortexed for 30 s, followed by sonication at 37 °C for 5 min. The tubes were inverted twice in the middle of the sonication step to suspend the samples. Then, the tubes remained at room temperature for 10 min with occasional shaking. Posteriorly, all samples were centrifuged at 4000 rpm for 10 min and the supernatants were collected in flat-bottomed flasks. The residue from each sample was subjected to the same procedure described above. The supernatants resulting from the two sequential extractions were combined and concentrated under reduced pressure at 30 °C, and the dried hexane extract was dissolved in 1.5 mL of acetone and 4.5 mL of 7% RMCD solution (50% acetone:50% water, v/v).
The hydrophilic extractions were carried out with the residues from the lipophilic extractions by the addition of 10 mL of acetone:water:acetic acid (70:29.5:0.5, v/v/v) and applying the same procedure employed in the lipophilic extractions. The samples were centrifuged at 4000 rpm for 15 min, and the supernatants were collected into volumetric flasks. The extraction was repeated, and the supernatants were combined and diluted to 25 mL total volume.
The H-ORACFL and L-ORACFL assays were performed
at 37 °C in a Perkin Elmer fluorescent microplate reader (VICTOR™ X4 Multilabel Plate Reader) using a 96-well black microplate in which excitation/emission was measured from the top of the plate.
For the L-ORACFL assay, the extracts were diluted
with 7% RMCD solution in acetone/water (50:50, v/v) to an appropriate concentration to be within the range of the standard curve. The 7% RMCD solution was used as a blank and to dissolve the Trolox standards for the lipophilic assay. For the hydrophilic extracts, sample solutions were diluted with acetone/water/acetic acid (70:29.5:0.5, v/v/v) to the proper concentration range for the standard curve. Trolox standards were prepared with acetone/water/acetic acid (70:29.5:0.5, v/v/v) as well as the blank for H-ORACFL assay.
A 20 µL portion of the diluted samples was added to each well to the microplate followed by 200 µL of 0.004 µmol L−1 fluorescein sodium salt solution prepared
as described by Prior et al..14 The microplate was inserted
into the fluorescent microplate reader for 5 min to stabilize the temperature. Then, 75 µL of 2,2’-azobis(2-amidino-propane) dihydrochloride (AAPH) solution, diluted in 0.075 mol L−1 phosphate buffer (pH 7.0) with
a concentration of 17.2 mg mL−1 for the L-ORAC FL assay
and 8.6 mg mL−1 for the H-ORAC
FL assay, was added to
each well. Readings were initiated immediately at 1 min intervals for 30 min. The wavelengths of excitation and emission were 485 and 515 nm, respectively.
The final H-ORACFL e L-ORACFL values were
Trolox concentration (µmol L−1) and the net area under
the fluorescein decay curve according to Prior et al..14
The area under the curve (AUC) was calculated using the following equation:
AUC = (1 + f1/f0+ f2/f0+…+ fn+1/f0) (2)
where f0 is the initial fluorescence intensity and fn is the fluorescence intensity at n time.
The net AUC value is obtained by subtracting the area under the fluorescence decay curve (AUC) of the blank from that of a sample or standard.16
Total antioxidant capacity (TAC) was calculated by summing the H-ORACFL and L-ORACFL values.
All results obtained in the antioxidant capacity analysis were expressed as µmol TEAC g−1.
Statistical analysis
The results were submitted to variance analysis
(ANOVA), and means were compared by t-test
using Microsoft Office Excel software, version 2013 (MICROSOFT, 2013) and by Tukey’s test using the program Statistica, version 7.0 (STATSOFT, 1996). The significance level used for rejection of the null hypothesis was 5% (p < 0.05). The Pearson correlation coefficients (R) were calculated using Microsoft Office Excel software, version 2013 (MICROSOFT, 2013).
Results and Discussion
Table 1 shows the feed ingredients and the proximate composition of the experimental diets. No significant difference (p > 0.05) was observed between the proximate composition of the diets, thus ensuring the desired trait of being isonitrogenous and isocaloric diets.19
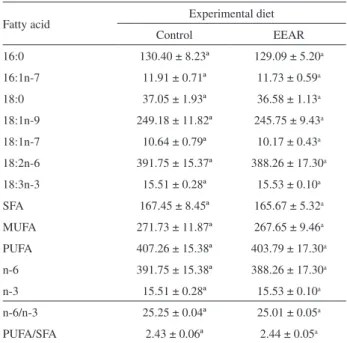
In relation to fatty acid composition (Table 2), palmitic acid (16:0) was the saturated fatty acid (SFA) found in the highest concentration in the experimental diets, and the largest component in the sum of monounsaturated fatty acids (MUFA) was oleic acid (18:1n-9). For the class of polyunsaturated fatty acids (PUFA), high values of linoleic acid (18:2n-6) were observed in the diets while the strictly essential fatty acid α-linolenic (18:3n-3) was found at low concentrations. No significant difference (p > 0.05) could be observed between the concentrations of the different fatty acids in the diets, possibly due to the fact that the lipid source used in both formulations was the sunflower oil. Justi et al.5 found the same superiority of palmitic, oleic,
linoleic and α-linolenic fatty acids in treatments of Nile tilapia supplemented with linseed oil.
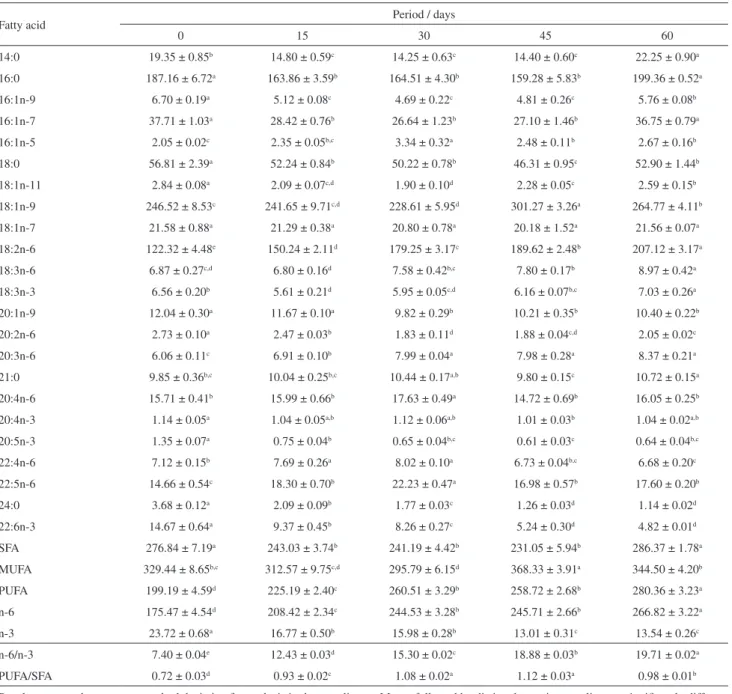
The fatty acid compositions of the tilapia fillets on 0, 15, 30, 45 and 60 days of EEAR supplementation are shown in Table 3.
A total of 23 fatty acids were found in tilapia fillets at the different periods of supplementation. In addition to the lipid profile of the experimental diets (Table 2), palmitic acid was the saturated fatty acid found in the highest concentration in tilapia fillets, and oleic acid was the largest monounsaturated fatty acid component.
In relation to the polyunsaturated fatty acids, linoleic acid was the main component and the maximum value of this strictly essential fatty acid was found after 60 days of supplementation (207.12 mg g−1 of TL). On
the other hand, α-linolenic acid was observed in lower concentrations, resulting in n-6/n-3 ratios slightly above the recommended.29 However, the values of PUFA/SFA ratios
around 1.0 found in fillets after EEAR supplementation are in accordance with the recommendations of Simopoulos,30
who asserted that values under 0.4 are not suitable for health in relation to the prevention of heart diseases.
Concerning the levels of arachidonic acid (20:4n-6), eicosapentaenoic acid (20:5n-3) and docosahexaenoic acid (22:6n-3), which are important long-chain polyunsaturated
Table 2.Fatty acid quantification (mg g−1 of total lipids), n-6/n-3 and
PUFA/SFA ratios of the experimental diets
Fatty acid Experimental diet
Control EEAR
16:0 130.40 ± 8.23ª 129.09 ± 5.20a
16:1n-7 11.91 ± 0.71ª 11.73 ± 0.59a
18:0 37.05 ± 1.93ª 36.58 ± 1.13a
18:1n-9 249.18 ± 11.82ª 245.75 ± 9.43a
18:1n-7 10.64 ± 0.79ª 10.17 ± 0.43a
18:2n-6 391.75 ± 15.37ª 388.26 ± 17.30a
18:3n-3 15.51 ± 0.28ª 15.53 ± 0.10a
SFA 167.45 ± 8.45ª 165.67 ± 5.32a
MUFA 271.73 ± 11.87ª 267.65 ± 9.46a
PUFA 407.26 ± 15.38ª 403.79 ± 17.30a
n-6 391.75 ± 15.38ª 388.26 ± 17.30a
n-3 15.51 ± 0.28ª 15.53 ± 0.10a
n-6/n-3 25.25 ± 0.04ª 25.01 ± 0.05a
PUFA/SFA 2.43 ± 0.06ª 2.44 ± 0.05a
fatty acids, an increase in the content of arachidonic acid was observed due to the high levels of the linoleic acid, which is a precursor of the n-6 fatty acids series, while a decrease was found in the levels of eicosapentaenoic and docosahexaenoic acids, because of the low concentrations of α-linolenic acid, which is a precursor of the n-3 fatty acids series. Moreover, during the process of elongation and desaturation, the two groups of fatty acids share the same long-chain converting enzymes. Thus, a competition exists between n-3 and n-6 fatty acids, with an excess of
one group causing a significant decrease in the conversion yield of the other.6
Table 4 shows the antioxidant capacity results of the experimental diets.
In all of different assays, the supplemented diet with EEAR showed greater antioxidant capacity compared to the control diet. Furthermore, the application of the ORACFL
assay indicated that hydrophilic antioxidants are the major contributors in total antioxidant capacity of the diets, being responsible for more than 90% of the total value. Similar
Table 3. Fatty acid quantification (mg g−1 of total lipids), n-6/n-3 and PUFA/SFA ratios of tilapia fillets in different periods of supplementation
Fatty acid Period / days
0 15 30 45 60
14:0 19.35 ± 0.85b 14.80 ± 0.59c 14.25 ± 0.63c 14.40 ± 0.60c 22.25 ± 0.90a
16:0 187.16 ± 6.72a 163.86 ± 3.59b 164.51 ± 4.30b 159.28 ± 5.83b 199.36 ± 0.52a
16:1n-9 6.70 ± 0.19a 5.12 ± 0.08c 4.69 ± 0.22c 4.81 ± 0.26c 5.76 ± 0.08b
16:1n-7 37.71 ± 1.03a 28.42 ± 0.76b 26.64 ± 1.23b 27.10 ± 1.46b 36.75 ± 0.79a
16:1n-5 2.05 ± 0.02c 2.35 ± 0.05b,c 3.34 ± 0.32a 2.48 ± 0.11b 2.67 ± 0.16b
18:0 56.81 ± 2.39a 52.24 ± 0.84b 50.22 ± 0.78b 46.31 ± 0.95c 52.90 ± 1.44b
18:1n-11 2.84 ± 0.08a 2.09 ± 0.07c,d 1.90 ± 0.10d 2.28 ± 0.05c 2.59 ± 0.15b
18:1n-9 246.52 ± 8.53c 241.65 ± 9.71c,d 228.61 ± 5.95d 301.27 ± 3.26a 264.77 ± 4.11b
18:1n-7 21.58 ± 0.88a 21.29 ± 0.38a 20.80 ± 0.78a 20.18 ± 1.52a 21.56 ± 0.07a
18:2n-6 122.32 ± 4.48e 150.24 ± 2.11d 179.25 ± 3.17c 189.62 ± 2.48b 207.12 ± 3.17a
18:3n-6 6.87 ± 0.27c,d 6.80 ± 0.16d 7.58 ± 0.42b,c 7.80 ± 0.17b 8.97 ± 0.42a
18:3n-3 6.56 ± 0.20b 5.61 ± 0.21d 5.95 ± 0.05c,d 6.16 ± 0.07b,c 7.03 ± 0.26a
20:1n-9 12.04 ± 0.30a 11.67 ± 0.10a 9.82 ± 0.29b 10.21 ± 0.35b 10.40 ± 0.22b
20:2n-6 2.73 ± 0.10a 2.47 ± 0.03b 1.83 ± 0.11d 1.88 ± 0.04c,d 2.05 ± 0.02c
20:3n-6 6.06 ± 0.11c 6.91 ± 0.10b 7.99 ± 0.04a 7.98 ± 0.28a 8.37 ± 0.21a
21:0 9.85 ± 0.36b,c 10.04 ± 0.25b,c 10.44 ± 0.17a,b 9.80 ± 0.15c 10.72 ± 0.15a
20:4n-6 15.71 ± 0.41b 15.99 ± 0.66b 17.63 ± 0.49a 14.72 ± 0.69b 16.05 ± 0.25b
20:4n-3 1.14 ± 0.05a 1.04 ± 0.05a,b 1.12 ± 0.06a,b 1.01 ± 0.03b 1.04 ± 0.02a,b
20:5n-3 1.35 ± 0.07a 0.75 ± 0.04b 0.65 ± 0.04b,c 0.61 ± 0.03c 0.64 ± 0.04b,c
22:4n-6 7.12 ± 0.15b 7.69 ± 0.26a 8.02 ± 0.10a 6.73 ± 0.04b,c 6.68 ± 0.20c
22:5n-6 14.66 ± 0.54c 18.30 ± 0.70b 22.23 ± 0.47a 16.98 ± 0.57b 17.60 ± 0.20b
24:0 3.68 ± 0.12a 2.09 ± 0.09b 1.77 ± 0.03c 1.26 ± 0.03d 1.14 ± 0.02d
22:6n-3 14.67 ± 0.64a 9.37 ± 0.45b 8.26 ± 0.27c 5.24 ± 0.30d 4.82 ± 0.01d
SFA 276.84 ± 7.19a 243.03 ± 3.74b 241.19 ± 4.42b 231.05 ± 5.94b 286.37 ± 1.78a
MUFA 329.44 ± 8.65b,c 312.57 ± 9.75c,d 295.79 ± 6.15d 368.33 ± 3.91a 344.50 ± 4.20b
PUFA 199.19 ± 4.59d 225.19 ± 2.40c 260.51 ± 3.29b 258.72 ± 2.68b 280.36 ± 3.23a
n-6 175.47 ± 4.54d 208.42 ± 2.34c 244.53 ± 3.28b 245.71 ± 2.66b 266.82 ± 3.22a
n-3 23.72 ± 0.68a 16.77 ± 0.50b 15.98 ± 0.28b 13.01 ± 0.31c 13.54 ± 0.26c
n-6/n-3 7.40 ± 0.04e 12.43 ± 0.03d 15.30 ± 0.02c 18.88 ± 0.03b 19.71 ± 0.02a
PUFA/SFA 0.72 ± 0.03d 0.93 ± 0.02c 1.08 ± 0.02a 1.12 ± 0.03a 0.98 ± 0.01b
results were observed in different food matrices, such as fruits and vegetables, in studies conducted by Wu et al..15
The upper result found in the H-ORACFL assay for the
supplemented diet may have occurred because acerola fruit is recognized by phenolic compounds present in its composition, such as p-coumaric, ferulic, caffeic and chlorogenic acids, which have hydrophilic character.10
Moreover, studies conducted by Oliveira et al.12 suggest
the existence of high content of antioxidant phenolics in methanolic extracts of acerola fruit residue.
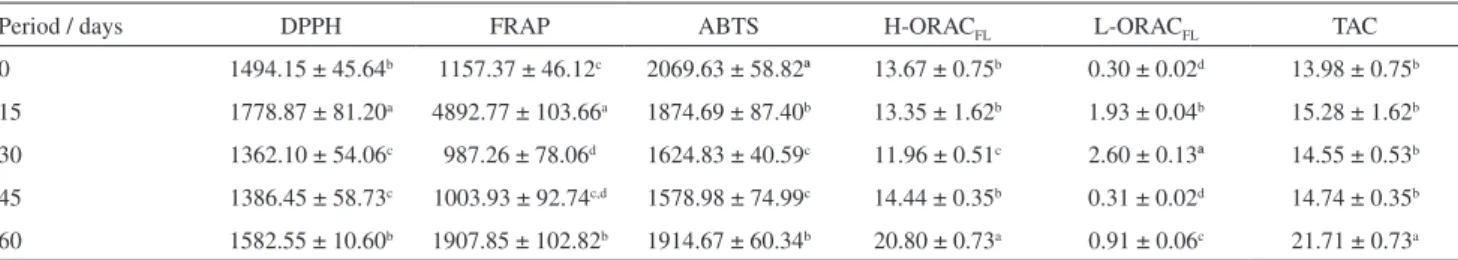
The antioxidant capacity of tilapia fillets in different periods of supplementation determined by DPPH, FRAP, ABTS and ORACFL assays are presented in Table 5.
In DPPH and FRAP assays, the highest values of antioxidant capacity (1778.87 and 4892.77 µmol TEAC g−1,
respectively) were found at a period of 15 days of supplementation with EEAR. However, the same was not observed in the application of ABTS and ORACFL assays.
For ABTS assay, a slightly higher antioxidant capacity value was found in fillets from the zero-time point (0 days of supplementation). The ORACFL assay revealed that the
hydrophilic fraction is the largest contributor to the TAC of the fillets, and the highest value was observed after 60 days of supplementation (20.80 µmol TEAC g−1).
The differences between the results obtained in the antioxidant capacity assays of tilapia fillets can be explained based on the Pearson correlation coefficients (R) (Table 6), taking into account the different mechanisms and reaction conditions, in addition to the different procedures applied.
DPPH and FRAP assays showed a similar tendency in their results, which can be confirmed by the correlation
value between them (R = 0.9388), which is better than the correlation values observed between DPPH × ABTS and FRAP × ABTS (R = 0.5495 and R = 0.2739, respectively). The good correlation between DPPH and FRAP assays suggests that the antioxidants in the sample react similarly with both methods.
Despite sharing the same reaction mechanism based on the electron transfer31 and to present the best antioxidant
capacity results using the same solvent to solubilize the radicals, a mixture of ethanol and water (50:50, v/v), DPPH and ABTS assays did not show good correlation (R = 0.5495). Although there are many similarities between these assays, the low value of correlation found can be explained based on the difference of action and the solubilisation of the radicals employed.
DPPH radicals, for example, are more suitable for application in hydrophobic systems, since it is better solubilized in solvents with low polarity, while ABTS radicals are applicable in both hydrophilic and lipophilic
Table 5. Results of antioxidant capacity by different assays (µmol TEAC g−1) of tilapia fillets in different periods of supplementation
Period / days DPPH FRAP ABTS H-ORACFL L-ORACFL TAC
0 1494.15 ± 45.64b 1157.37 ± 46.12c 2069.63 ± 58.82ª 13.67 ± 0.75b 0.30 ± 0.02d 13.98 ± 0.75b
15 1778.87 ± 81.20a 4892.77 ± 103.66a 1874.69 ± 87.40b 13.35 ± 1.62b 1.93 ± 0.04b 15.28 ± 1.62b
30 1362.10 ± 54.06c 987.26 ± 78.06d 1624.83 ± 40.59c 11.96 ± 0.51c 2.60 ± 0.13ª 14.55 ± 0.53b
45 1386.45 ± 58.73c 1003.93 ± 92.74c,d 1578.98 ± 74.99c 14.44 ± 0.35b 0.31 ± 0.02d 14.74 ± 0.35b
60 1582.55 ± 10.60b 1907.85 ± 102.82b 1914.67 ± 60.34b 20.80 ± 0.73a 0.91 ± 0.06c 21.71 ± 0.73a
Results expressed as mean ± standard deviation for analysis in four replicates. Means followed by distinct letters in the same column were found to be significantly different by Tukey’s test (p < 0.05). Abbreviation: TAC: total antioxidant capacity = (H-ORACFL + L-ORACFL).
Table 4. Results of antioxidant capacity by different assays (µmol TEAC g−1) of the experimental diets
Diet DPPH FRAP ABTS H-ORACFL L-ORACFL TAC
Control 1023.95 ± 57.95b 1556.54 ± 23.86b 1738.61 ± 100.17b 36.83 ± 0.99b 1.28 ± 0.09b 38.11 ± 0.99b
EEAR 1630.67 ± 23.46a 1810.96 ± 87.84a 2179.43 ± 32.83a 60.16 ± 1.82a 1.76 ± 0.13a 61.92 ± 1.83a
Results expressed as mean ± standard deviation for analysis in four replicates. Means followed by distinct letters in same column are significantly different by t-test (p < 0.05). Abbreviations: TAC: total antioxidant capacity = (H-ORACFL + L-ORACFL); EEAR: ethanolic extract of acerola fruit residue.
Table 6. Correlation coefficients (R) of the results of the antioxidant capacity analyses in tilapia fillets
DPPH FRAP ABTS H-ORACFL L-ORACFL
TAC 0.2868 0.0854 0.2220 0.9558 −0.0975
DPPH − 0.9388 0.5495 0.2253 0.1329
FRAP − − 0.2739 −0.0243 0.3473
ABTS − − − 0.2985 −0.3208
H-ORACFL − − − − −0.3858
Abbreviation: TAC: total antioxidant capacity = (H-ORACFL +
systems.32,33 This difference in action between DPPH and
ABTS radicals also helps to explain the tendency in total antioxidant capacity values found in both assays,in which can be observed greater results in ABTS assay regarding DPPH method. Since in QUENCHER procedure the radical acts directly in food matrix, ABTS radicals can react with more compounds than DPPH, since they are applicable in hydrophilic and lipophilic systems, which are both present in the reaction media.
FRAP and ABTS assays are based on electron transfer mechanisms in which the redox potential of the compounds analysed is important. However, good correlation was not found between the results of these assays (R = 0.2739). Although they have the same reaction mechanism and, additionally, comparable redox potential (0.70 V for ferric reduction and 0.68 V for reaction with ABTS),31 this lack
of correlation is because the reaction conditions differ in several aspects between the two assays. FRAP is basically a hydrophilic antioxidant assay that does not respond well to lipophilic antioxidants, while the ABTS assay is successful in antioxidant capacity estimation of both hydrophilic and lipophilic antioxidants in polar and nonpolar solvent media. This can be explained by the fact that the ABTS assay involves a univalent-charged chromophore species (ABTS•+) capable of being solvated by both water and
alcohols as well as by less polar solvent mixtures, while the FRAP assay is associated with a divalent-charged chromophore [Fe(TPTZ)22+], which has a greater affinity
for the aqueous phase due to ion-dipole interactions of the chromophore with the solvent water molecules.34 This
characteristic can be demonstrated in the difference in solvent employed in each assay, while FRAP is performed in pure water, ABTS assay uses a mixture of ethanol and water (50:50, v/v). Furthermore, the FRAP assay employs pH control (pH 3.6), unlike the ABTS procedure, which changes the conditions of the reaction media. As the last factor possibly determining the low correlation value found among the assays, we have different steric effects between the oxidant molecules and the FeIII-TPTZ
2 complex (in
FRAP assay) and ABTS•+ radical.31
Good correlation between TAC of tilapia fillets and H-ORACFL results was observed (R = 0.9558), showing
a greater contribution of hydrophilic compounds with antioxidant capacity in the total antioxidant capacity of the fillets. The same superiority of hydrophilic contribution was observed by Wu et al.16 in analysing beef.
However, good correlations between H-ORACFL,
L-ORACFL and TAC ×DPPH, FRAP and ABTS assays were
not found. The DPPH, ABTS and FRAP assays are based on an electron transfer mechanism and were applied following the QUENCHER procedure, which does not use extraction
steps, i.e., the radical acts directly on the food matrix, determining the antioxidant capacity of both soluble and insoluble compounds present in the sample.7 On the other
hand, the ORACFL assay shows two significant differences
from the others techniques: the first is the necessity of prior extraction step, determining separately the antioxidant capacity of hydrophilic and lipophilic fractions that are soluble and extractable in the sample; and the second is the action mechanism involving the ORACFL assay, based on
hydrogen atom transfer.31 These differences may explain
the low values of correlation found between the assays.
Conclusions
The supplementation of tilapia diet with ethanolic extract of acerola fruit residue resulted, generally, in an improvement of the antioxidant capacity of the fillets. Despite the difficulty in determining the total antioxidant capacity in meat products, the employment of the QUENCHER procedure was adequate for this purpose, and the ORACFL assay has confirmed the superior contribution
of hydrophilic antioxidants in the total antioxidant capacity of the fillets. Supplementation in relation to the fatty acid composition, showed a positive effect on the PUFA/SFA ratio of the fillets, but not a beneficial effect on the n-6/n-3 ratio. Thus, supplementation was more effective in potentiating the antioxidant capacity of the fillets than in increasing their lipid quality.
References
1. Santos, L. D.; Furuya, W. M.; Silva, L. C. R.; Matsushita, M.; Silva, T. S. C.; Aquacult. Nutr. 2011, 17, 70.
2. Ministério da Pesca e Agricultura (MPA); Boletim Estatístico
da Pesca e Aquicultura - Brasil 2010, Brasília, Brazil, 2012. 3. Food and Agriculture Organization of United Nations (FAO);
The State of World Fisheries and Aquaculture 2012, Rome, Italy, 2012.
4. Visentainer, J. V.; Souza, N. E.; Matsushita, M.; Hayashi, C.;
Franco, M. R. B.; Food Chem. 2005, 90, 557.
5. Justi, K. C.; Hayashi, C.; Visentainer, J. V.; Souza, N. E.;
Matsushita, M.; Food Chem. 2003, 80, 489.
6. Dubois, V.; Breton, S.; Linder, M.; Fanni, J.; Parmentier, M.;
Eur. J. Lipid Sci. Technol.2007, 109, 710.
7. Gökmen, V.; Serpen, A.; Fogliano, V.; Trends Food Sci. Technol.
2009, 20, 278.
8. Navarro, R. D.; Navarro, F. K. S. P.; Ribeiro-Filho, O. P.;
Ferreira, W. M.; Pereira, M. M.; Seixas-Filho, J. T.; Food Chem.
2012, 134, 215.
9. Lima, V. L. A. G.; Mélo, E. A.; Maciel, M. I. S.; Prazeres, F. G.;
10. Vendramini, A. L.; Trugo, L. C.; J. Braz. Chem. Soc. 2004, 15, 664.
11. Mezadri, T.; Pérez-Gálvez, A.; Hornero-Méndez, D.; Eur. Food
Res. Technol. 2005, 220, 63.
12. Oliveira, A. C.; Valentim, I. B.; Silva, C. A.; Bechara, E. J. H.;
Barros, M. P.; Mano, C. M.; Goulart, M. O. F.; Food Chem.
2009, 115, 469.
13. Babbar, N.; Oberoi, H. S.; Uppal, D. S.; Patil, R. T.; Food Res.
Int. 2011, 44, 391.
14. Prior, R. L.; Hoang, H.; Gu, L.; Wu, X.; Bacchiocca, M.; Howard, L.; Hampsch-Woodill, M.; Huang, D.; Ou, B.;
Jacob, R.; J. Agric. Food Chem. 2003, 51, 3273.
15. Wu, X.; Beecher, G. R.; Holden, J. M.; Haytowitz, D. B.;
Gebhardt, S. E.; Prior, R. L.; J. Agric. Food Chem. 2004, 52,
4026.
16. Wu, C.; Duckett, S. K.; Neel, J. P. S.; Fontenot, J. P.; Clapham, W. M.; Meat Sci. 2008, 80, 662.
17. Huang, D.; Ou, B.; Hampsch-Woodill, M.; Flanagan, J. A.;
Prior, R. L.; J. Agric. Food Chem.2002, 50, 4437.
18. Huang, D.; Ou, B.; Hampsch-Woodill, M.; Flanagan, J. A.;
Deemer, E. K.; J. Agric. Food Chem.2002, 50, 1815.
19. National Research Council (NRC); Nutrient Requirements of
Warmwater Fishes and Shellfishes, Washington, USA, 1983. 20. Ribeiro, A. B.; Bonafé, E. G.; Silva, B. C.; Montanher, P. F.;
Santos-Júnior, O. O.; Boeing, J. S.; Visentainer, J. V.; J. Braz.
Chem. Soc.2013, 24, 797.
21. Association of Analytical Communities (AOAC); Official
Methods of Analysis, 15th ed., Association of Official Analytical
Chemists: Arlington, 1990.
22. Bligh, E. G.; Dyer, W. J.; Can. J. Biochem. Physiol. 1959, 37, 911.
23. Ministério da Saúde, Secretaria de Vigilância Sanitária; Portaria No. 41, de 14 de janeiro de 1998; Diário Oficial da República Federativa do Brasil, Brasil, 1998.
24. Hartman, L.; Lago, R. C.; Lab. Pract. 1973, 22, 475. 25. Visentainer, J. V.; Quím. Nova. 2012, 35, 274.
26. Serpen, A.; Gökmen, V.; Fogliano, V.; Meat Sci. 2012, 90, 60. 27. Benzie, I. F. F.; Strain, J. J.; Anal. Biochem. 1996, 239, 70. 28. Re, R.; Pellegrini, N.; Proteggente, A.; Pannala, A.; Yang, M.;
Rice-Evans, C.; Free Radical Biol. Med. 1999, 26, 1231.
29. Simopoulos, A. P.; Biomed. Pharmacother. 2002, 56, 365.
30. Simopoulos, A. P.; J. Am. Coll. Nutr. 2002, 21, 495. 31. Müller, L.; Fröhlich, K.; Böhm, V.; Food Chem. 2011, 129, 139.
32. Serpen, A.; Gökmen, V.; Fogliano, V.; J. Food Comp. Anal.
2012, 26, 52.
33. Kim, D. O.; Lee, K. W.; Lee, H. J.; Lee, C. Y.; J. Agric. Food
Chem. 2002, 50, 3713.
34. Çelik, S. E.; Özyürek, M.; Güçlü, K.; Apak, R.; Talanta2010,
81, 1300.
Submitted on: March 21, 2014