Article
Printed in Brazil - ©2014 Sociedade Brasileira de Química0103 - 5053 $6.00+0.00A
*e-mail: [email protected]
Flow Injection Analysis with Amperometric Detection for Morpholine
Determination in Corrosion Inhibitors
Sanair M. de Oliveira,a Angelo Siguemura,a Hugo O. Lima,a Flávia C. de Souza,a Alvaro A. O. Magalhães,b Roberta M. Toledob and Eliane D’Elia*,a
aInstituto de Química, Universidade Federal do Rio de Janeiro, Avenida Athos da Silveira Ramos,
149, 21941-909 Rio de Janeiro-RJ, Brazil
bCentro de Pesquisas e Desenvolvimento Leopoldo Américo Miguez de Mello (Cenpes)/Petrobras,
Av. Horácio Macedo 950, Cidade Universitária, 21941-915 Rio de Janeiro-RJ, Brazil
Neste estudo, um método eletroquímico é proposto utilizando análise por injeção em fluxo e detecção amperométrica com eletrodos impressos de carbono para determinação de morfolina com intuito de monitorar a qualidade de inibidores de corrosão à base de morfolina e a concentração residual de inibidores que controlam a corrosão interna em dutos da indústria de petróleo. O método amperométrico apresentou um alto coeficiente de correlação linear (r = 0,9941) com uma resposta linear na faixa de concentração de 20-120 mg L–1, um limite de detecção de 10 mg L–1 e um limite de quantificação de 30 mg L−1. Além disso, o método mostrou ser preciso, linear e homocedástico.
A recuperação do método amperométrico foi de 100 ± 6%, e a recuperação para amostra real de condensado foi de 99 ± 2%. Portanto, o método proposto é promissor para análise de inibidores comerciais à base de morfolina em dutos da indústria de petróleo com metodologias simples e de baixo custo comparadas com as técnicas de cromatografia iônica.
In this study, an electrochemical method is proposed using flow injection analysis and amperometric detection with screen-printed carbon electrodes for morpholine determination to monitor the quality of morpholine-based commercial inhibitors and the residual concentration of inhibitors that control internal corrosion in oil industry pipelines. The amperometric method resulted in a strong linear correlation coefficient (r = 0.9941) with a linear response over a concentration range of 20-120 mg L–1, a limit of detection of 10 mg L–1 and a limit of quantification of 30 mg L–1. In addition, the method has been shown to be precise, linear and homoscedastic. The recovery for the amperometric method was 100 ± 6%, and the recovery for the real condensate sample was 99 ± 2%. Thus, the proposed method is promising for analysing morpholine-based commercial inhibitors in oil industry pipelines with simple and low-cost methodologies compared with ion chromatography techniques.
Keywords: morpholine, corrosion inhibitors, amperometry, screen-printed electrodes, flow
injection analysis
Introduction
The overall costs associated with corrosion were estimated to be around $276 billion per year in the U.S., according to the 2002 National Association of Corrosion Engineers report.1 Corrosion is a major problem
encountered in industry, especially in steam generation and pipeline systems. The corrosion of metallic materials
is commonly caused by pH variations and by the presence of oxidising media, which exist in both the vapour and liquid phases. Thus, mitigating strategies for corrosion inhibition are essential to prevent premature degradation of industrial equipment.1
In the oil industry, for example, corrosion inhibitors protect the internal linings of crude oil pipelines, gas pipelines, and boilers with great efficiency.2 These
Heterocyclic compounds are classified as effective corrosion inhibitors.3,4 Their high inhibition efficiencies
are directly related to the presence of electronegative functional groups and to π-electrons found in triple bonds or
conjugated double bonds. Aromatic rings and heteroatoms (e.g., sulphur, phosphorus, nitrogen and oxygen) are crucial for the inhibitory capacity of the molecules, because they act as optimal adsorption sites, and the mechanism of inhibition occurs primarily through a surface adsorption process.5,6
Therefore, morpholine and morpholine derivatives are considered to be excellent corrosion inhibitors and are used as components in commercially available corrosion inhibitors.7,8
The addition of corrosion inhibitors such as morpholine and its derivatives is essential to avoid both general and pitting corrosion of pipelines, which are covered by oil and hydrogen sulphide-containing water, high salinity formation water or seawater at high temperatures.9
Therefore, it is necessary to monitor and determine the concentration of these inhibitors throughout the entire pipeline. Inhibitor concentrations below certain threshold values can result in irreparable structural damage and increased production cost.10
Amines can be analysed by an array of analytical techniques, such as direct titration, colourimetry, spectrophotometry and polarography. However, the main analytical techniques for the determination and quantification of morpholine and its amine-containing thermal degradation products, which are present in different matrices, are ion-exchange chromatography (IEC), gas chromatography (GC) and high-performance liquid chromatography (HPLC).11-16
Unfortunately, analyses based on chromatography are costly, require more time than analyses by other methods and can be cumbersome for certain samples.17 Thus, the
difficulties associated with these methods point to the need for simpler techniques that are low cost, can be miniaturised and exhibit a low detection limit for the analyte.
Regarding these goals, electroanalytical techniques are suitable for trace analysis and are an interesting alternative by which to identify and quantify compounds in industrial water because of their high sensitivity, fast response time and low cost.18 Their advantages arise from their capability
for direct, in situ usage without the need for sample pre-treatment, which is in contrast with the aforementioned chromatographic techniques.19 By taking advantage of the
electroactivity of morpholine, our group has developed electrochemical methods to detect morpholine.
Flow injection analysis (FIA) systems offer excellent advantages, such as the reproducibility of sample processing and transport to the detector (convective mass transport),
leading to reproducible measurements, high sampling rates, simple and low cost manifolds, reagent and waste economy, and the possibility of automation. Furthermore, the use of a FIA system to transport samples to the detector in electroanalytical methods reduces the contact time between the sample and the electrode, minimising the adsorption effect.20,21 Finally, the combination of FIA
with electrochemical detection is attractive because of the flexibility of the former and the diagnostic power of the latter.22
Screen printing technology is a well-established technique for the fabrication of chemical sensors and biosensors that can be applied to FIA systems.23 Disposable
screen-printed electrodes (SPEs) offer a number of advantages over conventional electrodes. For instance, SPEs are suitable for working with microvolumes of material, are applicable for decentralised assays (point of care tests), are reproducible, can be mass-produced and are a promising route for the production of miniaturised sensors.24 Moreover,
screen-printed electrochemical sensors do not require pre-treatments such as electrode polishing or electrochemical pre-treatment via electro-deposition, which are commonly applied to other electrode materials. The adaptability of SPEs is also of great benefit in various areas of research; the ability to easily modify the electrodes by applying different commercially available inks for the reference, counter, and working electrodes, allows the production of highly specific and finely calibrated electrodes for specific target analytes.23 Finally, SPEs based on carbon inks are
particularly interesting for their low background currents, broad potential windows and high signal-to-noise ratio when they are used as sensors. Such electrodes with carbon inks are composed of graphite particles, a polymer binder and other additives (for the dispersion, printing and adhesion tasks). It is considered that the process of fabrication of the SPEs strongly affects the electron transfer reactivity and overall analytical performance of the resulting carbon sensors.25,26
Based on the aforementioned information, the purpose of the present work is to develop an electroanalytical method based on FIA with amperometric detection using disposable screen-printed carbon electrodes (SPCEs) to monitor the quality of morpholine-based commercial inhibitors and residual inhibitors that control internal corrosion in oil industry pipelines.
Experimental
Reagents, apparatus and procedures
working electrode, a silver reference electrode and an auxiliary carbon electrode.
The electroactivity of morpholine was evaluated using cyclic voltammetry curves with a scan rate of 50 mV s–1
from 0.5 to 1.3 V. A 0.1 mol L–1 KCl solution was used as
the supporting electrolyte, and the voltammetric curves were obtained in the absence and presence of morpholine (200 mg L–1).
The amperometric analyses using FIA were performed with a Millan four-channel peristaltic pump (P) to provide a constant flow (1.5 mL min–1) of the electrolyte solution.
The injection valve (I) was equipped with a 30-µL injection
sample loop. A DropSens flow amperometric cell (FC) was used with a screen-printed electrode, and a 1.0 V potential was applied. The working electrode potential was set and controlled by a potentiostat (PO). FIA signals were recorded by the computer (RE). All tubes were made of silicon and were 0.5 mm in internal diameter. A diagram of the flow system is shown in Figure 1.
All chemicals were of analytical reagent grade (purchased from Merck - Darmstadt, Germany), and doubly distilled water was used throughout. A stock solution of a morpholine standard was prepared, and the working solutions were obtained by diluting the stock solution in the supporting electrolyte, which was a 0.1 mol L–1 KCl solution.
All measurements were performed using an Autolab potentiostat, model PGSTAT 100, from Eco Chemie (Netherlands) with a current amplifier module controlled by GPES 4.8 software. All experiments were performed at 25 °C.
Validation study
Validation of the amperometric method using FIA for the quantitative determination of morpholine was performed via several steps, which were important to ensure the reliability of the obtained results.27,28
Linearity
The linearity study was performed by evaluating the analytical curve constructed using six different concentrations
of the morpholine standard solution (from 20 to 120 mg L–1)
containing a 0.1 mol L–1 KCl solution. The analysis was
performed in triplicate for each concentration using a carbon screen-printed electrode as the working electrode and amperometry as the electrochemical technique. The analytical curve (peak area vs. morpholine concentration) was acquired by fitting the data obtained with the morpholine standard samples to the linear regression model. This curve was submitted to the Cochran test to evaluate the bilateral deviation of the variances to a 5% significance level. The residue graph was generated from the differences between the values calculated from the straight line of the analytical curves and the values obtained experimentally.
Detection and quantification limits
The detection and quantification limits were also determined theoretically and experimentally. To obtain the experimental limits, different concentrations of morpholine were analysed in an electrochemical flow cell in decreasing order of morpholine concentration. The experimental detection limit was obtained from the lowest current of morpholine oxidation that was still significantly different from the baseline of the amperometric curve. The theoretical limits were determined according to the standard deviation criteria of the analytical curve. The equation used was as follows:
DL = 3.3σc / α (1)
where DL is the detection limit, σc is the curve standard
deviation and α is the slope of the analytical curve. The
quantification limit was estimated as three times the detection limit.
Recovery
Standard solutions of morpholine were prepared with concentrations ranging from 20 to 120 mg L–1. Several
aliquots were added into the flow electrolyte cell. The recovery method study was performed with these synthetic samples using the proposed amperometric method. A sample recovery study was also performed with real condensate samples (100-fold dilution) provided by CENPES/Petrobras fortified with 30, 50 and 70 mg L–1
morpholine.
Because there is no official method to determine the inhibitor content in gas condensate at Petrobras and because of the uncertainty about the condensate flow, the inhibitor is injected based on gas volume. Therefore, 0.25 to 2 L of inhibitor is injected per million cubic feet of gas. If the
condensate flow is low, the inhibitor concentration could be approximately 2000 ppm.
Precision
The precision of the method was obtained on the basis of intra-assay comparisons, based on the repeatability of the analyses, which was determined from the standard deviations obtained in triplicate from an analytical curve constructed with the same instrument. Furthermore, two concentrations of morpholine (20 and 120 mg L–1) were studied, using 10
injections for each concentration. The intermediary precision was evaluated by comparing analytical curves obtained on different days and by different operators.
Variances and residue analysis
The results of any quantitative method that can be described by a linear regression model should present analytical curves with significantly constant (homogenous) variances. This is referred to as homoscedasticity. When these variances increase along with the concentration of the analysed species, the homoscedastic condition is violated (heteroscedasticity). The Cochran test was used to evaluate if the applied method was homo- or heteroscedastic. This test estimates the bilateral deviation of the variances at a 5% significance level. The unique limitation for its use is the replication number, which should be equal for all measured series.27
The residue is represented by the difference between the measured and model-predicted values. The residue analysis was evaluated to validate both the regression model and the variance behaviour.27 A residual plot was prepared for
each set of analyses.
Study of the matrix effect
The matrix effect is the effect on an analytical method caused by all the other components of the sample except the specific compound to be quantified. The matrix effect in the amperometric method was measured by statistical comparison of the analytical curves performed in the synthetic morpholine solution and in the condensate sample.
Comparison of different analytical curves
To evaluate the slope of the two analytical curves, which were obtained from distinct matrices, a sequence of statistical calculations was necessary. First, the residual variance (Se2) was determined for each analytical
curve.27,28 Then, the Snedecor test was applied to verify if
residual variances were significantly different.27,28 When
the calculated F value (Fcal) is lower than the critical F value (Fcrit), the variances can be considered statistically
equivalent. In the second step, the grouped variance was calculated for each calibration curve. In the last step, the calculated t value (tcal) was obtained and compared with the critical t value (tcrit) for a 5% significance level.27,28 If tcal is
lower than tcrit, then the slopes of the two calibration curves can be considered statistically equivalent.21
Results and Discussion
Electroactivity
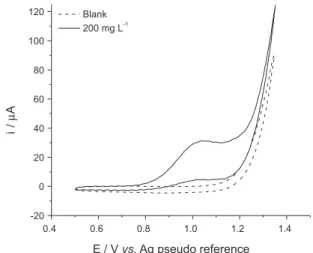
The electroactivity of morpholine was investigated over a potential range of 0.5-1.3 V. Figure 2 shows the cyclic voltammograms obtained in the absence and presence of 200 mg L–1 of morpholine in 0.1 mol L–1 KCl using SPCEs
with a scan rate of 50 mV s–1. The presence of an anodic peak
was observed at approximately +1.0 V only in morpholine and correlated with the anodic processes of morpholine. No cathodic peak was observed on the reverse sweep within the investigated potential range, showing that the morpholine oxidation is an electrochemical irreversible process. The peak potential was shifted in a positive direction when the scan rate was increased (results not shown), which confirms the irreversibility of the electrochemical process.
Hydrodynamic voltammetry
In the FIA measurements, the first important results were obtained from hydrodynamic voltammetry. Figure 3 shows hydrodynamic voltammograms for 30-µL injections
of 70 mol L−1 morpholine using 0.1 mol L–1 KCl solution
as the carrier stream. The peak currents of morpholine
Figure 2. Cyclic voltammograms obtained in the absence and presence of (200 mg L–1) morpholine standard solution in 0.1 mol L–1 KCl using
and corresponding background responses are shown in Figure 3a. A sigmoidal current potential curve with a plateau was observed; the S/B ratios were calculated from Figure 3a as a function of potential. As shown in Figure 3b, the S/B ratio reaches a maximum value at 1.0 V. Hence, this potential was selected for quantitative amperometric detection in the FIA experiments.
FIA parameters
Table 1 shows the slopes of the analytical curves obtained with different flow rates (1.5, 2.0 and 2.5 mL min−1) using
the optimised potential. It can be seen that the higher sensitivity was reached with the 1.5 mL min–1 flow rate.
Because the cell was equipped with a 30 µL sample loop,
the injection volume was fixed at 30 µL.
Linearity
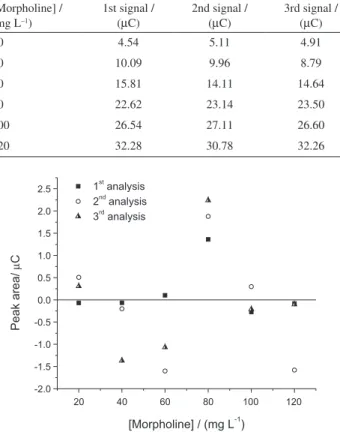
Figure 4 shows the relationship between the peak area (in µC) and the morpholine concentration (in mg L–1) over
the concentration range of 20-120 mg L–1. The curve has
a high correlation coefficient (r = 0.9941). According to the residual plot (Figure 5), the residues fell in a random distribution around the zero line (straight line), and no pattern was observed. This means that the proposed linear model was adequate to describe the data. This graph also showed that the linear regression model was correct, because the residues did not exceed 2.5 µC, corresponding
to a value of 12 mg L–1, which is near the detection
limit.
Figure 3. (a) Hydrodynamic voltammogram in the absence and presence of a 70 mg L–1 morpholine solution with the averages of the peak currents
from four injections (the analyte solution was injected four times at each potential, and then the average peak current was obtained by calculation), using 0.1 mol L−1 KCl solution as a carrier stream. (b) Hydrodynamic of
the signal-to-blank ratio. The flow rate was 1.5 mL min−1.
Table 1. Slopes and linear correlation coefficients for the analytical curves with varying flow rates from 20 to 120 mg L–1 of morpholine
in KCl solution measured by the amperometric method using FIA and screen-printed carbon electrodes
Flow rate / (mL min–1) Slope / (µC / mg L–1) Linear correlation
coefficient
1.5 2.78 × 10⁻⁷ 0.9970
2.0 1.68 × 10⁻⁷ 0.9934
2.5 9.74 × 10⁻⁸ 0.9919
Figure 4. Amperometric (a) and analytical (b) curves recorded using several morpholine concentrations in 0.1 mol L–1 KCl solution at 1.0 V
using FIA and screen-printed electrodes. Morpholine concentrations: (a) 20 mg L–1; (b) 40 mg L–1; (c) 60 mg L–1; (d) 80 mg L–1; (e) 100 mg L–1;
based on the standard deviation of the analytical curve (Figure 4b).
Recovery study
The recovery results shown in Table 2 were obtained from synthetic samples with different morpholine concentrations. The amperometric method using FIA presented recovery values close to 100% and a relative error below 6%. These results suggested good performance considering the trace recovery of morpholine concentrations. Table 4 shows the recovery results obtained from real condensate samples fortified with 30, 50 and 70 mg L–1 of morpholine. The
method presented sample recovery values close to 99% and a relative error below 2%.
Precision
The amperometric method precision was evaluated based on the repeatability of the method by observing the standard deviation obtained with each concentration of analyte in the range of 20-120 mg L–1.
A good repeatability was verified (i.e., there were only small variations in the results of the analyses performed in triplicate within a short time using the same conditions). The relative standard deviation values did not exceed 7% variability (Table 2), which is considered acceptable for this type of technique. Moreover, the results obtained from 10 injections of 20 and 120 mg L–1 of morpholine
were 6.6% and 3.9% of the relative standard deviation (RSD), respectively. Thus, the proposed method can be considered to have good precision considering the type of analysis employed.
For intermediary precision, the variances obtained from the amperometric analytical curves for different operators (Figure 6a) give a calculated F-value (2.64) that is lower than the critical F-value (9.61 bilateral) for a 95% confidence level, indicating equal variances. The slopes of the analytical curves were also compared; the calculated t-value (0.25)
Figure 5. Residue graph from the analytical curve obtained by the amperometric method using FIA and screen-printed electrodes.
Table 2. Data for analytical curve obtained from different standard concentrations of morpholine in KCl solution by the amperometric method using FIA and screen-printed carbon electrodes
[Morpholine] / (mg L–1)
1st signal / (µC)
2nd signal / (µC)
3rd signal /
(µC) Average S
2 / µC2 RSD /% Recovery /%
20 4.54 5.11 4.91 4.85 0.08 6 105
40 10.09 9.96 8.79 9.61 0.51 7 95
60 15.81 14.11 14.64 14,85 0.76 6 95
80 22.62 23.14 23.50 23.09 0.20 2 109
100 26.54 27.11 26.60 26.75 0.10 1 100
120 32.28 30.78 32.26 31.77 0.74 3 98
The Cochran test was applied to the amperometric method, and the calculated value (0.32) was also lower than the tabulated value (0.62) for the curve over the range of 20-120 mg L–1. This result indicated homogeneous variances
of the response with changing analyte concentration, which characterises homoscedastic behaviour. Therefore, a linear regression method can be used. Table 2 shows the data for different standard concentrations of morpholine in chloride solution.
Limits of detection and quantification
Table 3 presents the limits of detection (LOD) and quantification (LOQ) experimentally determined by using a decreasing series of morpholine concentrations and theoretically determined using equation 1, which is
Table 3. Limits of detection and quantification obtained from different criteria
Criteria LOD / (mg L–1) LOQ / (mg L–1)
Standard deviation curve 13 36
is lower than the critical t-value (2.45 bilateral) for a 95% confidence level, indicating equal slopes for these two curves. By comparing the variances of analytical curves obtained on different days via amperometry (Figure 6b), it was observed that the calculated F-value (1.77) is lower than the critical F-value (9.61 bilateral) for a 95% confidence interval, indicating that the hypothesis was accepted and that the variances are equal. The slopes of the analytical curves prepared on different days were also compared; the calculated t-value (0.25) is lower than the critical t-value
(2.45 bilateral) for a 95% confidence level, meaning that the slopes for these two curves are equal. Because the analytical curves obtained by different operators on different days are not significantly different, we conclude that the intermediary precision for the amperometric method is precise.
Study of the matrix effect
The matrix effect was evaluated by comparing an analytical curve of morpholine constructed from KCl solution and an analytical curve of morpholine constructed from a real condensate sample provided by CENPES/ Petrobras. A 100-fold dilution of the condensate sample was performed prior to analysis due to its high morpholine content.
The comparison of the variances from the amperometric analytical curves (Figure 7) resulted in a calculated F-value (1.53) that is lower than the critical F-value (7.15 bilateral) for a 95% confidence level, indicating equal variances. The slopes of the analytical curves were also compared; the calculated t-value (0.35) is lower than the critical t-value (2.31 bilateral) for a 95% confidence level, indicating equal slopes for these two curves and that there is no matrix effect affecting the sensitivity of the method.
Table 4. Recovery results obtained for the amperometric method using FIA and screen-printed electrodes for two real condensate samples fortified with morpholine
Sample [Morpholine] / (mg L–1)
1st signal / (mg L–1)
2nd signal / (mg L–1)
3rd signal / (mg L–1)
Average / (mg L–1)
S2 /
(mg L–1)2
RSD / %
Recovery / %
30 29 31 28 29 2.3 5 98
A 50 49 52 46 49 9.0 6 98
70 71 70 70 70 0.3 1 100
30 31 29 30 30 1.0 3 100
B 50 50 47 53 50 9.0 6 100
70 68 75 72 72 12 5 102
Figure 6. Precision study for the amperometric method: (a) analytical curves obtained on different days and (b) analytical curves obtained by different operators.
Conclusions
The amperometric method reported here using FIA and SPEs can be used for the determination of morpholine in condensate samples. In the concentration range studied (20-120 mg L–1), the response was linear. This concentration
range allows the quantification of morpholine at low concentrations. The detection (10 mg L–1) and quantification
(30 mg L–1) limits were considered good for this type of
analysis. Moreover, the method was shown to have good recovery, precision and accuracy. The method presented a recovery for the synthetic samples of 100% and a relative error below 6%, and the real sample recovery values were close to 99% with a relative error below 2%. Therefore, the developed amperometric method using FIA can be used to quantify morpholine in condensate samples in the field.
Acknowledgments
S. M. Oliveira would like to thank Coordenação de Aperfeiçoamento de Pessoal de Nível Superior (Capes) for a master fellowship. The authors are grateful to Conselho Nacional de Desenvolvimento Cientifico e Tecnológico (CNPq, 309202/2012-4), Fundação Carlos Chagas Filho de Amparo à Pesquisa do Estado do Rio de Janeiro (FAPERJ, E-26/110.740/2013) and Petrobras for their financial support.
References
1. Corrosion Costs and Preventive Strategies in the United States, Publication No. FHWA-RD-01-156, as found in Supplement to Materials Performance, July 2002.
2. Kelly, R. G.; Scully, J. R.; Shoesmith, D. W.; Buchheit, R. G.; Electrochemical Techniques in Corrosion Science and Engineering, 1st ed.; Marcel Dekker, Inc.: New York, Basel,
2003.
3. Peabody, A. W.; Bianchetti, R. L.; Peabody’s Control of Pipeline Corrosion, 2nd ed.; NACE International, The Corrosion Society:
Houston, USA, 2001.
4. Quraishi, M. A.; Jamal, D.; Corros. Sci. 2002, 58, 387. 5. Ebenso, E. E.; Arslan, T.; Kandemi̇rli, F.; Love, I.; Öğretir,
C. L.; Saracoğlu, M.; Umoren, S. A.; Int. J. Quantum Chem. 2010, 110, 2614.
6. Ebenso, E. E.; Obot, I. B.; Murulana, L. C.; Int. J. Electrochem. Sci. 2010, 5, 1574.
7. Subramanian, A.; Gopalakrishnan, R.; Boopathi, C.; Balakrishnan, K.; Vasudevan, T.; Natesan’, M.; Rengaswamy, N. S.; Bull. Electrochem. 1998, 14, 289.
8. Vuorinen, E.; Ngobeni, P.; van der Klashorst, G. H.; Skinner, W.; de Wet, E.; Ernst, W. S.; Br. Corros. J. 1994, 29, 120. 9. Migahed, M. A.; Nassar, I. F.; Electrochim. Acta 2008, 53, 2877. 10. Papavinasam, S.; Revie, R. W.; Attard, M.; Demoz, A.;
Michaelian, K.; Corros. Sci. 2003, 59, 897.
11. Gilbert, R.; Rioux, R.; Saheb, S. E.; Anal. Chem. 1984, 56, 106. 12. Kadnar, R.; J. Chromatogr. A 1999, 850, 289.
13. Vatsala, S.; Bansal, V.; Tuli, D.; Rai, M.; Jain, S.; Srivastava, S.; Bhatnagar, A.; Chromatographia 1994, 38, 456.
14. Luong, J.; Shellie, R. A.; Cortes, H.; Gras, R.; Hayward, T.; J. Chromatogr. A 2012, 1229, 223.
15. Pietsch, J.; Hampel, S.; Schmidt, W.; Brauch, H. J.; Worch, E.; Fresenius’ J. Anal. Chem. 1996, 355, 164.
16. Joseph, M.; Kagdiyal, V.; Tuli, D. K.; Rai, M. M.; Jain, S. K.; Srivastava, S. P.; Bhatnagar, A. K.; Chromatographia 1993, 35, 173.
17. Chýlkóva, J.; Tomáškova, M.; Mikysek, T.; Šelešovská, R.; Jehlička, J.; Electroanalysis 2012, 24, 1374.
18. Okumura, L. L.; Stradiotto, N. R.; Electroanalysis 2007, 19, 709.
19. Galli, A.; de Souza, D.; Garbellini, G. S.; Coutinho, C. F. B.; Mazo, L. H.; Avaca, L. A.; Machado, S. A. S.; Quim. Nova 2006, 29, 105.
20. Silva, M. L. S.; Garcia, M. B. Q.; Lima, J. L. F. C.; Barrado, E.; Port. Electrochim. Acta 2006, 24, 261.
21. de Souza, F.; da Silva, D.; Simões, M.; Faria, R.; de Melo, M.; Toledo, R.; d’Elia, E.; J. Appl. Electrochem. 2012, 42, 585. 22. Cervini, P.; Cavalheiro, E. T. G.; J. Braz. Chem. Soc. 2008, 19,
836.
23. Metters, J. P.; Kadara, R. O.; Banks, C. E.; Analyst 2011, 136, 1067.
24. Rao, V. K.; Sharma, M. K.; Pandey, P.; Sekhar, K.; World J. Microbiol. Biotechnol. 2006, 22, 1135.
25. Wang, J.; Tian, B.; Nascimento, V. B.; Angnes, L.; Electrochim. Acta 1998, 43, 3459.
26. Morrin, A.; Killard, A. J.; Smyth, M. R.; Anal. Lett. 2003, 36, 2021.
27. Massart, D. L.; Vandeginste, B. G.; Buydens, L. M.; Handbook of Chemometrics and Qualimetrics: Part A, 1st ed.; Elsevier:
New York, 1997.
28. Miller, J. C.; Miller, J. N.; Statistics for Analytical Chemistry, 3rd ed.; Prentice Hall: New York, 1993.
Submitted on: March 13, 2014