Article
Printed in Brazil - ©2014 Sociedade Brasileira de Química0103 - 5053 $6.00+0.00
A
*e-mail: [email protected]; [email protected]
Side-Chain Alkylation of Toluene with Methanol over Zn-Modified KX Zeolite
Lanlan Song,a Yue Yu,b Zhenrong Li,*,a Shaoqing Guo,c Liangfu Zhao*,a and Wen Lia
aInstitute of Coal Chemistry, Chinese Academy of Sciences, 030001 Taiyuan, P. R. China
bLin Yi Academy of Technology Cooperation and Application, 276000 Linyi, P. R. China
cTaiyuan University of Science and Technology, 030024 Taiyuan, P. R. China
O efeito de Zn na alquilação da cadeia lateral de tolueno com metanol sobre zeólita KX foi investigado. Descobriu-se que a adição de pouca quantidade de Zn a KX poderia aumentar significativamente a conversão de tolueno. Além disso, os resultados mostraram que a conversão de tolueno pelo catalisador ZnKX (0,8 wt.%) era quase o dobro daquela por KX. Os catalisadores
foram caracterizados por difração de raios X (XRD), fisissorção de N2, dessorção programada
por temperatura (TPD) de NH3, espectroscopia no infravermelho (IR) da absorção de piridina,
CO2-TPD, espectroscopia fotoeletrônica de raios X (XPS) e IR da adsorção dos reagentes. Os
resultados de TPD e XPS mostraram que a existência de espécies de Zn pode aumentar a força dos sítios básicos. Os resultados de IR da adsorção dos reagentes sugerem que a introdução de Zn poderia diminuir o tolueno quimissorvido e aumentar as quantidades relativas de formato unidentado. Os resultados indicaram que é possível atingir um excelente balanço entre as propriedades ácido-base do catalisador e a estequiometria de sorção de metanol-tolueno, levando à melhora da atividade catalítica.
The effect of Zn on side-chain alkylation of toluene with methanol over KX zeolite was investigated. It was found that the addition of Zn with a low content over KX could enhance toluene conversion significantly. In addition, the results showed that the conversion of toluene over ZnKX (0.8 wt.%) catalyst was almost twice as high as that over KX. The catalysts were characterized
by X-ray diffraction (XRD), N2 physisorption, NH3-temperature-programmed desorption (TPD),
pyridine absorption infrared (IR) spectroscopy, CO2-TPD, X-ray photoelectron spectroscopy (XPS)
and IR adsorption of reactants. The TPD and XPS results showed that the existence of Zn species could increase the strength of basic sites. The IR adsorption of reactants results suggested that the introduction of Zn could decrease the chemisorbed toluene and increase the relative amounts of unidentate formate. The results indicated that an excellent balance between the acid-base properties of the catalyst and the sorption stoichiometry of methanol-toluene could be achieved, leading to the improvement of catalytic activity.
Keywords: side-chain alkylation, X zeolites, toluene, methanol
Introduction
Ethylbenzene and styrene are essential materials for the petrochemical industry. Currently, they are mainly produced by the catalytic alkylation of benzene with ethylene and followed by the catalytic dehydrogenation of ethylbenzene. Compared with the conventional production route, the side-chain alkylation of toluene with methanol to styrene and ethylbenzene is considered as an attractive route due to economical advantages.1
In recent years, some catalysts have been tested for the toluene side-chain alkylation, such as CaO,2 LDHs,3 alkali
ion-exchanged X or Y zeolites,1,4-10 MgO encapsulated
silicalite,11 and cesium-containing microporous carbon.12
effects on the side-chain alkylation by tuning the acidity and basicity of catalysts.13-16 Other researchers devoted to
the effect of transition metal on the catalytic performances of side-chain alkylation. Das and Pramanik found that the addition of Fe-Mo oxide into CsX could facilitate the formation of formaldehyde (the true alkylation reagent) and then improve the activity of side-chain alkylation reaction.17 Lacroix et al. reported that Cu contributed to the
dehydrogenation of reaction intermediates.18 Compared with
copper, zinc possesses a similar electronic structure and is widely used in the reaction of methanol dehydrogenation to formaldehyde. However, to our knowledge, the effects of Zn addition on the activity of side-chain alkylation reaction are less investigated.
In addition, it is well known that the surface acid-base sites of alkali ion-exchanged X zeolites primarily originate from alkali cations and the framework oxygens.19,20 The
strength of surface acid-base sites is highly sensitive to the distribution of electronic density. Thus, in the situation where the acidic and basic centers are catalytically active sites for the side-chain alkylation, it should be possible to optimize the reaction by introducing reductive Zn species rich in electron into X zeolites.
In the present work, the side-chain alkylation of toluene with methanol was studied over K-exchanged X zeolite (KX) and Zn-modified KX (ZnKX) to study the effect of Zn on catalytic activity. The results suggested that Zn had an excellent promoting effect on the side-chain alkylation. In addition, the catalysts were characterized by N2-physisorption, X-ray photoelectron spectroscopy (XPS), NH3-temperature-programmed desorption (TPD),
CO2-TPD, and infrared (IR) spectroscopy adsorption to provide insight into the effect of Zn additives.
Experimental
Catalyst preparation
KX catalysts were obtained from NaX (Nankai catalysts company, Si/Al: 1.46, Na content: 12.03 wt.%) by ion-exchange procedure. The detailed procedure is as follows: 20 g of NaX zeolites were added to a vessel containing 250 mL of an aqueous potassium hydroxide solution (0.5 mol L-1) with stirring at 90 °C for 2 h. Then, the catalysts
were filtered before being washed. After being washed with 500 mL deionized water, the obtained sample was dried overnight at 100 °C and calcined in air at 550 °C for 3 h.
A series of ZnKX with different Zn contents (0.2, 0.8, 1.0 and 2.0 wt.%) were prepared by impregnation method with aqueous Zn(NO3)2 as metal precursor. The KX zeolite was added to Zn(NO3)2 aqueous solution at 25 oC and stirred
for 12h. Then, the slurry was heated to 80 oC until nearly all
water had evaporated. After drying the mixture at 110 oC
overnight, the sample was calcined in air at 550 oC for 3 h.
Catalyst characterization
Brunauer-Emmett-Teller (BET) surface areas were measured by N2 physisorption (Micromeritics Tristar 3000). The relative pressure range used to quantify the surface area is between 0.06 and 0.2. The crystal structures of samples were characterized by XRD measurement (Bruker AXS D8 ADVANCE) using Cu-Kα radiation. The surface element states were determined by X-ray photoelectron spectroscopy (XPS) using a KRATOS XSAM800 fitted with an Al Kα source (hk = 1486.6 eV) with two ultra-high-vacuum (UHV) chambers. The residual pressure inside the analysis chamber was below 2 × 10⁻⁷ Pa. All binding
energies were referred to the C1s line at 284.8 eV.
The properties of acid and base were determined by temperature-programmed desorption of NH3 and CO2 (NH3-TPD, CO2-TPD), respectively. Catalysts were firstly
reduced at 450 oC in H
2 for 2 h before the TPD experiments
and then cooled to 40 oC in order to adsorb NH
3 or CO2.
When adsorption reached saturation, the samples were evacuated and heated from 40 to 450 oC at a ramp rate of
10 oC min-1 in He flow (50 mL min-1) and the desorption
of NH3 or CO2 was monitored on-line by a thermal
conductivity detector. In order to support the results of NH3-TPD, the pyridine absorption spectra were carried out
by Fourier transform (FT)-IR (EQUINOX55) spectroscopy. The chemisorption of methanol, toluene or the mixture (toluene-methanol molar ratio = 1:2) on the catalyst surface was performed during IR measurement using a Nicolet Avatar 360 instrument. In order to achieve good signal to noise ratio, 64 scans were used at a resolution of 4.0 cm-1.
In a typical experiment, a self-supported catalyst wafer (1.3 cm diameter) was placed in IR cell. After the reduction by H2 at 450 oC for 2 h, the catalyst was cooled to 50 oC.
Then, methanol (or toluene, or the mixture) was impulsed into the IR cell. After reaching the saturation of adsorption (monitored by time-resolved IR spectroscopy), the residual reactants were evacuated and IR spectra were recorded. For the experiment of methanol desorption at 150 oC, we
needed to increase the temperature to 150 oC after reaching
the saturation of adsorption at 50 oC, then, evacuate and
record the IR spectra.
Catalyst evaluation
about 4.06 g catalyst (20-40 mesh) were packed into the middle of the reactor supported by quartz sand. Before reaction, the catalysts were first reduced at 450 oC in
H2 (40 mL min-1) for 2 h and then cooled to 50 oC in
N2 (50 mL min-1). After that, the catalysts were heated
to the corresponding reaction temperature (400, 425, 450, 475 or 500 oC) in N
2. A mixture of toluene and
methanol (molar ratio of 1:2) was vaporized at 150 oC
in a preheating section and then delivered to the reactor at a rate of 2.4 cm3 h-1 in N
2 (50 mL min-1) flow. The
reaction was carried out under atmospheric pressure with a space velocity of 0.5 h-1. The products were identified
by gas chromatography-mass spectrometry (GC-MS) analyses (Agilent 7890A-5975C) with DB-1 column. The composition of liquid samples and outlet gases were analyzed by gas chromatography with HP-FFAP column and TDX-01 column using flame ionization detector and thermal conductivity detector. In addition, a blank experiment without catalyst was performed as well and proved no reactivity for fixed-bed reactor. The flow rate of gaseous products was measured by a low flow gas meter. Gas production rates were calculated according to the flow rate of N2.
The conversion of toluene (XTol), the selectivity (Selei) and yield (Yi) to the various products are defined
as follows:
(1)
(2)
(3)
where ∑yi,o and yTol,oare the molar fractions of aromatic
products and the outlet molar fraction of toluene, respectively. Time on stream was 8 h.
Results and Discussion
Physicochemical properties
Figure 1 shows the XRD patterns of all samples. It can be seen that all of them exhibit the characteristic peaks of a faujasite framework,21 and no Zn-containing phases
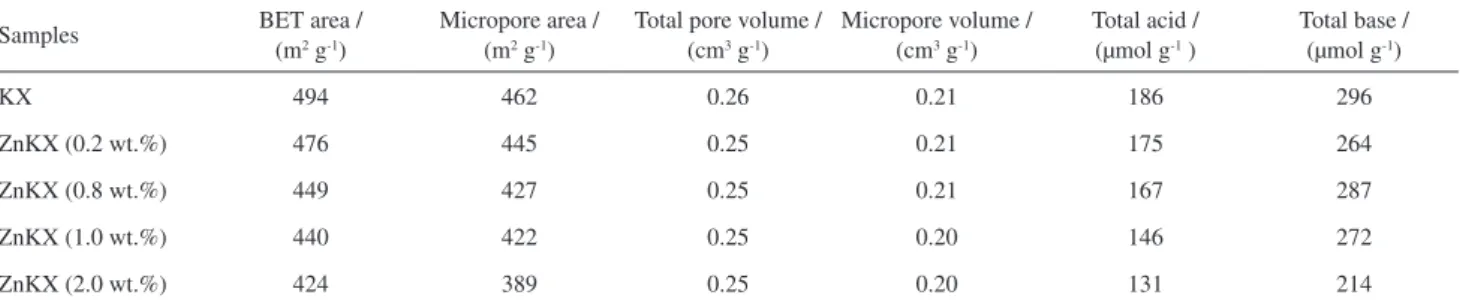
are observed for ZnKX probably due to the low content and high dispersion on the zeolite surface. The results of nitrogen adsorption are shown in Table 1. It can be seen that the addition of Zn causes a little decrease in the BET surface areas. This may be due to the distribution of Zn species at the zeolite surface and the pore opening.
In order to investigate the state of Zn species, the Zn 2p XPS spectra of fresh and spent catalysts over ZnKX (0.8 wt.%) were measured and the results are shown in Figure 2. The peaks at 1021.60 ± 0.1 and 1044.93 ± 0.5 eV are ascribed to Zn 2p3/2 and Zn 2p1/2, respectively.22 Because
it is difficult to distinguish Zn metal and Zn2+ for Zn 2p 3/2
lines, the full width at half-maximum (FWHM) values of Zn 2p3/2 and Zn 2p1/2 – Zn 2p3/2 splitting values are
calculated to judge the state of Zn and the relevant data
Table 1. Textural properties and the amounts of acid-base sites of all catalysts
Samples BET area / (m2 g-1) Micropore area / (m2 g-1) Total pore volume / (cm3 g-1) Micropore volume / (cm3 g-1) Total acid / (µmol g-1 ) Total base / (µmol g-1)
KX 494 462 0.26 0.21 186 296
ZnKX (0.2 wt.%) 476 445 0.25 0.21 175 264
ZnKX (0.8 wt.%) 449 427 0.25 0.21 167 287
ZnKX (1.0 wt.%) 440 422 0.25 0.20 146 272
ZnKX (2.0 wt.%) 424 389 0.25 0.20 131 214
are listed in Table 2. It can be seen that the FWHM value for fresh ZnKX (0.8 wt.%) is 2.67 eV, while it increases to 3.39 eV for the spent one. Besides, the Zn 2p1/2 – Zn 2p3/2 splitting value is observed to decrease from 23.32 eV for fresh ZnKX (0.8 wt.%) to 23.01 eV for the spent one. The results mean that Zn species have been partially reduced from ZnO to ZnOx (x < 1) during the prereduction and reaction of the catalysts.23
The TPD results of KX and ZnKX with different Zn contents are shown in Figure 3 and Table 1. In order to support the results of NH3-TPD the pyridine absorption spectra are shown in Figure 4. As shown in Figure 3 and Figure 4, the addition of Zn decreases the areas of 1440 cm-1 (arisen from pyridine adsorption on Lewis
acid),24 the areas of NH
3 and CO2 desorption peaks. It
indicates that the amounts of acid-base sites are reduced after the introduction of Zn. This may be due to parts of acid-base sites being covered by ZnOx species. In addition,
the NH3 desorption peak temperatures shift to lower temperatures, while the CO2 desorption peak temperature
moves towards a higher value with the increase of Zn content. This suggests that the addition of Zn can decrease the acidity and increase the basicity for ZnKX catalysts. The change in the strength of acid-base may be due to the
electronic effect of ZnOx (x < 1). As discussed above, Zn species have been partially reduced from ZnO to ZnOx (x < 1). According to the model describing metal-support interactions,25 the interface between Zn species and KX
is richer in electrons after the introduction of reduced Zn species. As an electron donor, partial electrons may transfer from reduced Zn species to the framework oxygen. The electron charge of the framework oxygen atoms was enhanced. Then, the interaction between K+ and framework
oxygen becomes stronger due to the enhanced electron charge of the framework oxygen. Thus, the ability to obtain electron from K+ was weakened and the acid strength of K+
is decreased. In addition, the increasing electron charge of oxygen indicates that the basicity is enhanced.26
Table 2. Zn 2p3/2, Zn 2p1/2 and FWHM values for ZnKX (0.8 wt.%)
Samples Zn 2p3/2 / eV Zn 2p1/2 / eV Zn 2p1/2 – Zn 2p3/2
spliting / eV
FWHM /eV Zn 2p3/2
ZnKX (0.8 wt.%, fresh) 1021.61 1044.93 23.32 2.67
ZnKX (0.8 wt.%, spent) 1021.54 1044.55 23.01 3.39
Figure 2. XPS spectra of Zn 2p of ZnKX (0.8 wt.%): (a) fresh; (b) spent.
Figure 3. TPD profiles of NH3 or CO2 for the catalysts: (a) NH3-TPD
In addition, XPS analysis of O was also carried out over KX and ZnKX (0.8 wt.%) catalysts in order to further support the above analysis, and the results are shown in Figure 5. It has been reported that the peak at around 531.00 eV is ascribed to the framework oxygen.27,28
Compared with KX, it can be seen that the binding energy of framework oxygen over ZnKX (0.8 wt.%) shifts toward a lower value, suggesting that the electron is enriched over the framework oxygen of ZnKX (0.8 wt.%). The enrichment of electrons in framework oxygen may result in the increase of base strength for ZnKX (0.8 wt.%). The result concurs with the result of TPD.
Catalytic performances
All catalysts are tested for the side-chain alkylation of toluene with methanol to investigate the effect of Zn on the catalytic performances of KX zeolite. The results are shown in Figure 6 and Table 3.
Figure 6a exhibits the conversion of toluene over KX and ZnKX catalysts, which are plotted as a function of reaction temperature. It can be seen from Figure 6a that each catalyst exhibits the highest toluene conversion at 450 oC. The addition of Zn in low contents (0.2, 0.8
and 1.0 wt.%) can improve the conversion of toluene significantly compared with KX zeolite at each reaction temperature. When further increasing the Zn loading to 2.0 wt.%, however, the reaction activity decreases slightly. Among the tested catalysts, ZnKX (0.8 wt.%) shows the highest conversion of toluene (14%) at 450 oC, which is two
times as high as that of KX (7%). Meanwhile, the yields of ethylbenzene and styrene are also enhanced from 6% (for KX) to 12% (for ZnKX (0.8 wt.%)) (see Figure 6b). Therefore, Zn has an excellent promoting effect on the side-chain alkylation of toluene with methanol.
Table 3 lists the toluene conversion and product selectivities of all catalysts. It can be seen from the results that ethylbenzene and styrene are the major reaction products and the selectivity of xylenes is only at about 5% for all catalysts. The introduction of Zn has little effect on the selectivity of side-chain alkylation (SeleEb+Sty) and ring alkylation (SeleXy). However, with the addition of Zn,
the selectivity of ethylbenzene (SEb) increases from 48% (KX) to 68% (ZnKX (0.8 wt.%)) and the selectivity of styrene (SSty) is decreased. That may be because methanol activation is enhanced by Zn addition. Thus, the reaction of styrene hydrogenation with methanol to ethylbenzene is accelerated.29
It has been reported that methanol can be directly decomposed to formaldehyde and H2, and formaldehyde
as the true alkylation reagent participates in the side-chain alkylation.6 Simultaneously, parts of formaldehyde are
consumed through forming CO and H2. It can be seen from Figure 6c that when the reaction temperature is between 450 and 500 oC, the production rate of H
2 increases obviously
for ZnKX catalysts. This indicates that the rate of methanol to formaldehyde or formaldehyde decomposition may be enhanced by Zn addition. However, compared with KX catalyst, it can be seen that the content of CO in the outlet gas is not increased significantly for ZnKX catalysts (see Figure 6d). Therefore, more formaldehyde may be retained to participate in the side-chain alkylation over ZnKX catalysts. Figure 4. IR spectra of pyridine adsorbed on catalysts.
Figure 5. XPS spectra of O1s: (a) KX ; (b) ZnKX (0.8 wt.%). The two catalysts were firstly reduced at 450 oC in H
2 for 2 h before the XPS
IR characterization of reactant adsorption
In order to obtain the information about the stability of reactants on the catalyst surface, the IR study of toluene adsorption, methanol adsorption, and the mixture adsorption on all catalysts were performed. Moreover, Scheme 1 shows the structures of methanol and toluene adsorption on alkali ion-exchanged X zeolite to better understand the interaction of reactants and catalysts.30,31
Figure 7 shows that the IR spectra of methanol adsorption on KX and ZnKX catalysts after equilibration at 50 oC. As shown in the results, Zn addition leads to the
broadening of the stretching vibrations of the methanol
hydroxy group (3277 cm-1), asymmetric and symmetric
C–H stretching vibration of methanol (2949 and 2828 cm-1,
Figure 6. Effect of Zn contents on side-chain alkylation: (a) conversion of toluene; (b) total yield of styrene and ethylbenzene; (c) H2 production rate; (d)
CO production rate. Reaction conditions: 0.1 MPa, weight hourly space velocity (WHSV) = 0.5 h-1 and 50 mL min-1 N 2 flow.
Table 3. Toluene conversion and product selectivities (Selei) of all catalysts (450 oC)
Sample XTol / % Selei / %
Eba Styb Xyc C9d Eb + Sty
KX 7 48 45 4 3 93
ZnKX (0.2 wt.%) 9 57 33 5 5 90
ZnKX (0.8 wt.%) 14 63 26 5 6 89
ZnKX (1.0 wt.%) 11 65 23 6 6 88
ZnKX (2.0 wt.%) 8 68 22 6 4 90
aEthylbenzene; bstyrene; cxylenes; dtrimethylbenzene
respectively).30 The results suggest that the interaction
between methanol and active sites on the surface of ZnKX catalysts is increased. Namely, the hydrogen bond between the hydroxyl group (or the hydrogen atoms of the methyl group) and the zeolite lattice oxygen becomes stronger due to the increase of the basicity for ZnKX catalysts (Scheme 1).32 Therefore, the C–H and O–H bonds of
methanol are more easily cleaved, making HCHO more easily formed on ZnKX.30
The IR spectra of adsorbed toluene on all catalysts are shown in Figure 8. Previous work has shown that toluene is stabilized on zeolite surface primarily via the interaction between the electrons of the aromatic ring and the cations of the zeolite.31 Meanwhile, activating the carbon atom of the
methyl group in toluene mainly results from the hydrogen bond between the methyl group and the lattice oxygens (see Scheme 1, structure 2).33,34 It can be seen from Figure 7
that there is almost no difference in the position and the intensity of the C–H stretching vibration bands for the aromatic ring (3049 and 3020 cm-1) and the methyl group
(2917 and 2866 cm-1) over KX and ZnKX.35 This indicates
that the addition of Zn has little effect on the polarization of the methyl group and adsorption of toluene compared with methanol.
Figure 9 shows the IR spectra of two reactants coadsorbed on KX and ZnKX at 50 oC. As shown in
Figure 8, most of the characteristic bands of toluene and methanol are superposed except for the band at 1494 cm-1
(the aromatic ring C=C stretching vibration).35 So, this
band can be used to judge the concentration of chemisorbed toluene. It can be found that the intensity of the aromatic ring C=C stretching vibration decreases with the increase
of Zn contents, which implies that the concentrations of chemisorbed toluene decreases due to the introduction of Zn.
Figure 10 shows the IR spectra of methanol adsorption on KX and ZnKX with different Zn contents after desorption at 150 oC. As shown in this figure, formate and carbonate
species can be identified on the surface of the catalysts. The bands around 1687 and 1587 cm-1 are ascribed to
the C–O stretching vibration of unidentate formate, and the asymmetric O–C–O stretching vibration of bidentate formate, respectively.36 The band centered at 1473 cm-1
(or 1486 cm-1) suggests the formation of carbonate.37 If
we judge on the basis of the relative intensities of the bands between 1600 and 1450 cm-1, the amount of surface
Figure 7. IR spectra of methanol adsorbed on the catalysts at 50 oC: (a)
KX; (b) ZnKX (0.2 wt.%); (c) ZnKX (0.8 wt.%); (d) ZnKX (1.0 wt.%); (e) ZnKX (2.0 wt.%).
Figure 8. IR spectra of toluene adsorbed on the catalysts at 50 oC: (a)
KX; (b) ZnKX (0.2 wt.%); (c) ZnKX (0.8 wt.%); (d) ZnKX (1.0 wt.%); (e) ZnKX (2.0 wt.%).
Figure 9. IR spectra of the mixture of toluene with methanol (toluene-methanol ratio is 1:2) adsorbed on the catalysts at 50 oC: (a) KX; (b)
Figure 10. Spectra of methanol adsorbed on KX and ZnKX catalysts after desorption at 150 oC and pie charts of the amount of surface unidentate formate
relative to the amounts of surface carbonate and bidentate formate.
unidentate formate (1687 cm-1) relative to the amounts of
surface carbonate and bidentate formate tends to increase in the order KX < ZnKX (0.2 wt.%) < ZnKX (0.8 wt.%) < ZnKX (1.0 wt.%) ≈ ZnKX (2.0 wt.%). The high relative intensity of unidentate formate is indicative of more HCHO formation, which is in good agreement with the results as discussed above.
Effect of Zn additives on catalytic performance of KX
At present, some researchers have investigated the mechanism of toluene side-chain alkylation. It is believed that the acid sites are required to stabilize formaldehyde and toluene on the catalyst, while the basic sites are important to activate toluene and methanol.33 The following equations
are the typical ones that are commonly accepted.38-40 That
is, after methanol was dehydrogenated to formaldehyde by the basic sites of catalysts (equation 4), the carbon atom in the methyl group of toluene is subsequently activated by the basic sites, and then the activated toluene and formaldehyde form styrene (equation 5). Finally, styrene converts to ethylbenzene through hydrogenation with H2 or transfer hydrogenation with methanol29 (equations 6 and 7).
CH3OH → HCHO + H2 (4)
C6H5CH3 + HCHO → C
6H5CH=CH2 + H2O (5)
C6H5CH=CH2 + H2→ C6H5CH2CH3 (6)
C6H5CH=CH2 + CH3OH → C
6H5CH2CH3 + HCHO (7)
It has been reported that the activity of side-chain alkylation is always associated with high rates of formaldehyde production.41 In the present work, Zn
addition brings an increase in the electron donor capacity
of the framework oxygen (Lewis base). Consequently, HCHO may be formed more easily on ZnKX, which is supported by the increase of surface unidentate formate on ZnKX and the results of methanol adsorption IR as described in the above text. Then, equation 4 will be enhanced. Thus, the activity of side-chain alkylation will be promoted. In addition, Zn addition can result in the decrease of chemisorbed toluene. For KX zeolite, toluene is the main chemisorbed species,33 however,
the conversion of toluene is not more than 10%. This indicates that most of the methanol is consumed through decomposition to CO and H2. When the concentration of chemisorbed toluene decreases, methanol has more chances to be adsorbed on the zeolite surface, leading to more possibility to react with toluene. So, it is concluded that the appropriate decrease of the chemisorbed toluene may facilitate side-chain alkylation. These factors may be the key reasons for the enhancement of the activity of side-chain alkylation.
Conclusions
References
1. Wieland, W. S.; Davis, R. J.; Garces, J. M.; J. Catal.1998, 173, 490.
2. Tanabe, K.; Takahashi, O.; Hattori, H.; React. Kinet. Catal. Lett.
1977, 7, 347.
3. Manivannan, R.; Pandurangan, A.; Appl. Clay Sci.2009, 44, 137.
4. Engelhardt, J.; Szanyi, J.; Valyon, J.; J. Catal.1987, 107, 296. 5. Yashima, T.; Sato, K.; Hayasaka, T.; Hara, N.; J. Catal.1972,
26, 303.
6. Sivasankar, N.; Vasudevan, S.; J. Indian Inst. Sci.2010, 90, 231.
7. Hathaway, P. E.; Davis, M. E.; J. Catal. 1989, 116, 263. 8. Hunger, M.; Schenk, U.; Seiler, M.; Weitkamp, J.; J. Mol.
Catal. A: Chem.2000, 156, 153.
9. Žilková, N.; Košová, G.; Kotrla, J.; Ernst, S.; Čejka, J.; Stud. Surf. Sci. Catal.2005,158, 1629.
10. Borgna, A.; Magni, S.; Sepúlveda, J.; Padró, C. L.; Apesteguía, C. R.; Catal. Lett.2005, 102, 15.
11. Jiang, N. Z.; Jin, H. L.; Jeong, E. Y.; Park, S. E.; J. Nanosci. Nanotechnol.2010, 10, 227.
12. Yamaguchi, N.; Kobayashi, A.; Sodesawa, T.; Nozaki, F.; React. Kinet. Catal. Lett.1984, 25, 11.
13. Romero, M. D.; Ovejero, G.; Rodríguez, A.; Gómez, J. M.;
J. Porous. Mater. 2004, 11, 31.
14. Dolgikh, L. Yu.; Stolyarchuk, I. L.; Strizhak, P. E.; Shvets, A. V.; Il’in, V. G.; Theor. Exp. Chem.2006, 42, 37.
15. Scott Smith, R.; Ihrman, K. G.; LeBlanc, M. B.; J. Organomet. Chem.1990, 382, 333.
16. Unland, M. L.; Barker, G. E.; US pat. 4,115,4241978.
17. Das, N. K.; Pramanik, K.; J. Indian. Chem. Soc.1997, 74, 705. 18. Lacroix, C.; Deluzarche, A.; Kiennemann, A.; Zeolites1984,
4, 109.
19. Barthomeuf, D.; Catal. Rev.1996, 38, 521.
20. Deka, R. Ch.; Hirao, K.; J. Mol. Catal. A: Chem.2002, 181, 275.
21. Romo, P. P.; Herrera, H. A.; Valente, J. S.; Guzmán-Castillo, M. L.; Hernández-Beltrán, F.; Fripiat, J. J.; Microporous Mesoporous Mater.2010, 132, 363.
22. Schön, G.; J. Electron Spectrosc. Relat. Phenom. 1973, 2, 75. 23. Wen, M. L.; Li, Q.; Li, Y. T.; J. Electron Spectrosc. Relat.
Phenom. 2006, 153, 65.
24. Parry, E. P.; J. Catal.1963, 188, 371.
25. Kubička, D.; Kumar, N.; Venäläinen, T.; Karhu, H.; Kubičková, I.; Österholm, H.; Murzin, D. Yu.; J. Phys. Chem. B2006, 110, 4937.
26. Arishtirova, K.; Kovacheva, P.; Predoeva, A.; Appl. Catal., A
2003, 243, 191.
27. Okamoto, Y.; Kubota, T.; Microporous Mesoporous Mater.2001,
48, 301.
28. Xie, J. H.; Huang, M. M.; Kaliaguine, S.; Appl. Surf. Sci.1997,
115, 157.
29. Hattori, H.; Alabi, W.; Jermy, B. R.; Aitani, A. M.; Al-Khattaf, S. S.; Catal. Lett. 2013, 143, 1025.
30. Rep, M.; Palomares, A. E.; Eder-Mirth, G.; van Ommen, J. G.; Rosch, N.; Lercher, J. A.; J. Phys. Chem. B2000, 104, 8624. 31. Rep, M.; Ph.D. Thesis, University of Twente, The Netherlands,
2002.
32. Serrallach, A.; Meyer, R.; Günthard, Hs. H.; J. Mol. Spectrosc.
1974, 52, 94.
33. Palomares, A. E.; Eder-Mirth, G.; Rep, M.; Lercher, J. A.;
J. Catal.1998, 180, 56.
34. Palomares, A. E.; Eder-Mirth, G.; Lercher, J. A.; J. Catal. 1997,
168, 442.
35. Serra, R. M.; Miró, E. E.; Boix, A.V.; Microporous Mesoporous Mater.2010, 127, 182.
36. King, S. T.; Garces, J. M.; J. Catal.1987, 104, 59.
37. Unland, M. L.; J. Phys. Chem.1978, 82, 580.
38. Itoh, H.; Miyamoto, A.; Murakami, Y.; J. Catal.1980, 64, 284.
39. Hathaway, P. E.; Davis, M. E.; J. Catal.1989, 119, 497. 40. Hunger, M.; Schenk, U.; Weitkamp, J.; J. Mol. Catal. A: Chem.
1998, 134, 97.
41. Itoh, H.; Hattori, T.; Suzuki, K.; Murakami, Y.; J. Catal.1983,
79, 21.