Nonlinear Optical Properties of Liquid Crystals
Probed by Z-scan Technique
S.L. G´omez, F.L.S. Cuppo, and A.M. Figueiredo Neto
Complex Fluid Group, Institute of PhysicsUniversity of S˜ao Paulo, SP, Brazil
Received on 22 May, 2003
We present a review of experimental data on the nonlinear optical properties of thermotropic and lyotropic liquid crystals probed by the Z-scan technique. Depending on the time scale, different processes originate a nonlinear optical response. Particularly, at nanosecond range, the physical processes associated with the nonlinear response in thermotropics are not completely understood. In lyotropics, the nonlinear response at ms time scale is from thermal origin and depends on the particular mesophase, relative concentration of the components, and temperature.
1
Introduction
Liquid crystals (LC) are known to exhibit large optical nonlinearities which have been the subject of considerable study in recent years, from both experimental and theoreti-cal points of view. So far, almost all the research has been focused on thermotropic liquid crystals (TLC) [1,2]. Since LC molecules typically have delocalized π-electrons, they are believed to be potential sources of fast and large nonlin-earities. Due to bulk anisotropy of nematic LC, nonlinear optical parameters (e.g., nonlinear refraction indexn2 and
nonlinear optical absorptionβ) are expected to depend on the geometrical configuration between the light polarizing direction (E) and the nematic directorbn.
However, only few works have been devoted to lyotropic liquid crystals (LLC). LLC are mixtures of amphiphilic molecules and a solvent which, at given temperature and rel-ative concentration conditions, self-assembly in anisotropic aggregates. These aggregates can have different forms and, if their shape anisotropy is small, they are called micelles [3]. In nematic LLC made by at least two types of am-phiphilic molecules and a solvent, micelles present an or-thorhombic symmetry and most of the particularities of ly-otropic mesophases are related to the properties of these building blocks [4]. A characteristic of the nematic LLC, which is not observed in thermotropics, is the existence of a biaxialNbxmesophase, between a calamiticNc and a dis-coticNdnematic mesophases [5].
Nonlinear optical phenomena can be due toelectronic
andnonelectronicprocesses [6]. The former refers to those radiative interactions between the active electron and the op-tical electric field. Usually, they are very fast, of the order of
ps, and spatially localized. Examples are second- and third-harmonic generation. Nonelectronic processes are nonra-diative interactions such as temperature-, density-, and
or-der parameter-changes, cis-trans isomerism, phase transition and director axis-reorientation. These mechanisms usually do not involve generation of new frequency radiation. Sev-eral techniques have been developed to measure the non-linear optical refractive indexn2(nonlinear interferometry,
degenerate four-wave mixing and ellipse rotation, among others). These techniques are sensitive but usually require relative complex experimental apparatus. The single-beam Z-scan technique, an application developed by the CREOL group [7], is simple (from the experimental point of view) and sensitive in measuring both the nonlinear refraction and nonlinear absorption. It is in a powerful and straightforward technique to study nonlinear properties of materials in dif-ferent time scales.
The aim of this work is to present anoverviewof the nonlinear optical research in TLC and LLC by using the Z-scan technique. The Z-Z-scan technique will be described and the origin of the nonlinear optical properties at different time scales will be discussed.
2
The Z-scan technique
In this technique, a polarized Gaussian laser beam, propa-gating in thez-direction, is focused to a narrow waist. The sample is moved along thez-direction and the transmitted intensity is measured through a finite aperturein the far field
Laser
L S I
PD Ch
PD
PC + z - z
Figure 1. Schema of the experimental setup of the Z-scan tech-nique: chopper (Ch); lens (L); sample (S); iris (I) and photo detec-tor (PD).
To figure out how the Z-scan transmittance as a func-tion ofzis related to the nonlinear refraction of the sample, let us assume a medium with a negative nonlinear refraction index and a thickness smaller than the diffraction length of the focused beam. This can be considered as a thin lens of variable focal length. Beginning far from the focus (z <0), the beam irradiance is low and nonlinear refraction is negli-gible. In this condition, the measured transmittance remains constant (i.e.,z-independent). As the sample approaches the beam focus, irradiance increases, leading to self-lensing in the sample. A negative self-lens before the focal plane will tend to collimate the beam on the aperture in the far field, increasing the transmittance measured at the iris position. After the focal plane, the same self-defocusing increases the beam divergence, leading to a widening of the beam at the iris and thus reducing the measured transmittance. Far from focus (z >0), again the nonlinear refraction is low resulting in a transmittancez-independent. A pre-focal transmittance maximum (peak), followed by a post-focal transmittance minimum (valley) is a Z-scan signature of anegative non-linearity. An inverse Z-scan curve (i.e., a valley followed by a peak) characterize apositive nonlinearity. Fig. 2 depicts these two situations.
0 1.0
n2> 0 n2< 0
Position (z)
ΓS-B
Figure 2. Z-scan theoretical curves of the transmittance as a func-tion ofz, obtained with Eq. 5.
3
Electronic nonlinear optical
process
Let us consider a medium subjected to an (optical) electric fieldE. The induced polarization (P) can be written as:
P=εo
³
χ(1)
E+←→χ(2):
EE+←→χ(3):
EEE+...´,
(1) whereχ(i)is the electrical susceptibility of orderiandε
ois the permittivity of the free space [8]. Considering cen-trosymmetric media and keeping up to third-order terms in Eq. 1, from the Maxwell’s equations one obtains the refrac-tive indexnand the optical absorptionαas functions of the intensityIof the incident laser beam [1]:
n = no+
n2
2 E
2=n
0+γI , (2)
α = αo+β I, (3)
whereno andαo are the linear refractive index and linear optical absorption respectively,n2is a coefficient named the
nonlinear refractive indexandβis thenonlinear optical ab-sorption coefficient. The coefficientsγ andβ are related to the real and imaginary parts, respectively, of third-order electrical susceptibilityχ(3)by:
γ = 1
2n2
oεoc
Re³χ(3)´ (4)
β = ω
n2
oεoc2
Im³χ(3)´.
A comprehensive discussion about units used in nonlinear optics can be found in ref. [9].
For a sample with negligible nonlinear absorption, the on-axis normalized transmittanceΓS−Bas a function ofzis given, approximately, by [7]:
ΓS−B(z) = S(z)
S(z→ ∞) ≃1 + ∆Φo
4x
(1 +x2) (9 +x2),
(5) whereS(t)is the photodetector signal at timet,∆Φois the on-axis nonlinear phase shift at focus,x= z
zo andzois the
Rayleigh rangeof the Gaussian beam. The nonlinear phase shift is given by:
∆Φo= 2πd
λ γIo,
whereλis the light wavelength,Iois the on-axis intensity at focus,dis the sample thickness andcis the speed of light at vacuum.
Note that equation 2 is “local”, i.e., the refractive index at a given point on the material depends only on the light intensity at the same point.
Values of the nonlinear refraction index and nonlinear ab-sorption, obtained in thepicosecondstime scale in 5CB (4-cyano-4’-n-pentylbiphenyl) in the nematic phase, at differ-ent wavelengths by Palffy-Muhorayet al. [10, 11, 12], are shown in Table 1.
The macroscopic susceptibility of third orderχ(3)is
lin-early related to the microscopic second-order hyperpolar-izability γ [13]. Thermotropic liquid crystals are usually organic compounds and these compounds interact weakly through van der Waals forces. Carbons can form two types of bonds: covalentσ-bonds, spatially localized andπ-bonds, regions of delocalized electronic charge. The electronic den-sity ofπ-bonds is much more mobile than that of theσ-bond. So, the nonlinear optical properties mainly depend on the change of polarizability of the electrons in theπ-bonding or-bitals. Hermannet al.[14] shown that the nonlinear optical properties of organic compounds with electrons πin their structures are bigger than those of the saturated compounds with the same number of carbon atoms. They shown also thatγ ∝nσ, wherenσ is the number of electronsσand is nonlinear in the number ofnπ. The model of free electrons for theπ-bonding orbitals [15] predicts that, in the case of a conjugated chain,γ ∝n5
π. In the case of 5CB, the nonlin-ear optical response is due mainly to theπ-electrons of the benzene rings.
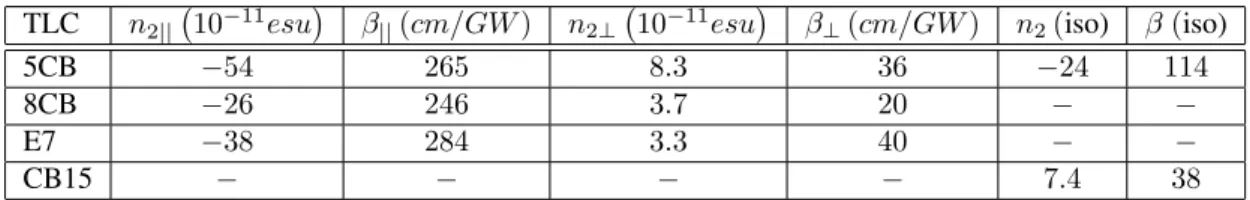
Table 2 shows values ofn2andβ, obtained studying the
nonlinear optical response in time scale of nanoseconds, of the 5CB, 8CB, E7 and CB15 thermotropic liquid crys-tals in the nematic phase [10]. For some of these TLC, e.g., 5CB, a strong nonlinear refraction and absorption have been observed but the mechanism that originate them are not yet well understood. The nonlinear refractionn2was shown to
be fluence-dependent [18] and the nonlinear absorptionβis intensity-dependent, suggesting that different processes are responsible for them [12]. Moreover,n2does not depend on
I, indicating that it originates from a third-order process. On the other hand,β depends linearly onI indicating, a fifth-order process . The nonlinear absorption shows a fast re-sponse time (less than10 nsand larger than30 ps) suggest-ing a two-photon excited-state absorption. This conclusion is supported in the particular case of the 5CB since its linear absorption is very small. On the other hand, the magnitude and time-dependence ofn2 is consistent with those
origi-nated from a thermal mechanism. The only shortcoming, a value ofn2independent onT on approaching the transition
temperatureTcto the isotropic phase, could be explained by a slowing down of the orientational relaxation forT → Tc [17]. At these short time scales, many puzzles remain, like the unexpected large value ofβatnanosecondtime scale, 10- to102times larger than that in thepicosecondtime scale
[16]. To account for this result, it was suggested the pos-sibility of formation ofµm-sized bubbles and microscopic carbonization in the sample during the laser exposure. Other important features that influence the magnitude and sign of the nonlinear refraction index are the beam waist and the thickness of the sample (ref. [16] and references therein). In the case of the isotropic phase of the 5CB it was observed that increasing the beam waist from7µm to35−50µm,
n2changes from negative to positive. This difference is
ex-plained by the dependence of the value of transient thermal-density nonlinearity with negative sign on beam-waist diam-eter. The buildup timetacof the thermal-density nonlinear-ity(∆nρ = (∂n/∂ρ) ∆ρ)is given bytac = ro/Vs, where
ro is the beam radius andVs is the velocity of the sound (∼1.5×10³m/sin liquid crystals). For a7µmdiameter
beam waist, tac is less than the pulse duration. The neg-ative nonlinear refraction is due to density changes of the medium, which overcomes the positive-sign of the transient orientational nonlinearity.
Table 1: Nonlinear refraction and nonlinear absorption of 5CB, at24◦C, with light pulses width of33ps, at different wave-lengths. HGA and HTA mean homogeneous planar alignment and homeotropic alignment, respectively. (1)ref. [10];(2)ref. [12].
λ(nm) n2||
¡
10−11esu¢ β
||(cm/GW) n2⊥
¡
10−11esu¢ β
⊥(cm/GW) 532(1) +1.36(HGA) 2.27(HGA) +0.6(HGA) +0.57(HTA) 0.8(HGA) 0.81(HTA)
600(2) +1.9(HGA) 2.67(HGA) NA NA
1064(2) +0.55(HGA) 0 +0.55(HGA) 0
Table 2: Values of nonlinear refraction index and absorption of selected TLC at532nmand7nslight pulse width (ref. [11]). Columns 2-5 are for nematic phases and 6-7 for LCs in the isotropic phase.
TLC n2||
¡
10−11esu¢ β||(cm/GW) n2⊥
¡
10−11esu¢ β⊥(cm/GW) n2(iso) β(iso)
5CB −54 265 8.3 36 −24 114
8CB −26 246 3.7 20 − −
E7 −38 284 3.3 40 − −
4
Nonelectronic
nonlinear
optical
processes
Although light absorption is a local process, the diffusion of heat gives rise to a nonlinear optical phenomenon which are nonlocal in nature. This indirect nonlinear phenomenon is common to all absorbing materials but in liquid crystals it has an additional characteristics due to their peculiar orien-tational ordering.
Considering a cw Gaussian beam, the energy absorbed is immediately converted into heat. The continuous heat trans-ferred to the sample gives rise to the formation of a radially Gaussian-shaped temperature profile. The hotter region is located in the center of the beam (r = 0, beingrthe radial distance from the beam axis). The index of refractionnof the medium, as a function ofrand the timet, can be written as:
n(r, t) =no+
∂n
∂T∆T(r, t) ,
where ∆T is the temperature increase in the sample and
∂n/∂T is the thermooptic coefficient.
Depending on the time scale of the experiment, one should take into account the thermodiffusion process or
Soret effect[19, 20]. The Soret effect is characterized by a concentration gradient induced by a temperature gradient present in a medium. Due to the fact that in a mixture (e.g., the case of the LLC) the index of refraction depends on the
concentration of solute, the gradient of matter generates a “lens of matter”, in analogy with the thermal lens [21]. Usu-ally, the diffusion of heat and mass have characteristic times ofmsands, respectively [22].
The effects of local heating (due to light absorption) on the propagation of a Gaussian beam were studied by Gor-donet al.[23]. This study is the foundation of the Thermal Lens model (TLM). Carteret al. [24] showed that the nor-malized transmittance in a Z-scan experiment, considering a radial diffusion of heat and the parabolic approximation of the temperature field, can be written as:
ΓT−L(z) = S(z, t= 0)−S(z, t=∞)
S(z, t=∞)
= θ 2x
1 +x2 +θ
2 1
1 +x2, (6)
whereθis the on-axis nonlinear phase shift (i.e., the differ-ence between its value in the center and in the outer edge of the beam) written as:
θ= αoP
λκ
µ
−∂n
∂T
,
whereαois the linear absorption,λandP the wavelength and the power of the incident beam, respectively, andκis the thermal conductivity. The time-evolution of the thermal lens signal is given by:
⌋
S(t, z) = S(t= 0, z) (
1 + θ
1 +tc/2t 2x
1 +x2 + ·
θ
1 +tc/2t
¸2
× 1
1 +x2 )−1
, (7)
⌈
wheretc(z)is a characteristic relaxation time at positionz, given by:
tc(z) = ω
2(z) 4D ,
whereω(z) = £ω2
o
¡
1 +x2¢¤1/2 is the radius of the beam
at positionzandDis the thermal diffusivity of the medium.
4.1
Thermotropic Liquid Crystals
In TLC, measurements made at ms time scale in 5CB, in a geometry where reorientation is not expected, show that nonlinear optical response originates from laser heat-ing due to linear absorption (nonlinear optical absorption is not observed) [11]. The increase in the samples’s temper-ature decreases the degree of orientational order and den-sity, resulting that in most liquid crystals n2|| < 0 and
n2⊥ >0(the symbolsqand⊥represent the directornb par-allel and perpendicular toE, respectively). Typical values
for 5CB (10 mslaser pulse,T = 24◦C,λ = 514 nm) are
n2|| = −10×10−4esuandn2⊥ = 2.0×10⁻⁴esu. How-ever, for ZLI-1538 and T15 thermotropics, both nonlinear refractive indices are negative T15 [T = 180◦C]: n
2|| = −0.68×10⁻⁴esu, n
2⊥ = −0.092×10⁻⁴esu; ZLI1538 [T = 70◦C]: n2|| =−0.43×10⁻⁴esu,n2⊥ =−0.13× 10⁻⁴esu. It was suggested that conjugation of bonds and
conformational changes play some role in these processes.
4.2
General features of the nonlinear optical
response of LLC
Atmstime scale, the nonlinear optical response of LLC has a thermal origin. It depends on the absorption properties of the sample: type of amphiphilic molecules, relative con-centration, phase type, temperature and eventual ferrofluid doping.
positions:z <0,z= 0andz >0. This behavior character-izes a negative nonlinear medium. Figure 4 shows a typical Z-scan curve (normalized transmittance as a function ofz) of a LLC and a fitting function using Eq. 6.
∆T = 3 5 m s
z > 0
z = 0
z < 0
t Z
Γ
Figure 3. Typical oscilloscope’s records of the transmittance, as a function of time, of a lyotropic liquid crystal sample, withn2<0,
when illuminated with a square pulse of∼35ms, in threez po-sitions. Sample in the calamitic nematic phase, with a small fer-rofluid doping, at room temperature (T= 23◦C), a polarization of
the beamE||bn.
-15 -10 -5 0 5 10 15
0.94 0.96 0.98 1.00 1.02 1.04 1.06
Γ
[a
rb
. u
n
it
s]
z [mm]
Figure 4. Typical Z-scan curve of a LLC normalized according to Sheik-Bahae model. Solid line corresponds to a fitting according to Eq. 6). Sample in the calamitic nematic phase, with a small fer-rofluid doping, at room temperature (T = 23◦C), polarization of
the beamE||bn.
Lyotropic liquid crystals in the calamitic nematic (Nc) and isotropic phases were shown to present nonlinear re-fractive index n2 ∼ −10−6esu [25, 26], which is 102
smaller than that measured in 5CB in the same time scale [10]. At theNc phase,n2 <0for both configurations
be-tween the nematic director and the electric field polariza-tion of the beam. On the other hand, the values of the ther-mooptic coefficient and the thermal conductivity are usually
dn
dT ∼10−5◦C−1andκ∼10−1W/m◦C, respectively. The anisotropy observed in the values of these parameters (qand
⊥) are related to microscopic properties and local ordering of the amphiphilic aggregates [27].
4.3
Effect of the ferrofluid doping
Brochard and de Gennes [28] suggested that liquid crystals could be oriented by much weaker magnetic fields (about 103times smaller) if small magnetic grains were
incorpo-rated into the liquid crystalline matrix. Surfacted ferroflu-ids [29] are stable colloidal suspensions of small surfactant coated magnetic grains, typical dimensions of10 nm, dis-persed in a polar or nonpolar liquid carrier. It has been observed that ferrofluid-doped LLC samples are stable over long periods of time. This doping, in small quantities (con-centration of ferrofluid c . 1013grains/cm3), does not
modify some optical properties as well as the phase transi-tion temperatures of LLC [30]. Besides that, the optical ab-sorption of the ferrofluid-doped LLC significantly increases and, consequently, its nonlinear optical response.
-15 -10 -5 0 5 10 15
0.92 0.96 1.00 1.04
1.08 c1
c2 c3 water(c1)
Γ
[
arb. units
]
z [mm]
Figure 5. Experimental Z-scan curves of LLCs in the isotropic phase (KL[27.041], DeOH [6.409],water [66.550]) at room tem-perature (∼25◦C), with different doping concentrations (c
i=1,2,3)
of ferrofluid. In the figurec1> c2> c3.
Figure 5 shows Z-scan curves of a lyotropic mixture in the isotropic phase (composition inweight%: potassium laurate (KL) [27.041], 1-decanol (DeOH) [6.409] and water [66.550]), for different doping concentrations of ferrofluid. At the same Fig. 5 it is shown the Z-scan curve for a pure fer-rofluid solution, with a concentration of grains of the same order than the maximum value used in the doped lyotropic sample. As can be seen from Fig. 5, the strength of the ther-mal lens, i.e.n2, increases with the ferrofluid doping. It was
0 1 2 3 4 5 6 7 8 0
2 4 6 8 10 12 14 16
αr
c (1011grains/cm3)
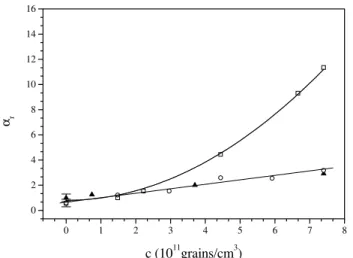
Figure 6. Linear optical absorption as a function of the ferrofluid concentration: (N)pure ferrofluid, i.e., magnetic grains in water;
(°) KL/water, at a concentration of KL smaller than the crit-ical micellar concentration; (¤) KL/1-DeOH/water LLC in the isotropic phase. From ref. [32].
The origin of the enhancement of the optical absorption was also investigated [32]. Fig. 6 shows the linear optical absorption of three ferrofluid-doped systems as a function of the ferrofluid grains concentration: a binary mixture of KL and water, at a concentration of KL smaller than the
cmc [33]; pure ferrofluid (i.e., magnetic grains in water); and a lyotropic mixture (KL/DeOH/water) in the isotropic phase. It was observed that in the case of the pure ferrofluid and the binary of KL and water, the optical absorption in-creases linearly with the ferrofluid doping concentration c
as predicted by the Beer-Lambert law [34]. On the other hand, the behavior of the optical absorption of the ternary lyotropic mixture deviates from the usual Beer-Lambert law. This result clearly shows that the presence of micelles in the system is fundamental to determine the behavior of the lin-ear absorbance as a function ofc. A possible mechanism that could account for this behavior could be the hyperther-mia [35], which is an indirect heating of the micelles via the magnetic grains. Micelles, having more degrees of free-dom (fluctuation of the form, diffusion of molecules at the bilayer, etc.) seem to absorb more than the monodisperse amphiphilic molecules solution. This process could also be one of the responsible for the increase in the nonlinear re-sponse of LLC doped with ferrofluids.
4.4
Influence of the amphiphilic aggregates
The origin of the microscopic mechanisms responsible for the nonlinear optical response of LLC are not yet well known. As mentioned above, the existence of micelles mod-ifies the linear absorbance behavior of the ferrofluid-doped mixture and could also account for the nonlinear optical sponse of the lyotropic liquid crystals. As a general re-mark one can assert that the presence of micelles modify the thermooptic properties of a medium. Z-scan measure-ments done by Cuppo et al. in a binary mixture of KL and water [36], show thatn2 ∼ cte.at KL concentrations
(cKL) below the cmcand increases linearly withcKL for
cKL> cmc, reaching a saturation value forcLK ∼100cmc (see Fig. 9 in ref. [36]). The values of n2 for this binary
mixture are two orders of magnitude smaller than those of the ternary KL/DeOH/water mixture in the isotropic and ne-matic phases. Comparing this result with the known depen-dence of the different physical parameters of amphiphilic solutions at concentrations around the cmc [37], the ab-solute values of the thermooptic coefficient (¯¯∂n∂T¯¯) and of the nonlinear refractive index (|n2|) present, qualitatively,
the behaviors of the high frequency electric conductivity
(σHF) and the inverse of theequivalent electric conductivity (σEQ). The counterions mobility in the double layer around the micelles seems to be strongly related to the nonlinear response of the medium to an electric field.
4.5
Nonlinear birefringence at the
N
c−
I
and
N
c−
N
bxphase transitions
de Gennes showed that the linear birefringence is an ade-quate (scalar) order parameter for liquid crystals [38]. Usu-ally, temperature-driven transitions are determined measur-ing the linear birefrmeasur-ingence by polarized optical microscopy. The dielectric tensor←→ǫ can be written as function of the lin-ear birefringences∆nLandδnL[39]. The measurement of the linear birefringences around the transition temperature (Tc), give informations about the collective behavior of the basic units (molecules or micelles) of the system. Galerneet al.[39] show that theNc−I(here,Istates for the isotropic phase) phase transition is weakly first-order and the linear birefringence has a discontinuity atTcI (here,TcIstates for theNc−I transition temperature). On the other hand, the
Nc−Nbxphase transition is second-order and mean-field. Saupeet al. [5] observed a deviation from the mean-field behavior at theNc−Nbxtransition in a range of tempera-tures ∆TcTc ∼10−4fromT
c, obtainingβ = 0,38(3)for the value of the critical exponent of the order parameter.
Cuppoet al. [41] investigated the behavior of the non-linear refractive indices (n2) and nonlinear birefringence
(∆n2) in the vicinity of theNc −I andNc−Nbx phase transitions in a LLC. Their results at theNc−I transition indicate that the sign of the thermooptic coefficient remains the same up to0.1◦C fromT
cI. The values ofn2 in both
configurations of the laser electric field E with respect to the magnetic fieldHused to orient the nematic: parallel and perpendicular, arenegative. These results are rather differ-ent from those obtained by Pereira et al. [42], in a simi-lar lyotropic mixture, using the Thermal Lens technique. A possible origin for this discrepancy could be related to the orientation of theNcphase sample during the measurement. In the case of the work of Cuppoet al., the magnetic ori-enting field is present during the all the experiment, differ-ently from the one of Pereiraet al.. In the work of Cuppo
et al., the nonlinear optical birefringence in theNc phase, (∆n2 = n2|| −n2⊥) shows a small discontinuity at TcI, consistent with a weak first-order phase transition. In the
ofn2(//and⊥) at the transition temperatureTcN[32]. The nonlinear birefringence was shown to present a divergence behavior of the type∆n2 ∼ |T−TcN|−βwithβ ∼0.5, in both sides (NcandNbxphase domains) of the phase transi-tion temperature. An inversion of the sign ofn2||at theNbx phase was observed in a particular mixture composition of the same mixture. The same behavior was observed in a lyotropic mixture of KL/decylammonium chloride/water in the Nbxphase [43]. The origin of this inversion is not yet understood.
5
Concluding remarks
Although the research of liquid crystals nonlinear optical properties is in the beginning, many of the basic proper-ties involved in these processes have already been discov-ered. Employing the Z-scan technique it was observed that, in ms time scales, the origin of the nonlinear optical re-sponse is thermal and depends on the basic parameters that rule out the mesophases like temperature and relative com-position, among others. Two remarkable features are the strong dependence of the nonlinear optical response on the existence of micelles and the nonlinear enhancement with the ferrofluid doping in micellar mesophases. The deviation from the phenomenological Beer-Lambert law denotes the existence of an interaction between micelles and magnetic grains whose nature is not yet well understood. Finally, the observation of a convergent thermal lens in a biaxial nematic phase could indicate the influence of the geometry of the bi-axial aggregates and of the phase itself, opening an inter-esting subject of research both theoretically and experimen-tally.
Acknowledgments
We thank FAPESP and CNPq/PRONEX for the financial support of this research.
References
[1] I.C. Khoo and S.T. Wu,Optics and Nonlinear Optics of Liq-uid Crystals(World Scientific, Singapore 1993).
[2] F. Simoni,Nonlinear Optical Properties of Liquid Crystals and Polymer Dispersed Liquid Crystals (World Scientific, Singapore 1997).
[3] Phase Transitions in Complex Fluids, ed. P. Tol´edano and A.M. Figueiredo Neto (World Scientific, Singapore 1998). [4] Y. Galerne, A.M. Figueiredo Neto, and L. Li´ebert, J. Chem.
Phys.87, 1851 (1987).
[5] L.J. Yu and A. Saupe, Phys. Rev. Lett.45, 1000 (1980). [6] I.C. Khoo,Liquid Crystals: Physical Properties and
Nonlin-ear Optical Phenomena, (Wiley, New York 1995).
[7] M. Sheik-Bahae, A.A. Said, T.H. Wei, D.J. Hagan, and E.W. Van Stryland, IEEE J. Quantum Electron.26, 760 (1990). [8] Y.R. Shen,The Principles of Nonlinear Optics(Wiley, New
York 1984).
[9] R.W. Boyd,Nonlinear Optics(Academic Press 1992). [10] P. Palffy-Muhoray, H.J. Yuan, L. Li, M.A. Lee, J.R. DeSalvo,
T.H. Wei, M. Sheik-Bahae, D.J. Hagan, and E.W. Van Stry-land, Mol. Cryst. Liq. Cryst.207, 291 (1991).
[11] L. Li, H.J. Yuan, G. Hu, and P. Palffy-Muhoray, Liquid Crys-tals16, 703 (1994).
[12] P. Palffy-Muhoray, T.H. Wei, and W. Zhao, Mol. Cryst. Liq. Cryst.251, 19 (1994).
[13] Ch. Bosshard, inNonlinear Optical Effects and Materials, ed. by P. G¨unter (Springer, Berlin 2000).
[14] J.P. Hermann, D. Ricard, and J. Ducuing, Appl. Phys. Lett.
23, 178 (1973).
[15] P.N. Prasad and D.J. Williams,Introduction to Nonlinear Op-tical Effects in Molecules and Polymers, (Wiley-Interscience, New York 1991).
[16] S.G. Lukishova, J. Nonlin. Opt. Phys. Mat.9, 365 (2000). [17] C.W. Greeff, J. Lu, and M.A. Lee, Liquid Crystals,15, 75
(1993).
[18] Fluence of an electromagnetic field is defined as the time-integral of the intensityIof the electromagnetic field. [19] Ch. Soret, Arch. Sci. Phy. Nat.,2, 48 (1879).
[20] S.R. De Groot, L’Effet Soret, diffusion thermique dans les phases condens´ees, Noord-Hollandsche Uitgevers Maatschappij, Amsterdam, (1945).
[21] S. Alves, A. Bourdon, and A.M. Figueiredo Neto, J. Opt. Soc. Am. B20, 713 (2003).
[22] J. Georges and T. Paris, Anal. Chim. Acta386, 287 (1999). [23] J.P. Gordon, R.C.C. Leite, R.S. Moore, S.P.S. Porto, and J.R.
Whinnery, J. Appl. Phys.36, 3 (1965).
[24] C.A. Carter and J.M. Harris, Appl. Opt.23, 476 (1984). [25] S.L. G´omez, PhD Thesis, University of S˜ao Paulo, Brazil
2000.
[26] S.L. G´omez, F.L.S. Cuppo, A.M. Figueiredo Neto, T. Kosa, M. Muramatsu, and R.J. Horowicz, Phys. Rev. E 59, 3059 (1999).
[27] S.L. G´omez and A.M. Figueiredo Neto, Phys. Rev. E62, 675 (2000).
[28] F. Brochard and P.G.D Gennes, J. Phys-Paris31, 691 (1970). [29] R.E. Rosensweig, Ferrohydrodynamics (Cambridge Univ.
Press, Cambridge, 1985).
[30] A.M. Figueiredo Neto, Y. Galerne, A.M. Levelut, and L. Li´ebert in Physics of Complex and Supermolecular Fluids, EXXON Monograph Series, edited. by S.A. Safran and N.A. Clark (Wiley, New York, 1987), p. 347.
[31] F.L.S. Cuppo, PhD Thesis, University of S˜ao Paulo 2002. [32] F.L.S. Cuppo, S. Gomez and A. M. Figueiredo Neto,
submit-ted.
[33] Thecmc (critical micelar concentration) is defined as the minimum concentration of amphiphilic molecules in a sol-vent above which amphiphilic molecules self assembly in nanoscopic aggregates.
[35] A. Jordan, P. Wust, R. Scholz, B. Tesche, H. F¨ahling, T. Mitrovics, T. Vogl, J. Cerv´os-Navarro, and R. Felix, Int. J. Hyperthermia12, 705 (1993).
[36] F.L.S. Cuppo and A.M. Figueiredo Neto, Langmuir18, 9647 (2002).
[37] W.C. Preston, J. Phys. Colloid Chem.52, 84 (1948). [38] P.G. de Gennes,The Physics of Liquid Crystals(Clarendon
Press, Oxford, 1975).
[39] Y. Galerne and J.P. Marcerou, Phys. Rev. Lett. 51, 2109 (1983).
[40] F.L.S. Cuppo, A.M. Figueiredo Neto, S.L. G ´omez, and P. Palffy-Muhoray, J. Opt. Soc. Am. B19, 1342 (2002). [41] F.L.S. Cuppo, S.L. G´omez, and A.M. Figueiredo Neto, Phy.
Rev. E67,051711 (2003).
[42] J.R.D. Pereira, A.J. Palangana, A.M. Mansanares, E.C. da Silva, A.C. Bento, and M.L. Baesso, Phys. Rev. E61, 5410 (2000).


![Figure 5. Experimental Z-scan curves of LLCs in the isotropic phase (KL[27 . 041], DeOH [6](https://thumb-eu.123doks.com/thumbv2/123dok_br/18979999.456686/5.892.83.416.596.844/figure-experimental-scan-curves-llcs-isotropic-phase-deoh.webp)