Nonlinear optical properties of ionic magnetic
colloids in the femto- and millisecond time scales:
change from convergent-to-divergent lens-type
behaviors
Diogo Soga and Sarah Alves
Instituto de Física, Universidade de São Paulo, Caixa Postal 66318, 05315-970 São Paulo, São Paulo, Brazil
Alex Campos and Francisco Augusto Tourinho
Instituto de Química, Universidade de Brasília, Caixa Postal 04478, 70919-970 Brasília, Distrito Federal, Brazil
Jerôme Depeyrot
Instituto de Física, Universidade de Brasília, Caixa Postal 04455, 70919-970, Brasília, Distrito Federal, Brazil
Antonio Martins Figueiredo Neto
Instituto de Física, Universidade de São Paulo, Caixa Postal 66318, 05315-970 São Paulo, São Paulo, Brazil
Received May 26, 2006; revised August 8, 2006; accepted August 29, 2006; posted September 6, 2006 (Doc. ID 71320); published December 20, 2006
The Z-scan technique is used to measure the nonlinear refractive indexn2and the nonlinear absorption
coef-ficientof ionic magnetic colloids as a function of the nanoparticles’ diameter共Drx兲in the femto- and millisec-ond time-scale regimes. A change from a convergent-lens type (at a femtosecmillisec-ond time scale) to a divergent-lens type behavior (at a millisecond time scale) is observed. From the values ofn2andmeasured in the
femto-second time-scale regime, the third-order susceptibility共3兲is calculated and is shown to depend onD
rx: the
smaller theDrx, the bigger the共3兲. A possible origin of the high values of共3兲found may be confining effects
related to the physical nanoscale of the magnetic particles. © 2006 Optical Society of America OCIS codes: 160.0160, 190.4400, 190.4720.
1. INTRODUCTION
Different mechanisms can produce nonlinear effects in a material, in particular, changes in its refractive index.1 Among the mechanisms responsible for these changes, we have the electronic polarization, molecular orientation, electrostriction, saturated and atomic absorption, ther-mal effects, and photorefractive effects. Each of these mechanisms has a typical time response, ranging from 10−15s (in the case of the electronic polarization) until
10−3s (in the case of thermal effects). These mechanisms
can be studied by measuring both the nonlinear refractive index共n2兲 and the nonlinear absorption coefficient共兲 of
the material. In particular, in the case of electronic pro-cesses, the third-order nonlinear optical susceptibility 共共3兲兲can be calculated from these measured values ofn2
and.
After the seminal work of Sheik-Bahaeet al.2proposing the Z-scan (ZS) technique, many works were published using it to investigate nonlinear properties of different materials. The ZS technique is used to measure bothn2
and, and the great advantage of it lies on a very simple setup where a Gaussian profile laser beam is focused by a lens, causing a variation on the beam intensity along the
zdirection. The sample, sensitive to the incident laser in-tensity, is moved through the focused beam path, and the transmitted beam intensity is detected by a photodetector placed behind an aperture. This technique can also be used to probe different nonlinear mechanisms, by adapt-ing the experimental setup to the desired time scale of the phenomenon.
One of the most interesting complex fluids, due to its remarkable physical–chemical properties, is the ferrofluid.3This complex fluid is a colloidal suspension of small magnetic particles (typical diameter of ⬃10 nm) dispersed in a liquid carrier (polar or nonpolar, depending on the particular characteristics of the magnetic parti-cles’s surface). The fluid is optically isotropic but, in the presence of a small magnetic field (e.g., ⬃102G) shows
field-induced birefringence and the formation of chains. Moreover, due to its high-magnetic susceptibility, flow properties are strongly dependent on the applied mag-netic field. Among the different ferrofluids, the ionics (named here as IF) are particularly interesting4: their magnetic particles are electrically charged, to avoid ag-gregation, and are dispersed in water. Besides their appli-cation in the doping of lyotropic liquid crystals,5 where
their role is to improve the mesophases orientation in small magnetic fields, biocompatible ferrofluids were shown to be a powerful tool in medical therapy.6
The nanoscale of the ferrofluid particles, which can be pictured as a dot-type confined system, allows for the in-teresting study of the nonlinear response of this medium under optical stimuli. The measured third-order nonlin-ear optical susceptibility of transition metal oxides (␣
-Fe2O3, TiO2,␥-Fe2O3, and Fe3O4) in a form of thin films
(i.e., a two-dimensional-type confined system) presented values as high as 10−12esu共␣-Fe
2O3兲(Ref. 7) to 10−10esu
共Fe3O4兲.8 These values are much bigger than those
roughly predicted by using Miller’s rule.9 For example, the predicted value of共3兲 of Fe3O4 is of the order of 3 ⫻10−13esu, 3 orders of magnitude smaller than the
mea-sured value. ZS experiments in the nanosecond time scale performed with Fe2O3-coated nanoparticles dispersed in
toluene and hydrosol10showed a nonlinear refractive in-dex of the order of −10−14cm2/ W, which gives 兩共3兲兩 ⬃10−12esu.
In this paper, we used the ZS technique in the femto-second (fs) and millifemto-second (ms) time scales to investigate the nonlinear properties of an IF (with uncoated par-ticles), associated to electronic and thermal mechanisms, respectively. The nonlinear refractive indices are mea-sured and the electric susceptibility is evaluated. The third-order nonlinear optical susceptibility of the ferrof-luid is compared with those of other confined systems. The paper is organized as follows: in Section 2, both the femtosecond and millisecond formalisms used are pre-sented; in Section 3, the details about the samples and the setups are given, followed by results and discussion in Section 4, and finally the conclusions in Section 5.
2. THEORETICAL BACKGROUND
A. Femtosecond Time-Scale Regime
The induced electric polarization of a medium with inver-sion symmetry, illuminated by a monochromatic Gauss-ian laser beam with electric fieldEand frequencyw, can be written as:P共3兲共w兲=o⌾共3兲共w;w, −w,w兲EE*E, whereo is the permittivity of free space. The nonlinear refractive indexn2and the nonlinear absorption coefficient , in a system whose response is local both in space and time, are defined as:n共I兲=no+n2I, and␣共I兲=␣o+I, wheren共I兲 is the refractive index,␣共I兲 is the absorption coefficient, andIis the irradiance (or the intensity),noand␣oare the linear index of refraction and absorption, respectively. It is important to notice that, in this time scale (femtosec-onds),n2has an electronic origin. The real and imaginary
parts of the third-order susceptibility are written as
Re共3兲= 2no2ocn2关m2/V2兴, 共1兲
Im共3兲=no2oc2

w 关m
2/V2兴, 共2兲
wherecis the velocity of light in vacuum andwis the fre-quency of the light. In a ZS experiment, the far-field on-axis irradianceI共z兲 is measured as a function of sample position共z兲. For a sample where the nonlinear absorption is small, the on-axis normalized transmittance ⌫N as
function of the sample positionz is given approximately by2,11
⌫N共z兲 ⯝1 −
⌬⌽o4x
共1 +x2兲共9 +x2兲−
⌰2共x2+ 3兲
共1 +x2兲共9 +x2兲, 共3兲
where⌬⌽ois the on-axis nonlinear phase shift at focus,x is the dimensionless sample position x=z/zo, ⌰=IoLeff,
and zo=o
2/ is the Rayleigh range of the Gaussian
beam with waist o. The nonlinear phase shift ⌬⌽o is given by
⌬⌽o= −
2n2LeffIo
, 共4兲
where is the wavelength, Leff=L共1 −e−␣oL兲/␣ois the ef-fective sample thickness, L is the actual sample thick-ness, andIois the on-axis intensity at the focus. The pa-rameter ⌰ can be measured from the ZS experiments where all the transmitted light (not only the on-axis con-tribution) is measured by the detector. More details will be given in Section 3. In this case, Eq. (3) is written as
⌫N共z兲 ⯝1 − 1
2
⌰
1 +x2. 共5兲
B. Millisecond Time-Scale Regime
The nonlinear response of a colloidal medium in the mil-lisecond time-scale regime is studied on the framework of the generalization of the thermal lens model.12,13 Let us briefly summarize the key points of this analysis. In the time-resolved version of the ZS experiment, a mechanical chopper provides a square-wave light intensity profile, which exhibits a periodical succession of on and off states of equal⌬t duration. During an on period, nonlinear ef-fects appear, and temperatureThas enough time to reach a steady state in the sample. Conversely, during an off pe-riod, no nonlinear effects take place, and the temperature increase has time enough to decay. The sample positionz
is fixed during a sequence of one on state and one off state. The experiment consists in measuring the sample transmitted intensity关⌫共z,t兲兴as a function of time during the on period, at each (fixed) sample position z. The re-fractive indexn共r,t兲 of the colloidal medium depends on the colloidal particles volume-fraction, the temperature
T, and the incident light intensityI. All these parameters are functions of the radial distance to the beam axisrand the timet. The variation of the index of refraction␦n共r,t兲 can be expressed as the sum of terms arising from the temperature change␦T共r,t兲, the particle volume-fraction change ␦共r,t兲, and light intensity I共r,t兲 in the sample, due to the incident beam: ␦n共r,t兲=关n/T兴␦T共r,t兲
+关n/兴␦共r,t兲+关n/I兴I共r,t兲. Assuming that in this time
scale␦→0, i.e., the Soret matter lens has no time to be formed,13one has␦n共r,t兲=关n/T兴␦T共r,t兲+n2†I共r,t兲, where
⌫共z,t兲= ⌫⬘
1 − 2x
冋
CN共1 +x2兲2+
CT
1 +x2 t
t+ 2tc
册
+共1 +x2兲
冋
CN 共1 +x2兲2+CT
1 +x2 t
t+ 2tc
册
2, 共6兲
with CN=共8PLzon2†兲/共o
4兲 and C
T=关共n/T兲共Lzo␣oP兲兴/ 共o2兲, where ⌫
⬘
is the sample transmitted intensity when the sample is at兩z兩Ⰷzo, at any timet艋 ⌬t,Pand are the incident power and the thermal conductivity of the sample, andtc=共o2关1 +x2兴兲/ 8D, withDas the heat dif-fusivity of the sample. The normalized transmitted inten-sity⌫N共z兲is defined in Eq. (7) and shows a typical peak– valley ZS curve behavior, with a peak-to-valley amplitude defined by Eq. (8):⌫N共z,t→0+兲=
⌫共z,t→0+兲
⌫⬘ =⌫N共z兲, 共7兲
⌬⌫pvtheo=⌫N共z=zp兲−⌫N共z=zv兲, 共8兲
where t→0+is the time corresponding to the first mea-sured transmittance in an on period, zp and zv are the peak and valley positions in the ZS curve. This normal-ization is possible to be done since ferrofluids are strong absorbers, and the nonlinear effects are already present att→0+.14In this framework, Eq. (7) may be written as
⌫N共z兲=
1
1 − 2x
冋
CN共1 +x2兲2
册
+共1 +x2兲冋
CN
共1 +x2兲2
册
. 共9兲
3. EXPERIMENTAL
A. Samples
The ferrofluid samples investigated are acid materials 共pH= 2兲, with CoFe2O4 magnetic particles positively
charged, dispersed in water. They are labeled IFi 共i= 1 →4兲, as a function of the particles diameter (Drx in na-nometers, obtained by x-ray experiments): IF1⇒Drx = 11.6; IF2⇒Drx= 8.8; IF3⇒Drx= 7.5, and IF4⇒Drx= 4.5. The ionic water-based ferrofluids elaboration is carried out in three fundamental steps15: First, the ferrite nano-particle synthesis, then the chemical surface treatment, and finally the peptization of the particles in a stable aqueous colloidal dispersion. CoFe2O4oxide nanoparticles
are prepared using hydrothermal coprecipitating aqueous solutions of a Co共NO3兲2-FeCl3 mixture in an alkaline
medium.16After the coprecipitation step, the precipitate is washed in order to suppress the high ionic strength of the medium, and the particle surface is cleaned by a 共2 mol L−1兲 HNO
3 solution. Moreover, to obtain the
ther-modynamical stability of the particles, an empirical pro-cess is used: the precipitates are boiled with a 0.5 mol L−1
Fe共NO3兲3 solution. Then, the particles are conveniently
peptized in an acidic medium by adjustment of the ionic strength, resulting in a stable sol of high quality. The crystalline structure and the mean size of our magnetic nanoparticles were carried out from x-ray diffraction measurements performed on powder samples, at 25 ° C,
obtained after evaporation of the liquid carrier. The chemical composition of the synthesized nanoparticles was checked: the concentrations of Fe and Co ions were determined by inductively coupled plasma atomic emis-sion spectroscopy (ICP-AES). Then, the volume fractions of the magnetic materialof all precursor samples were deduced. In the following experiments, the precursor dis-persions were diluted in order to obtain samples whose volume fractions are sufficiently low共⬃1 %兲 to neglect the magnetic dipolar interaction between particles. In the ZS experiments, all the samples are encapsulated be-tween optical glass plates with dimensions 共20 mm
⫻10 mm⫻1 mm兲, with a Teflon spacer L= 24m thick. The values of are chosen by analyzing the transmit-tances and the sample response to the incident laser beam. minis the minimum volume fraction of the
mag-netic material, that gives a good signal-to-noise ratio in the ZS experiment, with the maximum available beam power.maxis the maximum volume fraction of magnetic
material that does not show thermal-induced hydrody-namic instabilities in the sample due to the laser heating, at the lowest value of the beam power. So, we chosemin ⬍ ⬍ max. All the measurements were performed at T
= 20 ° C.
B. Linear Optical Absorption and Linear Refractive Index
The linear optical absorption共␣o兲of the samples is mea-sured with a UV-2800 single beam scanning UV–Visible spectrophotometer (ats= 532 nm). The linear refractive index共no兲of the different samples (atr= 589 nm) is mea-sured using an Abbe refractometer (Carl Zeiss) with a temperature controlled device (thermal bath Brookfield TC 500 with 0.01 ° C accuracy).
C. Z-Scan Apparatus and Technique 1. Femtosecond Time-Scale Setup
A mode-locked Ti:sapphire laser共= 790 nm兲, pumped by a 5 W cw doubled frequency Nd: YVO4共p= 532 nm兲laser, is used in these ZS experiments. The pulse width is of 508.5 fs, and the irradiance on the sample ranges from 0.16 to 0.22 GW/ cm2. By using a pulse selector, the
fem-tosecond pulses are separated (peak-to-peak) in time by 240 ns (originally, without the pulse selector, the Ti:sap-phire pulse frequency is 82 MHz). A lens of focal distance
f= 88.3 mm, which provides a minimum waist of o = 27.3m, with a Rayleigh lengthzo= 2.97 mm, is placed before the sample. The sample is put in the beam path and is moved aroundz= 0, before and after the focal point, along thezaxis. The transmitted beam goes to the detec-tor and is recorded by an oscilloscope. The beam intensity
nonlinear characteristics of the sample arise mainly near
z= 0 due to high intensityI, and at far points, it is not no-ticeable. For the measurement of the nonlinear refractive index only the on-axis transmittance is measured. On the other hand, to measure the nonlinear absorption, a con-verging lens is placed after the sample to collect all the transmitted beam at the detector. The incident (peak) la-ser power used in each experiment isIo⬃1012W / m2.
2. Millisecond Time-Scale Setup
In the tiresolved version of the ZS experiment, a me-chanical chopper modulates the laser beam (Gaussian profile) providing a square-wave pulse, which exhibits a periodical succession of on and off states of equal⌬t du-ration. The sample positionzis fixed during a sequence of one on state and one off state. The experiment consists of measuring the sample transmitted intensity共⌫共z,t兲兲as a function of time during the on period at each (fixed) sample positionz. A cw doubled frequency Nd: YVO4 共
= 532 nm兲 laser is used in the ZS measurements. The la-ser beam is chopped (at 18 Hz) or controlled by a shutter for larger time intervals ⌬t and focused by a lens (focal distancef= 100 mm), which provides a minimum waist of
o= 20.3m, with a Rayleigh length zo= 2.43 mm. The time resolution in the experiment is⬃100s, and the ZS step used is⌬z= 0.5 mm. For each ZS measurement, the sample is placed in a chariot, which moves it along thez
axis of the laboratory frame, with its largest surface per-pendicular to the laser beam. Depending on the magnetic particle concentration, different incident beam powers are used in the experiments. A sketch of the experimental setup can be found in Ref. 12.
4. RESULTS AND DISCUSSION
A. Femtosecond Time-Scale Processes
Figure 1 shows typical on-axis [Fig. 1(a)] and total [Fig. 1(b)] ZS transmittances as a function ofzof the ionic IF2 magnetic colloid. Each point represents the average of five independent measurements. The solid curves repre-sent the best fits of Eqs. (3) and (5), respectively, to the experimental data. From these fittings, the parametersn2
andcan be obtained. Their values for the set of samples investigated are given in Table 1. The order of magnitude ofn2obtained in our experiment共10−11cm2/ W兲clearly
in-dicates that the mechanism responsible for this response is not thermal.1 This order of magnitude is ten times smaller than that found in chitosan/CdSe-ZnS quantum dot (QD) core-shell multilayer films (at the same wave-length), where the typical diameters of the CdS and ZnS QDs were ⬃4 nm, and the film thickness per bilayer ⬃8 nm.17
With our measured values of n2 and no 共=1.328± 0.002兲, it is possible to calculate the real part of the third-order nonlinear electric susceptibility of the samples using Eq. (1). These values are presented in Table 1. To check if we are really probing Re共3兲and not high-order susceptibilities, we performed the ZS experi-ment with three different incident (peak) laser powers:
Io= 3.87, 4.04, and 4.71 共⫻1011W / m2兲. The variation in the values ofn2obtained was smaller than 3% indicating
that our ZS experiment measures Re共3兲 and not
high-order susceptibilities. The sign ofn2is positive, indicating
a convergent-lens-type behavior at this time-scale regime. The order of magnitude offound in our experiments is⬃103cm/ GW. This order of magnitude is also the same
found in chitosan/CdSe-ZnS core-shell QD multilayer films. The value of  for this multilayer film is much larger than that in the bulk CdSe 共⬃6.4 cm/ GW兲. As likely as in the case of the multilayer QDs, confining ef-fects in our nanoparticles seem to be responsible for this order of magnitude of  found in our samples. We will
Table 1. Femtosecond ZS Experiment Resultsa
Label
n2 共10−11cm2/ W兲
 共103cm/ GW兲
Re共3兲 共10−17m2/ V2兲
Im共3兲 共10−18m2/ V2兲
IF1 2.1± 0.2 2.7± 0.1 2.0± 0.2 1.6± 0.4
IF2 2.4± 0.1 3.22± 0.06 2.2± 0.1 1.9± 0.5
IF3 2.7± 0.2 5.3± 0.6 2.6± 0.2 3.1± 0.9
IF4 3.5± 0.3 9.0± 0.5 3.2± 0.3 5 ± 1
a
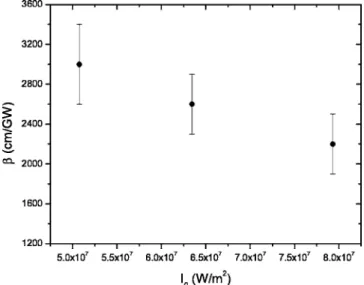
come back to this point in the following sentences. Differ-ent from the case ofn2, the same experiment performed at
different values of Ioshows a variation of about 30% in the value of , in the range of intensities investigated (Fig. 2). This fact indicates that, besides共3兲, high-order susceptibilities have been probed in our ZS experiment to determine. However, we can evaluate the order of mag-nitude of the imaginary part of共3兲 using Eq. (2) andw
= 2.386⫻1015Hz, being Im共3兲⬃10−18m2/ V2. This
prob-lem, in the determination of the Im共3兲by using the ZS technique and the procedure described here, is expected because when the total transmitted intensity is collected by the lens and measured by the detector, not only may we collect the contribution from the third-order suscepti-bility, but also we may collect the high-order contributions (if present). This fact limits the application of the ZS tech-nique for this particular measurement.18
The modulus of共3兲, evaluated from our data, is shown in Fig. 3, being of the order of 10−17m2/ V2(or, 10−9esu):
the smaller the magnetic particle diameter, the bigger the modulus of共3兲. It is interesting to compare these values with those of other confined systems. In the case of the sol–gel derived␣-Fe2O3,␥-Fe2O3, and Fe3O4thin films (a
two-dimensional-type confined system), 共3兲 are 5.8
⫻10−11esu, 2.1⫻10−11esu, and 4⫻10−10esu,
respectively.8 These are the highest values among inor-ganic oxides. In the case of the ␣-Fe2O3 and ␥-Fe2O3,
these high values were attributed to the pair excitation process while, in the case of the Fe3O4, it was attributed
to both one-photon and three-photon resonances. Fe2O3-coated nanoparticles dispersed in toluene and
hydrosol10presented 兩共3兲兩 ⬃10−12esu. In our IF colloidal
system, the magnitude of共3兲is 2 orders of magnitude big-ger than that of the␣-Fe2O3and␥-Fe2O3and, in the case
of the Fe3O4, 1 order of magnitude bigger. A possible
ori-gin of the high values of共3兲found in IF may be confining effects related to the physical nanoscale of the magnetic particles. This hypothesis is reinforced by the dependence of共3兲 with the particle’s diameter (Fig. 3). The IF shows the highest 兩共3兲兩 among other two-dimensional (thin films) and dot-type (coated nanoparticles) confined
sys-tems. Different from the case of the Fe2O3-coated
nano-particles, our particles are uncoated but are electrically charged.
B. Millisecond Time-Scale Processes
As pointed out at the end of Section 2, the data treatment proposed at this time scale is adequate to strong absorb-ers. To check the hypothesis that ferrofluids fulfill this condition, the linear light absorption coefficient共␣o兲of the different samples is measured, and the values are given in Table 2. These values (of the order of 102cm−1) support
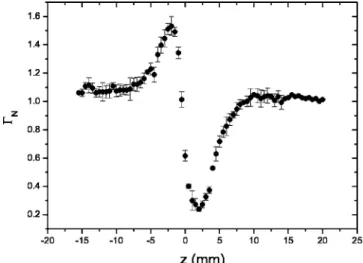
the theoretical framework used to analyze the ZS curves following the normalization procedure present in Eq. (7). Figure 4 shows typical on-axis ZS transmittance as a function ofzof the ionic IF2 magnetic colloid. Each point represents the average of five independent measure-ments. The data treatment to obtain the values ofn2†from the ZS curves is described in detail in Refs. 13 and 14. The dimensionless parameterCNis obtained by means of a master curve, and knowingP,L,zo, ando, we can cal-culaten2†. Within our accuracy, any nonlinear absorption is found in all the IF samples investigated (data not shown), in this time-scale regime.
Different, from the femtosecond time-scale regime,n2† ⬍0, its order of magnitude is 10−7cm2/ W, which is
char-acteristic of a thermal mechanism. n2† depends on the magnetic particle’s diameter: the smaller the Drx, the smaller the absolute value ofn2†(Fig. 5). The sign ofn2†is negative, indicating a divergent-lens-type behavior at this time-scale regime. Since the magnetic particles are strong absorbers at this wavelength, it is expected that they
in-Table 2. Millisecond ZS Experiment Resultsa
Label −n2†共10−7cm2/ W兲 ␣o共cm−1兲
IF1 2.76± 0.14 205.75± 0.32
IF2 2.30± 0.11 201.01± 0.45
IF3 1.80± 0.09 196.07± 0.51
IF4 1.46± 0.07 98.15± 0.11
a
Label of the investigated magnetic colloidal samples, nonlinear index of refrac-tion共n2†兲, and linear light absorption coefficient at 532 nm共␣o兲.
Fig. 2. Nonlinear optical absorptionas a function of the inci-dent (peak) laser powerIo. Water-based ionic sample IF2.
Fig. 3. Modulus of共3兲as a function of the magnetic particle’s
crease their temperature due to the laser-light absorption and transfer this heat to the fluid carrier, in this case, the water. This mechanism increases locally the sample tem-perature imposing a modification of its local density, origi-nating the divergent-lens-type effect. In this sense, the larger surface area of the larger particles favors the heat conduction from them to the carrier fluid (i.e., the water), which is responsible for the local density modifications of the sample under the laser illumination.
5. CONCLUSIONS
The Z-scan technique is used to measure the nonlinear re-fractive index and the nonlinear absorption coefficient of ionic magnetic colloids as a function of the nanoparticles’ diameter in the femto- and millisecond time-scale re-gimes. In the femtosecond regime, the magnetic colloids show a convergent-lens-type behavior, and, at this time scale, the processes responsible for the systems’ optical re-sponse are expected to be from electronic origin. Bothn2
and  were shown to depend on the particles’ diameter: the smaller the particle’s diameter, the bigger n2 and .
From these values, the third-order susceptibility 共3兲
could be calculated and showed the same type of behavior with respect to the magnetic nanoparticles’ diameter. A possible origin of the high values of共3兲found in ionic fer-rofluids may be confining effects related to the physical nanoscale of the magnetic particles. The ionic ferrofluid shows the highest 兩共3兲兩 among other two-dimensional (thin films) and dot-type (coated nanoparticles) confined systems. When the systems are investigated in the milli-second time-scale regime, the magnetic colloids show a divergent-lens-type behavior, and 兩n2†兩 is smaller for sys-tems with the smallest nanoparticle diameter. At this time scale, the processes responsible for the systems’ re-sponses are from thermal origin.
ACKNOWLEDGMENTS
We are in debt to FAPESP (Fundação de Amparo à Pes-quisa do Estado de São Paulo), CAPES (Fundação Co-ordenação Aperfeiçoamento de Pessoal de Nível Superior), and CNPq (Instituto do Milênio de Fluidos Complexos-IMFCx) for financial support. F. L. S. Cuppo’s help in the experimental setup is acknowledged.
A. M. Figueiredo’s e-mail address is [email protected].
REFERENCES
1. R. W. Boyd,Nonlinear Optics(Academic, 1992).
2. M. Sheik-Bahae, A. A. Said, and E. W. Van Stryland, “High sensitivity single-beam n2measurements,” Opt. Lett. 14,
955–957 (1989).
3. R. E. Rosensweig, Ferrohydrodynamics (Cambridge U.
Press, 1985).
4. R. Massart, “Preparation of aqueous magnetic liquids in
alkaline and acid media,” IEEE Trans. Magn. 17,
1247–1248 (1981).
5. A. M. Figueiredo Neto and S. R. A. Salinas,The Physics of Lyotropic Liquid Crystals: Phase Transitions and Structural Properties(Oxford U. Press, 2005).
6. J. W. M. Bulte, “Magnetic nanoparticles as markers for cellular MR imaging,” J. Magn. Magn. Mater.289, 423–427 (2005).
7. T. Hashimoto, T. Yoko, and S. Sakka, “Third-order
nonlinear optical susceptibility of ␣-iron (III) oxide thin film prepared by the sol–gel method,” J. Ceram. Soc. Jpn.
101, 64–68 (1993).
8. T. Hashimoto, T. Yamada, and T. Yoko, “Third-order
nonlinear optical properties of sol–gel derived␣-Fe2O3,␥
-Fe2O3, and Fe3O4thin films,” J. Appl. Phys.80, 3184–3190
(1996).
9. C. C. Wang, “Empirical relation between the linear and the third-order nonlinear optical susceptibility,” Phys. Rev. B2, 2045–2048 (1970).
10. B. Yu, C. Zhu, F. Gan, X. Wu, G. Zhang, G. Tang, and W. Chen, “Optical nonlinearities of Fe2O3 nanoparticles
investigated by Z-scan technique,” Opt. Mater.8, 249–254 (1997).
11. H. J. Yuan, L. Li, and P. Palffy-Muhoray, “Nonlinear birefringence of nematic liquid crystals,” Proc. SPIE1307, 363–373 (1990).
12. S. Alves, A. Bourdon, and A. M. Figueiredo Neto,
“Generalization of the thermal lens model formalism to account for thermodiffusion in a single-beam Z-scan Fig. 4. Typical ZS curve of the normalized transmittances in the
millisecond experiment, as a function of z. Water-based ionic sample IF2.
Fig. 5. Nonlinear refraction indexn2†as a function of the
experiment: determination of the Soret coefficient,” J. Opt. Soc. Am. B20, 713–718 (2003).
13. S. Alves, F. L. S. Cuppo, and A. M. Figueiredo Neto, “Determination of the nonlinear refractive index of lyotropic mixtures with and without the ferrofluid doping: a time-resolved Z-scan experiment in millisecond time scales,” J. Opt. Soc. Am. B23, 67–74 (2006).
14. S. Alves, A. Bourdon, and A. M. Figueiredo Neto,
“Investigation of the Soret coefficient in magnetic fluids using the Z-scan technique,” J. Magn. Magn. Mater.289, 285–288 (2005).
15. M. H. Sousa, J. Depeyrot, G. J. da Silva, M. C. F. L. Lara, and F. A. Tourinho, “New electric double-layered magnetic
fluids based on copper, nickel, and zinc ferrite
nanostructures,” J. Phys. Chem. B105, 1168–1175 (2001).
16. F. A. Tourinho, R. Franck, and R. Massart, “Aqueous
ferrofluids based on manganese and cobalt ferrites,” J. Mater. Sci.25, 3249–3254 (1990).
17. X. Wang, Y. Du, S. Ding, Q. Wang, G. Xiong, M. Xie, X. Shen, and D. Pang, “Preparation of third-order optical nonlinearities of self-assembled chitosan/CdSe-ZnS core-shell quantum dots multilayer films,” J. Phys. Chem. B
110, 1566–1570 (2006).
18. F. Yoshino, S. Polyakov, M. Liu, and G. Stegeman,
“Observation of three-photon enhanced four-photon
![Figure 1 shows typical on-axis [Fig. 1(a)] and total [Fig.](https://thumb-eu.123doks.com/thumbv2/123dok_br/16805633.750541/4.918.469.840.79.643/figure-shows-typical-axis-fig-total-fig.webp)