COMMUNITY STRUCTURE AND CARBONATE PRODUCTION OF A TEMPERATE
RHODOLITH BANK FROM ARVOREDO ISLAND, SOUTHERN BRAZIL
Douglas F. M. Gherardi
Instituto Nacional de Pesquisas Espaciais Programa HIDRO – DSR/OBT
(Av. dos Astronautas, 1758, 12227-010, São José dos Campos, SP, Brasil) e-mail: [email protected]
A
B S T R A C TA small (100,000 m2) rhodolith bank located at the Arvoredo Marine Biological Reserve (Santa Catarina, Brazil) has been surveyed to determine the main bank components, the community structure, and carbonate production rates. Data from five photographic transects perpendicular to Arvoredo Island shore were complemented with sediment samples and shallow cores, all collected by SCUBA diving. The main bank component is the unattached, nongeniculate, coralline red algae Lithophyllum sp., used as substrate by the zoanthid Zoanthus sp. Percentage cover of living and dead coralline algae, zoanthids and sediment patches account for nearly 98% of the investigated area. Classification and ordination of samples showed that differences in the proportion of live and dead thalli of Lithophyllum sp. determine the relative abundances of zoanthids. Results also indicate that similarity of samples is high and community gradients are subtle. Significant differences in percentage cover along transects are concentrated in the central portion of the bank. Low carbonate content of sediments from deeper samples suggests low rates of recruitment and dispersal of coralline algae via fragmentation. However, carbonate production of Lithophyllum sp ranging from 55-136.3 g m-2 yr-1 agrees with production rates reported for other temperate settings. In the long run, rhodolith density at Arvoredo Is. is likely to be dependent upon random dispersal of spores and/or fragments from other source areas.
R
E S U M OInvestigou-se um pequeno (100,000 m2) banco de rodolitos localizado na Reserva Biológica Marinha do Arvoredo (Santa Catarina, Brasil) para se determinar os pricipais componentes do banco, a estrutura da comunidade e a produção de carbonato de cálcio. Dados de cobertura relativa foram obtidos ao longo de cinco transectos fotográficos perpendiculares à ilha do Arvoredo, e complementados com amostras de sedimento superficial e testemunhos rasos. O principal componente do banco é a alga calcária não articulada, de vida livre, Lithophyllum sp., que é usada como substrato pelo zoantídeo Zoanthus sp. A cobertura relativa de algas vivas, mortas, zoantídeos e manchas de sedimento perfazem quase 98 % da superfície investigada. A classificação e ordenação das amostras mostrou que diferenças nas proporções de talo vivo e morto de Lithophyllum sp. determinam a abundância relativa de zoantídeos. Os resultados também indicam que a similaridade entre as amostras é alta e que gradientes da comunidade são sutis. Diferenças significativas da cobertura relativa ao longo dos transectos concentram-se na porção central do banco. A baixa concentração de carbonato de cálcio nos sedimentos mais profundos sugere baixo recrutamento por fragmentação. Entretanto, a taxa de produção de carbonato de cálcio determinada entre 55-136.3 g m-2 yr-1 encontra-se dentro da faixa observada para outros ambientes temperados. No longo prazo, a densidade de rodolitos da ilha do Arvoredo pode depender da dispersão aleatória de esporos e/ou fragmentos de outras áreas fonte.
Descriptors: Community structure, Rhodolith bank, Carbonate production. Descritores: Estrutura da comunidade, Rodolitos, Produção de carbonato.
I
NTRODUCTIONRhodolith beds are nodular aggregates of unattached, nongeniculate, coralline red algae that tend to occur in areas submitted to episodic wave or current movement (Adey, 1986). The observed range of morphological variability of coralline algae has long been interpreted as a response to environmental
They are able to colonize substrates from the low intertidal zone to depths of 150 m, and from the Arctic to the tropics (Foster, 2001).
In addition to growth form diversity and worldwide distribution, rhodoliths are capable of transforming homogeneous loose sediment bottoms into a heterogeneous, hard substrata, providing habitat for a number of other algae and invertabrates. It has been suggested (Steller et al., 2002) that rhodolith beds of high-density thally attain higher richness of epibenthic, crypto- and infaunal species than the adjacent sand community. For that reason, rhodoliths are considered important habitat structuring organisms.
Concentrations of rhodolith and maerl beds on the Brazilian continental shelf occur between the cities of Maceió and Fortaleza (Northeast Brazil, França et al., 1976), Espirito Santo state (Dias, 2000), and in the vicinities of Cabo Frio (Vicalvi & Milliman 1977). Recently, these concentrations have been considered the largest rhodolith bed distribution in the world (Foster, 2001). However, there is still much to be done in terms of a sistematic reconnaissance of the latitudinal distribution and community structure of rhodolith beds on the Brazilian continental shelf.
So far, there has been no published data on the ecology of coralline algae from the Marine Biological Reserve of Arvoredo. On the other hand, actions aiming at the conservation of these subtidal banks can only be effective with a proper knowledge of their composition, ecology and population dynamics. The first step towards conservation has to include a detailed record of regional occurrence of rhodoliths, so that it can be determined how much diversity of biological components has to be retained in a particular region. In the limit, this information is critical to address the following basic environmental management strategies (Carroll & Meffe, 1997): 1) maintenance of critical ecological processes and biodiversity composition, 2) minimization of external threats and maximization of external benefits, 3) conservation of evolutionary processes, and 4) adaptive and minimally intrusive management.
The present paper reports, for the first time, the composition and structure of a sessile epibenthic community from a temperate subtidal coralline algal bank located at the Marine Biological Reserve of Arvoredo, state of Santa Catarina, Brazil. Surface percent cover has been calculated for the main bank components along five parallel photographic transects running across the bank. Surficial sediment samples and shallow (< 30 cm) cores were also collected. Multivariate statistical analysis based on classification and ordination techniques was carried out to investigate community structure. Bank sedimentary facies were determined and carbonate production rates calculated for the dominant coralline algae.
M
ETHODSStudy Area
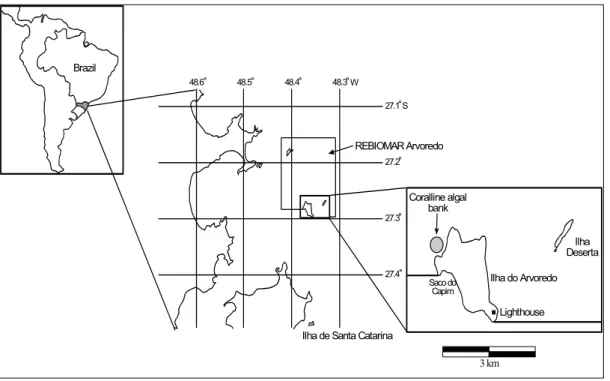
The coralline-algal bank from Arvoredo island (27°15'S, 48°25'W) is located within the Marine Biological Reserve of Arvoredo, protecting an area of 176,000 km2 (Fig. 1). It is located 6.5 km to the east from mainland, on the continental shelf of Santa Catarina state (Brazil) and includes several small islands. The region is characterized by an average surface water temperature ranging from 17°C during winter and 21°C during summer, and a rainy season from December to February with average annual precipitation of 1,500 mm (Nimer, 1989). Prevailing winds come from NE and N with an annual frequency of 21 % and 15 %, respectively (IBAMA, 1996).
The bank is dominated by the genus
Lithophyllum sp. but some specimens of
Neogoniolithon cf. strictum were also found. Genera were determined according to descriptions of morphological and anatomical features reported by Woelkerling (1988) and Woelkerling & Campbell (1992). This subtidal bank is formed by rhodoliths extending over a short stretch of sandy bottom in the NW shore of Arvoredo Is., between 7 and 20 m depth, covering an area of approximately 100,000 m2. The bank serves as refuge and food source for a complex biota formed by zoanthids (Zoanthus sp., Anthozoa, Hexacorallia), bivalves (mainly Chama sp. using the alga as a hard substrate), nestling ophiuroids, epifaunal attached bryozoans, sponges, serpulids, epiphytic algae, ascidians, and starfishes. This hard bottom community is presently dominated by a patchwork of living and dead corallines on top of which non-calcified zoanthids grow as isolated polyps or forming clusters of individuals on top of dead branched structures of coralline algae.
Field Sampling
Fig. 1. Location of the study area.
Semi-cryptic and cryptic biota such as encrusting bryozoans were only qualitatively determined by inspection of sampled rhodoliths. Paper prints measuring 13 x 18 cm were produced allowing the identification of objects up to 5 mm in diameter when analysed in the laboratory. A total of 90 photographs were obtained for all transects and distributed as follows: 8 photographs from transect T1; 19 from transect T2; 22 from transect T3; 20 from transect T4; and 20 from transect T5.
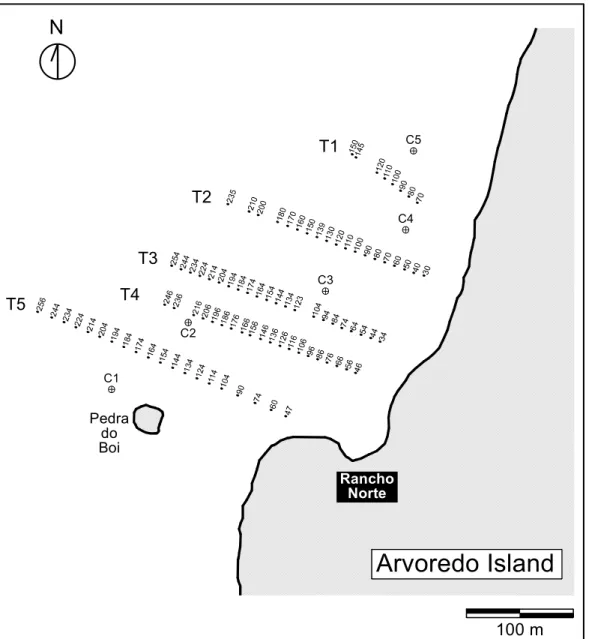
A total of 22 bulk sediment and coralline algae samples were also collected along the photographic transects keeping a minimum distance interval of 30 m. Identification of coralline algae was carried out using a Scanning Electron Microscope (SEM; Royal Holloway University of London, UK and LIT/Instituto Nacional de Pesquisas Espaciais, Brazil). Sediments were scooped, stored in polythene bags, and analysed for grain size distribution by sieving (Folk, 1980). Carbonate content of sediment samples were determined by weight difference after acid digestion of the carbonate fraction. Five shallow cores (Fig. 2) up to 30 cm long were collected within the coralline-algal bank at 9 m depth (C1 to C4) and 13 m depth (C5). All depth measurements were corrected for local mean low spring water level according to the tidal chart issued by the Diretoria de Hidrografia e Navegação (DHN), Brazilian Navy.
Laboratory Sub-sampling of Transect Photographs
Percent cover of organisms were calculated using a transparency overlay with 50 printed dots haphazardly distributed inside an area equal to the quadrat seen in the paper print. The following components were identified: living coralline algae, dead coralline algae, zoanthids, sponges, tufts of filamentous green algae, colonial ascidians, starfish, polychaete tubes, and sediment patches. The organism under each dot was recorded to the level of order or family and data from all transects were later organized in a spreadsheet for statistical analysis. Each transect was sampled with a different overlay so that sampling randomization could be maximized (Jongman et al., 1995). A rarefaction test procedure was carried out in some sub-sampled paper prints to establish the minimum number of points per print to be counted without loss of information. Results showed that 50 points is an optimum figure.
Classification and Ordination Analyses
Q-mode (sampling sites) and R-mode (species) cluster analysis (classification) and ordination techniques were performed to represent data structure and help elucidate intrinsic patterns within data sets (e.g. Liddell & Ohlhorst, 1987, 1988, Boss & Liddell 1987, Bak & Povel, 1989, Zenetos 1991, Stemann & Johnson, 1992, Clarke et al., 1993,
Brazil
REBIOMARArvoredo
IlhadeSantaCatarina
Sacodo Capim
IlhadoArvoredo Ilha Deserta
Lighthouse
3km
Corallinealgal bank 48.6 48.5 48.4 48.3
27.1
27.2
27.3
27.4
o o o o
o
o
o
o
W
Fig. 2. Location of photographic transects and sampling sites. Numbers are distance of samples (meters) from the island shore. Shallow cores are labeled from C1 to C5.
Tanner et al., 1994, Pachut et al., 1995, Patzkowsky, 1995). The multivariate techniques used here are part of the software PRIMER v. 4.0 beta (Plymouth Routines in Multivariate Ecological Research, UK). Techniques were selected according to the work of Clarke & Green (1988), Clarke (1993), Clarke & Ainsworth (1993), Clarke et al. (1993), Warwick & Clarke (1993), Gherardi & Bosence (2001). Data standardisation (each entry is divided by the species total and multiplied by 100) was carried out prior to Q-mode cluster analysis of species-samples matrix to
reduce disparities in percentage cover between the coralline-algal bank components. R-mode cluster analysis was carried out on units of variance of percentage cover to avoid the stairlike clustering of data. Bank components with cover below 6% were omitted because similarity between rare components have little ecological meaning. Rare components also tend to confuse and disrupt patterns in clustering and ordination analysis. Data transformation was not performed due to high similarity among transects, rendering dendrograms difficult to interpret. The
100 m
T1
T2
T3
T4
Pedra do Boi
Arvoredo Island
T5
C1
C2
C3
C4 C5
N
“Bray-Curtis” (B-C) (Clarke & Green, 1988; Clarke & Ainsworth, 1993; Jackson et al., 1996) similarity coefficient was applied to the standardised/normalised data to produce a triangular matrix of similarities in percentage cover between pairs of samples. This is used to discriminate sites/components from each other on the basis of their composition/cover, to cluster sites into groups that have similar communities and cluster organisms that tend to co-occur in similar ratios of surface cover across the transects.
The pairwise similarities matrix and a hierarchical agglomerative cluster analysis (i.e. classification) were used to link samples/species that have mutually high levels of similarity. The linkage option is the group-averaging method that is more balanced and produces a moderate number of medium-sized clusters that are only grouped at a later stage (Johnson & Wichern, 1992). Non-metric multidimensional scaling (MDS) ordination was applied to the rank similarity matrix to define and visualise community patterns. The graphical output of a MDS ordination is a “map” or configuration of samples in two dimensions. A measure of goodness-of-fit of the ordination is given by a stress value that should be < 0.15 to minimise misinterpretation. Classification and ordination of sedimentological data was carried out using Normalized Euclidean Distance and correlation-based Principal Components Analysis (PCA), respectively. Median, mean, sorting, skewness, kurtosis and carbonate content (% CaCO3) of sediments were used to establish the main sedimentary facies present in the study area.
Finally, one-way ANOSIM (Analysis of similarity; Clarke & Green, 1988) multivariate test (analogue to the global F test for ANOVA) was applied to the pairwise B-C similarities to look for significant differences between samples grouped by transects and sample depth. Global R and group R statistics are calculated based on the average of rank similarities among replicates within factors (transects and transects/depth), and the average of rank similarities arising from all pairs of replicates between different factors. Values of R close to unity rejects H0 (no differences between groups) and values approaching zero accepts H0. Randomization based on Monte Carlo test is used to generate significance levels, that must be interpreted as the percentage of pairwise R values as large as, or larger than the global R value.
Carbonate Production Rates
Carbonate production rates were calculated following Bosence (1980), and Freiwald & Henrich (1994), for eight Lithophyllum sp. branches collected from 10.5 and 8.5 m depth, along transect T4. Three factors precluded the use a larger number of samples:
a) most branches are too short to be sectioned, b) branches long enough to be sectioned presented too many dichotomies or were not straight, and c) a large proportion of the selected branches showed poor fourth order banding pattern under the SEM. Apart from the annual growth increment, the yearly added weight and the density of branched rhodoliths were also used to estimate carbonate production rates (see Freiwald & Henrich, 1994) and expressed in g yr-1 m-2. Straight, elongated branches were weighed and sectioned to count the bright-dark banding patterns visible under the SEM. Digital SEM images were digitally processed using an edge filter to highlight the banding pattern. The weight of rhodolith branches was divided by the number of banding patterns giving the maximum weight of annual carbonate precipitation. The number of branches per m2 was easily evaluated from photo-quadrats and carbonate production rates were estimated as g CaCO3 m-2 yr-1.
R
ESULTSThe majority of rhodoliths are spheroidal and densely branched (sensu Bosence, 1976) generally 10 cm in diameter. Small (around 5 cm diameter), densely branched spheroidal and ellipsoidal rhodoliths can be found in the shallow parts of the bank where currents are stronger and more frequent. Dome shaped structures of up to 20 cm in diameter were occasionally found in the central area of the bank, rising some 15 cm from the loose sediment bottom.
0 20 40 60
T1 T2 T3 T4 T5
Transects
A
v
erag
e p
erc
en
t co
v
er
Living Corallines Dead Corallines Zoanthids
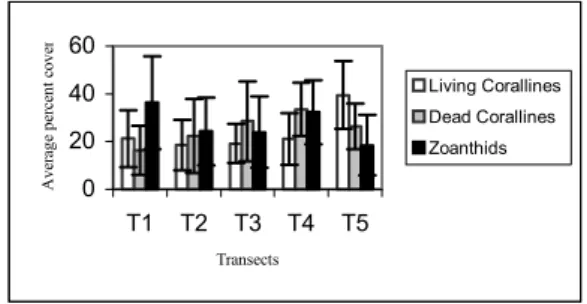
Fig. 3. Average percent cover and standard deviation bars for the main bank components in each transect.
0% 20% 40% 60% 80% 100%
Co
v
e
r (
%
)
10.6 11.6 11.6 19.6
Sample depth (m) Transect T1
Sediment patches
Zoanthids
Dead corallines
Living corallines
0% 20% 40% 60% 80% 100%
C
o
ve
r (%
)
7.4 8.4 9.2 9.4 11.4 11.9 12.9
Sample depth (m) Transect T3
Sediment patches
Zoanthids
Dead corallines
Living corallines
0% 20% 40% 60% 80% 100%
C
o
v
e
r (%
)
7 8 10 13.5
Sample depth (m) Transect T5
Sediment patches Zoanthids Dead corallines Living corallines
0% 20% 40% 60% 80% 100%
C
o
ve
r (%
)
9.5 9.5 11 11.5 12.5 12.5 15.5
Sample depth (m) Transect T2
Sediment patches
Zoanthids
Dead corallines
Living corallines
0% 20% 40% 60% 80% 100%
7.5 8.5 8.5 8.5 9 9 10.5
S a m p l e d e p t h ( m ) T r ansect T 4
Sediment parches
Zoant hids
Dead corallines
Living cor allines
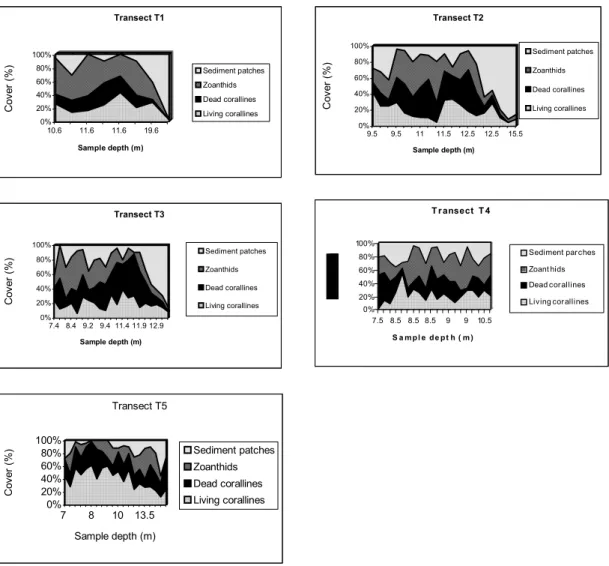
Fig. 4. Plots of sample depth vs. bank component abundance for transects T1 (4A) to T5 (4E). There is no clear pattern of abundance for bank components, except for the increase in abundance of sediment patches with depth.
The highest average (standard deviation) cover of living coralline algae was found along the southernmost transect (T5) with 39.5 % (14.18 %), whereas the mid section (T3) of the rhodolith bed showed the highest cover of dead coralline with 28.5 % (16.63 %) cover. Zoanthids are more abundant in the northern portion of the bank averaging 36.25 % (19.37 %) cover, and lowest cover was found along the southernmost portion (T5) with an average of 18,4 % (12.66 %). Percentage cover data are listed in Appendix A.
MultivariateAnalyses
Q-mode classification of samples from all transects resulted in noninformative clusters. Separate classification of samples from each transect resulted in clusters loosely grouping shallow, intermediate, deep,
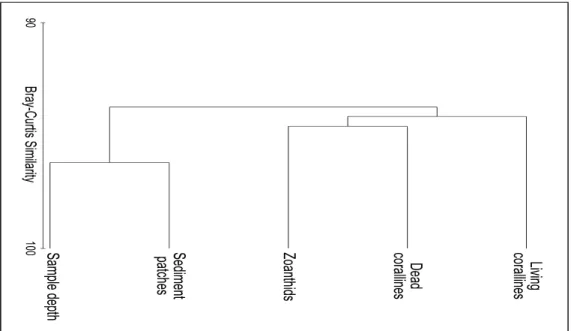
and mixed depth samples (not shown). The R-mode (bank components) (Fig. 5) dendrogram produced two clusters, one grouping sample depth and sediment patches, and another grouping dead coralline algae, zoanthids and living coralline algae.
similar distribution pattern with deepest samples having more bare sediment patches than intermediate depth samples.
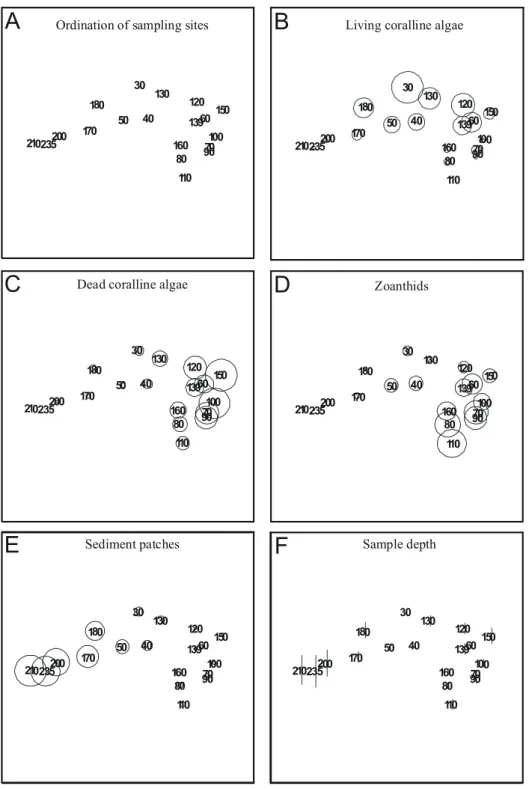
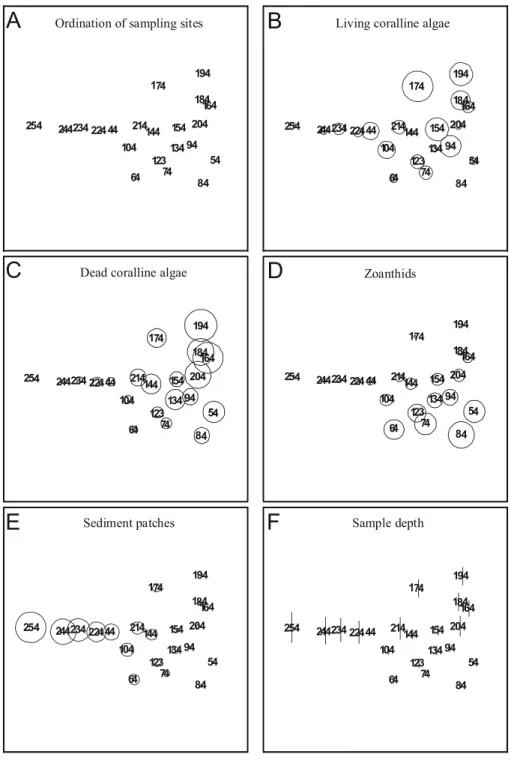
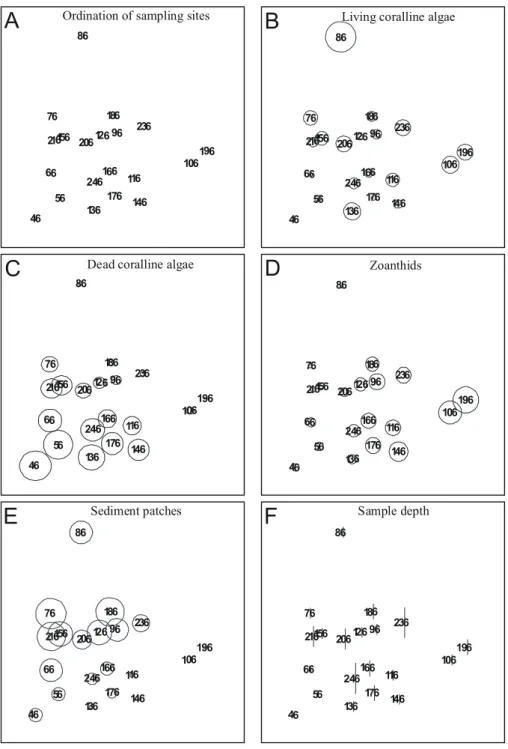
Separate MDS ordination of samples from each transect are used to identify local patterns of percent cover. Transect T1 data resulted in an noninformative MDS map due to high similarity between samples (not shown). If sampling sites are connected with a line to look for seriation breakdown it becomes evident that no clear-cut breakdown can be identified in any transect. Results from transects T2 (Figs 7A to F), T3 (Figs 8A to F), T4 (Figs 9A to F), and T5 (Figs 10A to F) show that living coralline algae are in general more abundant at intermediate to shallow depths, and overall percent cover decrease below 11m depth. The above trend can be clearly identified only in transect T2, T3 and T5, contrasting with a rather even distribution of living coralline algae along transect T4.
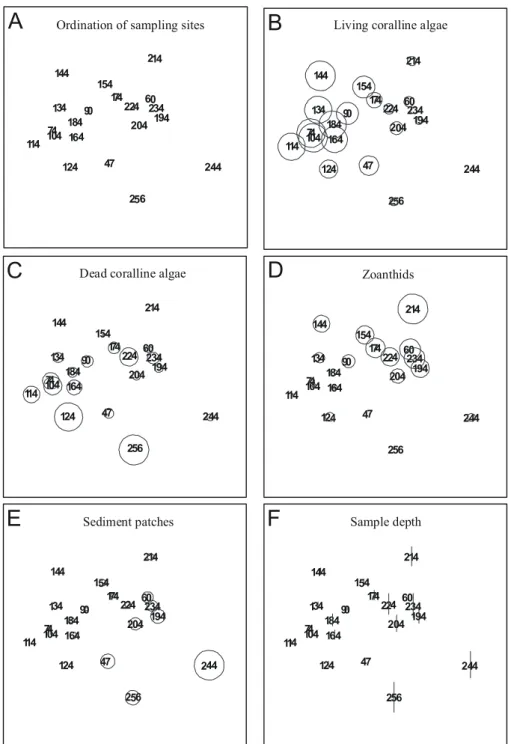
Ordination of samples from transect T2 also shows that high cover of dead coralline algae and zoanthids (Figs 7C and 7D) occur in the same area with a tendency to concentrate away from deeper areas (compare with Fig. 7F). Ordination of samples from transects T2 (Figs 7B and 7D), T3 (Figs 8B and 8D) and T5 (Figs 10B and 10D) shows that living coralline algae cover increases as zoanthid gradually decreases. Some samples from transect T4 (Figs 9B and 9D) also show a similar distribution of zoanthids percent cover, but this trend is less explicit.
Sediment patch percent cover (Figs. 7E to 10E) sharply decreases in samples shallower than 11 m depth in all transects but T4 (Fig. 9E). The average (standard deviation) percent cover of these patches increases towards the north of the bank ranging from 13.5 % (13.2 %) in T5, 20.5 % (10.4 %) in T4 to 27.1 % (23.7 %) in T3 and to 32.7 % (28.9 %) in T2 but decreases in T1 to 24.3 % (33.1 %), with an average of 23.5 % (22.3 %) for all transects.
Based on the above results an hypothesis has been tested in which significant differences among inner and outer bank samples are sought. The one-way ANOSIM test did not reject the null hypothesis of no differences between transects (global R=0.115, significance level of 0.1 %). However, the one-way ANOSIM test of samples grouped by depth and transect was more informative. Depth intervals of 0-9.9 m (shallow), 10-11.9 m (intermediate), and > 11.9 m (deep) were selected to achieve a balanced representation of depth ranges. The selection of depth ranges makes no reference to cluster results, hence avoiding circularity of argument. The global statistics for this second test (R=0.335, significance level of 0.1 %) give an indication that there may be some significant differences associated to depth and transects altogether. Table 1 summarizes results for pairwise (local) statistics.
Classification and PCA Ordination of Sedimentological Data
Normalized Euclidean Distance correctly classified three major groups of samples (Fig. 11A) and normalized (correlation based) PCA ordination (Fig. 11B) confirmed these groups and indicated the sediment parameters that contributed most to their separation. With this information it was possible to map the different sediment facies of the rhodolith bank (Fig. 11C). Facies A is made of fine sand with low carbonate concentration (5.4 to 8.7 % CaCO3) located in the deepest portion of transects T2 and T3 (samples A2, A3, A7, and A8) between 12.4 and 15.5 m depth. Facies B is a fine sand with high carbonate concentration (10.7 to 15.6 % CaCO3) that includes the shallowest samples of transects T2 and T3. Finally, Facies C is a medium sand with high carbonate
concentration (8.6 to 18.3 % CaCO3) accounting for all samples from transect T4 and sample A1 from transect T1.
Shallow Coring and Carbonate Production
Drilling of shallow cores (18 to 30 cm long) was carried out between 9 and 13 m water depth along a line roughly parallel to the shore (see Fig. 2), thus sampling almost the entire length of the coralline bank. Thickness of rhodolith bed vary from 10 cm (C4), 13 cm (C1), 18 cm (C3), to 20 cm (C5) and reach a maximum of 26 cm in core C2. Sediment texture range from medium to very coarse sand with a dominance of coarse and very coarse sand, characterized by a mixture of siliciclastic and carbonate grains.
Fig. 6. MDS ordinations of bank components from all samples. Each variable used in calculations (except sample depth) is superimposed as circles scaled according to measured variables. Ordination stress value is 0.11.
Living coralline algae
Dead coralline algae
B
A
C
D
E
F
Ordination of sampling sites Living coralline algae
Dead coralline algae Zoanthids
Sediment patches Sample depth
235 210 200
180
170
160 150 139 130
120
110 100 90 80
70 60 50 4
30
0
235 210 200
180
170
160 150 139 130
120
110 100 90 80
70 60 50 4
30
0
235 210 200
180
170
160 150 139 130
120
110 100 90 80
70 60 50 4
30
0
235 210 200
180
170
160 150 139 130
120
110 100 90 80
70 60 50 4
30
0
235 210 200
180
170
160 150 139 130
120
110 100 90 80
70 60 50 4
30
0 235
210 200 180
170
160 150 139 130
120
110 100 90 80
70 60 50 4
30
0
254 244234 224 44 214
64 104
144
123 74
84 134
54 94 154 204
164 184 194 174
254 244234 22444 214
64 104
144
123 74
84 134
54 94 154 204
164 184 194 174
254 244234 22444 214
64 104
144
123 74
84 134
54 94 154 204
164 184 194 174
254 244234 22444 214
64 104
144
123 74
84 134
54 94 154 204
164 184 194 174
254 244234 22444 214
64 104
144
123 74
84 134
54 94 154 204
164 184 194 174
254 244234 224 44 214
64 104
144
123 74
84 134
54 94 154 204
164 184 194 174
Ordination of sampling sites Living coralline algae
Dead coralline algae Zoanthids
Sediment patches Sample depth
B
A
C
D
E
F
46 56 66
136 246
176 166
146 116
106 196 236
96 126 206
186 86
216156 76
46 56 66
136 246
176 166
146 116
106 196 236
96 126 206
186 86
216156 76
46 56 66
136 246
176 166
146 116
106 196 236
96 126 206
186 86
216156 76
46 56 66
136 246
176 166
146 116
106 196 236
96 126 206
186 86
216156 76 46
56 66
136 246
176 166
146 116
106 196 236
96 126 206
186 86
216156 76
46 56 66
136 246
176 166
146 116
106 196 236
96 126 206
186 86
216156 76
Ordination of sampling sites Living coralline algae
Dead coralline algae Zoanthids
Sediment patches Sample depth
B
A
C
D
E
F
114 104 74
164 184 134
144 154
174 224
204 90
124 47
256
244 194
234 60
214
114 104
74 164 184 134
144 154
174 224
204 90
124 47
256
244 194
234 60
214
114 104
74 164 184 134
144 154
174 224
204 90
124 47
256
244 194
234 60
214
114 104
74 164 184 134 144
154 174
224
204 90
124 47
256
244 194
234 60
214
114 104
74 164 184 134
144 154
174 224
204 90
124 47
256
244 194
234 60
214
114 104
74 164 184 134 144
154 174
224
204 90
124 47
256
244 194
234 60
214
Living coralline algae
Dead coralline algae Zoanthids
Sediment patches Sample depth
B
A
C
D
E
F
Ordination of sampling sites
Table 1. Results of ANOSIM test for significance of differences among shallow, intermediate and deep samples from transects, including pairwise statistics. ns, non-significant.
Pairwise tests Local R (significance %)
T1 T2 T3 T4 T5
Shallow vs. intermediate ns ns 0.52 (0.1) ns ns
Intermediate vs. deep ns 0.62 (0.2) 0.79 (0.8) ns ns
Shallow vs. deep ns ns 0.55 (0.1) ns 0.49 (<0.1)
Fig. 11A. Classification of sediment samples based on median, mean, sorting, skewness, kurtosis, and carbonate content. See text for details.
Maximum weight (mean, SD) of annual carbonate precipitation is 1.09 mg yr-1 with a minimum of 0.44 mg yr-1 (0.82, 0.21). The calculated carbonate production is supported by a good correlation (r=0.8, Pearson correlation test) between branch weight and number of annual
bands, significant at the 0.05 level. The number of Lithophyllum sp. branches was evaluated from sampled rhodoliths and ranges from 100,000 to 125,000 per m2. The annual production rate yielded a minimum of 55 g CaCO3 m-2yr-1 and a maximum of 136.3 g CaCO3 m-2 yr-1 (102.5, 26.25).
Group A Group B
Fig. 11B. PCA of sediment samples showing three basic sedimentary facies determined from normalized grain size data and carbonate content.
Fig. 11C. Sediment sampling sites and diagramatic representation of sedimentary facies determined by PCA analysis.
Facies A
Facies B
Fa
c
i
e
s
C
A2 A3
A4 A6
A5 A1
A7 A8
A10
A14
A9 A11A12 A15
A18 A16
A17A19
A13 A20
A21
A22
PC1
1 0 0 m P e d ra
d o B o i
R a n c h o N o rte
F a c ie s A - F in e s a n d fa c ie s w ith 5 .4 to 8 .7 % C a C O3
F a c ie s B - F in e s a n d fa c ie s w ith 1 0 .7 to 1 5 .6 % C a C O3
F a c ie s C - M e d iu m s a n d fa c ie s w ith 8 .6 to 1 8 .3 % C a C O3
A rv o re d o Is la n d
D
ISCUSSIONThe different proportions of live and dead thalli of Lithophyllum sp. influence the relative abundances of zoanthids on the bank. MDS maps (Figs 7 to 10) show that zoanthids tend to occur in areas with low percent cover of living coralline algae and sediment patches (see also Fig. 5). Field evidence suggests that zoanthids recruit preferentially on hard substrates, where they attain high abundances (see Fig. 6) and form aggregations of several polyps. In contrast, zoanthids growing on sand were not observed to form clusters, occurring only as isolated polyps. This points out to a possible strategy whereby zoanthids grow preferentially on dead coralline thalli, as a result of the effectiveness of live thalli in avoiding fouling by most epibionts (Breitburg, 1984).
Figueiredo et al. (1997) have shown that live crusts of the crustose coralline algae Phymatolithon lenormandii, and P. purpureum discouraged epiphytes. In their experiment, dead crusts and replicas of crusts became more infested, both in the laboratory and on the shore. Mechanical (Keats et al., 1993, 1994; Masaki et al., 1984) and chemical (Itoh et al., 1987) antifouling mechanisms have also been reported for different coralline algal species. Building on the MDS results and those reported by Figueiredo et al. (1997), a mechanism for space occupation by zoanthids is proposed. Rhodolith shading caused by neighbouring nodules may cause death to some coralline branches, facilitating the recruitment of zoanthid sexual propagules. Following recruitment and establishment of a new zoanthid individual, space occupation is achieved by lateral stoloniferous (clonal) growth over substratum (see Karlson, 1988). This could have generated the spatial pattern observed in the Arvoredo Is. bank, where rows of zoanthids develop along the contact surfaces between neighbouring rhodoliths.
There is also evidence that low light penetration and high current velocity act in different parts of the bank as limiting factors for the development of coralline algae in Arvoredo Is. Along the innermost border of the bank (close to the island), limits to bank growth are imposed by intense water flow as observed during diving work. Incrustation plates tied to the bottom at that site were found totaly buried by sand after six months of exposure. This suggests that such environment is not suitable for rhodolith development, as it may not be able to cope with prevailing high sedimentation rates and/or strong currents. In contrast, low water motion and light penetration in the outmost border (deeper areas) seem to be the main limiting factors to the offshore expansion of the rhodolith bank.
Rhodolith beds can develop from spore settling or branch fragmentation, the latter being
mostly associated with hydraulic energy (Foster, 2001). The increasing proportion of sediment patches towards the deeper portions of the rhodolith bank (Fig. 6), and the low carbonate content of these sediments (facies A, Fig. 11C) suggest low rates of recruitment and dispersal of coralline algae via branch fragmentation. It is possible that in the long run, rhodolith density at Arvoredo Is. may depend upon random dispersal of spores and/or fragments from other source areas. Local divers reported the occurrence of small concentrations of coralline-algal nodules at Ilha Deserta, 2 km to the east of Arvoredo. This points to a possile connectivity of the rhodoliths from Arvoredo with other local coralline populations. The fact that the studied rhodolith bank is very small (circa 100,000 m2) makes it extremely vulnerable (see Engel and Kvitek, 1998), and the exchange of propagules among isolated banks is likely to contribute to the persistence of local populations (Caley et al. 1996; Hanski, 1997; Dethier et al., 2003; Bascompte et al., 2002).
The first insight gained with the statistical analyses is that similarity of samples is high and community gradients are subtle. This may arise when random differences occur across the rhodolith bank (see Fig. 4), which may reflect low functional diversity (range of species traits in a habitat) and/or low diversity of feeding relationships (Holt & Loureau, 2002). ANOSIM statistics indicate that no significant differences can be found within transects T1 and T4, the small number of samples for T1 deemed results non-significant. From a total of 88 possible combinations of samples utilized by the ANOSIM procedure (100,000 permutations), only 16 (18.2 %) pairwise tests combined high R with low (< 0.5 %) significance level. Significant differences were found between shallow and intermediate depth samples (transect T3), intermediate and deep samples (transects T2 and T3), and shallow and deep samples (transect T3 and T5, Table 1). Depth certainly exerts some influence on the way bank components interact. Whether this influence is not strong enough to enhance differences or species interactions act to minimize these differences (stabilize?) it is not possible to ascertain.
Carbonate Production of Rhodolith Beds
Phymatolithon calcareum (Bosence, 1980) from Ireland.
Carbonate production rates of Arvoredo Is. are one order of magnitude lower than Norwegian framework constructing algae production rates of 900-1400 g m-2 yr-1 reported by Freiwald and Henrich (1994). These authors have compared carbonate production from different climatic settings and concluded that unattached algae living in temperate water are slower growing than branching and/or encrusting reef framework constructing algae from subtropical to subarctic. Despite the expected differences in carbonate production between Arvoredo Is. and Arctic coralline algae, the number of branches per square meter at comparable depths (7-18 m) are very similar, yielding 100,000 to 125,000 and 50,000 to 150,000 per m2, respectively.
There is still some debate (Foster, 2001) on the reliability of growth rate estimates based on counts of branch bands as reported in the scientific literature. It has been suggested (Foster, 2001) that more field experiments are needed to determine diferences in seasonal growth rates (Rivera et al., 2004). Setting standard procedures for branch growth determination would also improve comparison of results worldwide.
C
ONCLUSIONS1) The studied rhodolith bank is very small (circa 100,000 m2) and this fact alone makes it an extremely vulnerable habitat.
2) Zoanthids tend to occur in areas with low percent cover of living coralline algae and sediment patches. 3) Similarity of percent cover of the main bank components is high and community gradients are subtle. There are, however, significant differences between shallow and intermediate depth samples along transect T3; between intermediate and deep samples along transects T2 and T3; and between shallow and deep samples along transects T3 and T5.
4) Low carbonate content of sediments collected from the deeper portion of the bank suggests low rates of recruitment and dispersal of coralline algae via branch fragmentation.
5) Three sedimentary facies were identified: a) facies A is a fine sand facies with low carbonate concentration located in the deepest portion of transects T2 and T3; b) facies B is a fine sand facies with high carbonate concentration that includes the shallowest samples of transects T2 and T3; and c) facies C which is a medium sand facies with high carbonate concentration accounting for all samples from transect T4 and T1.
6) Carbonate production of the rhodolith bank from Arvoredo Is. lies within the production range reported for other rhodolith beds from temperate settings.
A
CKNOWLEDGEMENTSI wish to thank Gil R. Strenzel, Gisele G. Alarcon and Mônica A. de M. Gomes for helping with field and laboratory work. Norberto O. H. Filho (UFSC) is also thanked for supervising the sedimentological analyses. Lucas D. da Silva and Luiz R. de Oliveira from Homem-Rã (Canasvieiras, SC) are specially thanked for their logistical support. My sincere thanks to Cláudia Z. F. Braga (deceased), and Marcio L. Vianna from INPE for their commitment to the project. Sampling permits and logistical support were provided by the Marine Biological Reserve of Arvoredo (sampling permits no. 48/97 and 82/98I). This work was supported by Fundação O Boticário de Proteção à Natureza and The John D. and Catherine T. MacArthur Foundation (grant no. 0304972).
R
EFERENCESAdey, W. H. 1986. Coralline algae as indicators of sea level. In: van de Plassche, O. ed. Sea-Level Research: a manual for the collection and evaluation of data. England, Geo Books. p. 229-280.
Bak, R. P. M. & Povel, G. D. E. 1989. Ecological variables, including physiognomic-structural attributes, and classification of Indonesian coral reefs. Neth. J. Sea Res., 23:95-106.
Bascompte, J.; Possingham, H. & Roughgarden, J. 2002. Patchy populations in stochastic environments: critical number of patches for persistence. Am. Nat., 159:128-137.
Bosence, D. W. J. 1976. Ecological studies on two unattached coralline algae from western Ireland. Palaeontology, 19:365-395.
Bosence, D. W. J. 1980. Sedimentary facies, production rates and facies models for recent coralline algal gravels, Co. Galway, Ireland. Geol. J., 15:91-111.
Bosence, D. W. J. 1985. The morphology and ecology of a mound-building coralline alga (Neogoniolithon strictum) from the Florida keys. Palaeontology, 28:189-206. Boss, S. K. & Liddell, W. D. 1987. Back-reef and fore-reef
analogs in the Pleistocene of North Jamaica: implications for facies recognition and sediment flux in fossil reefs. Palaios, 2:219-228.
Breitburg, D. L. 1984. Residual effects of grazing inhibition of competitor recruitment by encrusting coralline algae: Ecology, 65:1136-1143.
Caley, M. J.; Carr, M. H.; Hixon, M. A.; Hughes, T. P.; Jones, G. P. & Menge, B. A. 1996. Recruitment and the local dynamics of open marine populations. Ann. Rev. Ecol. Syst., 27:477-500.
Carrol, C. R. & Meffe, G. K. 1997. Management to meet conservation goals: general principles. In: Meffe, G. K. & Carrol, C. R., eds. Principles of conservation Biology. Massachusetts, Sinauer Associates p. 347-384.
Clarke, K. R. & Ainsworth, M. 1993. A method of linking multivariate community structure to environmental variables. Mar. Ecol. Prog. Ser., 92:205-219.
Clarke, K. R. & Green, R. H. 1988. Statistical design and analysis for a “biological effects” study. Mar. Ecol. Prog. Ser., 46:213-226.
Clarke, K. R.; Warwick, R. M. & Brown, B. E. 1993. An index showing breakdown of seriation, related to disturbance, in a coral-reef assemblage. Mar. Ecol. Prog. Ser., 102:153-160.
Dethier, M. N.; McDonald, K. & Strathmann, R. R. 2003. Colonization and connectivity of habitat patches for coastal marine species distant from source populations. Conserv. Biol., 17:1024-1035.
Dias, G. T. M. 2000. Granulados biclásticos-algas calcárias. Braz. J. Geophys., 18:307-318.
Engel, J. & Kvitek, R. 1998. Effects of otter trawling on a benthic community in Monterey Bay National marine Sanctuary. Conserv. Biol. 12:1204-1214.
Figueiredo, M. A. de O.; Norton, T. A. & Kain, J. M. 1997. Settlement and survival of epiphytes on two intertidal crustose coralline alga. J. expl. mar. Biol. Ecol., 213:247-260.
Folk, R. L. 1980. Petrology of sedimentary rocks. Texas, Hemphill Publishing Company. p. 184.
Foster, M. S.; Harrold, C. & Hardin, D. D. 1991. Point vs. photo quadrat estimates of cover of marine organisms. J. expl. mar. Biol. Ecol., 146:193-203.
Foster, M. S. 2001. Rhodoliths: between rocks and soft places. J. Phycol., 37:659-667.
França, A. M. C.; Coutinho, P. N. & Summerhayes, C. P. 1976. Sedimentos superficiais da margem continental nordeste brasileira. Rev. Bras. Geoc., 6:71-88.
Freiwald, A. & Henrich, R. 1994. Reefal coralline algal build-ups within the Artic Circle: morphology and sedimentary dynamics under extreme environmental seasonality. Sedimentology, 41:963-984.
Gherardi, D. F. M. & Bosence, D. W. J. 1999. Modeling of the Ecological Succession of Encrusting Organisms in Recent Coralline-Algal Frameworks from Atol das Rocas, Brazil. Palaios, 14:145-158.
Gherardi, D. F. M. & Bosence, D. W. J. 2001. Composition and community structure of the coralline-algal reefs from Atol das Rocas, South Atlantic, Brazil. Coral Reefs, 19:205-219.
Hanski, I. A. 1997. Metapopulation dynamics: from concepts and observations to preditive models. In: Hanski, I. A. & Gilpin, M. E. eds. Metapopulation biology. Ecology, genetics, and evolution. San Diego, Academic Press. p. 69-91.
Holt, R. D. & Loureau, M. 2002. Biodiversity and ecosystem functioning: the role of trophic interactions and the importance of system openness. In: Kinzig, A. P.; Pacala, S. W. & Tilman, D. eds. The functional consequences of biodiversity. Monographs in population biology 33, New Jersey, Princeton University press, p. 246-262.
IBAMA. 1996. Macrodiagnóstico da zona costeira do Brasil na escala da União. Brasília, Instituto Brasileiro do Meio Ambiente e dos Recursos Naturais Renováveis. 280 p.
Itoh, N.; Hasan, A. K. M.; Izumi, I. & Yamada, H. 1987. Immunological properties of bromoperoxidases in coralline algae. Biochem. Int. 15:27-33.
Jackson, J. B. C.; Budd, A. F. & Pandolfi, J. M. 1996. The shifting balance of natural communities? In: Jablonski, D.; Erwin D. H. & Lipps J. H. eds. Evolutionary Paleobiology. Chicago, University of Chicago Press. p. 89-122.
Johnson, R. A. & Wichern, D. W. 1992. Applied multivariate statistical analysis. New Jersey, Prentice Hall. p. 1-642. Jongman, R. H. G.; Ter Braak, C. J. F. & Van Tongeren, O.
F. R. 1995. Data Analysis in Community and Landscape Ecology. Cambridge. Cambridge University Press. 299p. Karlson, R. H. 1988. Size-dependent growth in two zoanthid
species: a contrast in clonal strategies. Ecology, 69:1219-1232.
Keats, D. W.; Groener, A. & Chamberlain, Y. M. 1993. Cell sloughing in the litoral zone coralline algae, Spongites yendoi (Foslie) Chamberlain (Corallinales, Rhodophyta). Phycologia, 32:143-150.
Keats, D. W.; Wilton, P. & Maneveldt, G. 1994. Ecological significance of deep-layer sloughing in the eullitoral zone coralline alga, Spongites yendoi (Foslie) Chamberlain (Corallinales, Rhodophyta) in South Africa. J. expl. mar. Biol. Ecol., 175:145-154.
Liddell, W. D. & Ohlhorst, S. L. 1987. Patterns of reef community structure, North Jamaica. Bull. Mar. Sci., 40:311-329.
Liddell, W. D. & Ohlhorst, S. L. 1988. Hard substrata community patterns, 1-120 M, North Jamaica. Palaios, 3:413-423.
Masaki, T.; Fujita, D. & Hagen, N. T. 1984. The ultrastructure of epithallium shedding of crustose coralline algae in an "isoyake" area of southwestern Hokkaido, Japan. Hydrobiologia, 117:219-223.
Nimer, E. 1989. Climatologia do Brasil. Rio de Janeiro, Fundação Instituto Brasileiro de Geografia e Estatística - IBGE. 421 p.
Pachut, J. F.; Cuffey, R. J. & Kobluk, D. R. 1995. Depth-related associations of cryptic-habitat bryozoans from the leeward fringing reef of Bonaire, Netherlands Antilles. Palaios, 10:254-267.
Patzkowsky, M. E. 1995. Gradient analysis of middle Ordovician brachiopod biofacies: biostratigraphic, biogeographic, and macroevolutionary implications. Palaios, 10:154-179.
Rivera, M. G.; Riosmena-Rodriguez, R. & Foster, M. S. 2004. Age and growth of Lithothamnion muelleri (Corallinales, Rhodophyta) in the southwestern Gulf of California, Mexico. Ciencias Marinas, 30:235-249. Schaeffer, T. N.; Smith, G. J.; Foster, M. S. & DeTomaso, A.
2002. Genetic differences between two growth-forms of Lithophyllum margaritae (Rhodophyta) in Baja California Sur, Mexico. J. Phycol., 38:1090-1098. Stemann, T. A. & Johnson, K. G. 1992. Coral assemblages,
biofacies, and ecological zones in the mid-Holocene reef deposits of the Enriquillo Valley, Dominican Republic. Lethaia, 25:231-141.
Tanner, J. E.; Hughes, T. P. & Connell, J. H. 1994. Species coexistence, keystone species, and succession: a sensitivity analysis. Ecology, 75:2204-2219.
Warwick, R. M. & Clarke, K. R. 1993. Comparing the severity of disturbance: a meta-analysis of marine macrobenthic community data. Mar. Ecol. Prog. Ser., 92: 221-231.
Woelkerling, W. J. 1988. The Coralline Red Algae: an analysis of the genera and subfamilies of nongeniculate Corallinaceae BM(NH). Oxford, Oxford Press. 268 p. Woelkerling, W. J. & Campbell, S. J. 1992. An account of
southern Australia species of Lithophyllum (Corallinaceae, Rhodophyta). Bull. Br. Mus. nat. Hist., Botany series, 22:1-107.
Zenetos, A. 1991. Re-evaluation of numerical classification methods for delimiting biofacies and biotopes in an estuarine environment. Lethaia, 24:13-26.