A MICROCOSM APPROACH ON THE POTENTIAL EFFECTS OF THE VERTICAL
MIXING OF WATER MASSES OVER THE PRIMARY PRODUCTIVITY AND
PHYTOPLANKTON BIOMASS IN THE SOUTHERN BRAZILIAN COASTAL REGION
Flávia Marisa Prado Saldanha-Corrêa & Sônia Maria Flores Gianesella
Instituto Oceanográfico da Universidade de São Paulo (Praça do Oceanográfico, 191, 05508-900 São Paulo, SP, Brazil)
A
B S T R A C TThe vertical mixing between South Atlantic Central Water (SACW) and Coastal Water (CW) was simulated through microcosm experiments using the autochthonous phytoplankton community (fraction < 150 µm), without nutrient enrichments. SACW is cold (T< 18°C) and nutrient rich, while CW is warmer (T> 20°C) and oligotrophic. The phytoplankton growth potential of SACW, CW and an equivalent mixture of both (SACW+CW) was compared, under 100, 30 and 10% of sunlight, at surface seawater temperature, in winter and summer conditions. Results demonstrate the importance of SACW as a natural eutrophication agent for the mixing layer, allowing the occurrence of new production by nutrient input, and also as a biological seeder through the development of its autochthonous phytoplankton community when it reaches the euphotic zone. The time lag for phytoplankton development during winter was around 4-5 days, against 1-2 days in summer. The hypothesis of physiological differences between surface and bottom phytoplankton populations from a deep (80 m) and thermally homogeneous water column (common winter feature) was also tested through the microcosm experiments. Results obtained clearly demonstrate that bottom water presented higher phytoplankton growth potential than the surface one.
R
E S U M OA mistura vertical entre a Água Central do Atlântico Sul (ACAS) e a Água Costeira (AC) foi simulada através de experimentos tipo microcosmos, com o fitoplâncton autóctone (fração < 150 µm) e sem enriquecimentos nutricionais. A ACAS é fria (T< 18°C) e rica em nutrientes, enquanto a AC é mais quente (T> 20°C) e oligotrófica. O potencial trófico dessas águas e de uma mistura equivalente de ambas (ACAS+AC) foi comparado a 100, 30 e 10% da luz solar, sob temperatura da água do mar na superfície, em condições de inverno e verão. Os resultados demonstram a importância da ACAS como agente fertilizador da camada de mistura tanto por introduzir nutrientes, favorecendo a ocorrência de produção nova, como pelo incremento da biomassa fitoplanctônica autóctone ao atingir a zona eufótica. A fase de adaptação observada no inverno foi de 4-5 dias enquanto no verão foi de 1-2 dias. A hipótese da existência de diferenças fisiológicas entre as populações fitoplanctônicas de superfície e fundo em uma coluna de água profunda (80 m) e termicamente homogênea (padrão comum de inverno) foi também testada utilizando microcosmos. Os resultados mostraram que potencial de crescimento fitoplanctônico nas águas de fundo foi significativamente maior que nas de superfície.
Descriptors: Vertical mixing, Phytoplankton, Primary production, SACW, Nutrients, Microcosms, Physiological stratification, Southwest Atlantic.
Descritores: Mistura vertical, Fitoplâncton, Produção primária, ACAS, Nutrientes, Microcosmos, Estratificação fisiológica, Atlântico Sudoeste.
I
NTRODUCTIONThe Southeastern Brazilian coastal region is dominated by three water masses: Coastal Water (CW), South Atlantic Central Water (SACW) and Tropical
__________
Contr. no. 861 do Inst. oceanogr. da Usp.
Water (TW). CW and TW are present in the upper layers and SACW remains close to the continental slope during autumn until the early spring. In late spring and summer, SACW floods the bottom layers of the continental shelf, favored by NE winds, and sometimes reaches the euphotic zone (Emílsson, 1961; Matsuura, 1986; Castro Filho et al., 1987; Pires-Vanin
masses are: CW 24°C, 34.9; SACW 13°C, 35.4 and TW 24°C, 37.0 (Castro Filho et al. op. cit.). SACW possess high nutrient availability followed, in decreasing order, by CW and TW (Aidar et al.,
1993).
Several studies carried out at the Southwest Atlantic report the importance of SACW seasonal advection in introducing new nutrients into the mixing layer, thus, promoting phytoplankton biomass increase (Matsuura, 1986; Valentin et al., 1986; Brandini, 1988a,b; Ciotti et al., 1995; Moser & Gianesella, 1997; Rocha et al., 1998; Gaeta et al., 1999; Saldanha-Corrêa, 1999) and potentially supporting higher fish stocks (Moreira da Silva, 1971; Pires-Vanin et al., 1993). The mixing layer off Ubatuba is generally nutrient depleted and regenerative processes maintain the low phytoplankton biomass, represented almost exclusively by pico- and nanoflagellates (Aidar et al., 1993). The episodic occurrence of physical phenomena such as cyclonic eddies (Mascarenhas et al., 1971; Castro Filho et al., 1987), coastal upwelling (Émilsson, 1961; Maglioca et al., 1979) and shelf break fronts (Mesquita et al., 1983 & Brandini, 1990) reported in this area, should have a great impact on the phytoplankton standing stock in the euphotic layer.
Although the importance of SACW as a natural fertilizer has been well recognized, no studies had yet quantified its contribution. The present work proposes to evaluate the chemical and biological potential of SACW in increasing phytoplankton biomass and primary productivity rates, based on microcosms experiments. The SACW vertical advection and its mixture with CW (which dominates the upper layers of the inner continental shelf) were simulated in winter and summer conditions.
As a complementary study, microcosms filled with water taken from surface and bottom layers of a deep and physically homogeneous water column, common winter condition, were followed aiming to verify possible differences in phytoplankton community development from both depths.
M
ATERIAL ANDM
ETHODSNatural seawater was collected off Ubatuba region (Lat. 23°30´S - Long. 45°06´W), Northern coast of São Paulo State, Brazil, from subsurface (CW) and bottom layers (SACW), according to the temperature profile. In the winter experiment (July/88) the sampling point was on the 135 m isobath, in the outer shelf, and in summer (January/89), with the SACW proximity to the coast, water samples were
taken at the inner shelf, over the 45 m isobath. In the microcosms conducted in July/ 89, referred from this point as c-winter (common winter), the water was collected over the 80 m isobath, in a physically homogeneous water column, from 5 and 75 m depth.
In all periods, 45 l of water were taken from both depths using Van Dorn bottles, and transferred to two 50 l plastic carboys after being filtered through a 150 µm mesh nylon net, to remove large zooplankters. From these carboys, samples for inorganic nutrients, Chl and phytoplankton counts were taken immediately to characterize initial conditions for each water mass. The carboys were kept in the dark at room temperature until the beginning of the experiment, which occurred no longer than 20h later. Every material used for sampling and incubations was previously washed according to Miller et al. (1978).
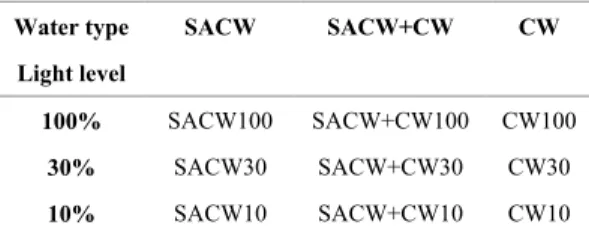
Experimental design for winter and summer included 9 microcosms, disposed in 10 l borosilicate bottles (Table 1a). These bottles were filled with nine liters of seawater in the following manner: 3 with SACW, 3 with CW and 3 with a mixture of equal parts of both (SACW+CW). To match the vertical advection of the deep SACW and its mixture with CW, one bottle of each water type (CW, SACW and CW+SACW) was submitted to 100, 30 and 10 % of total sunlight radiation (attenuation levels obtained by putting the bottles inside neutral filter bags). Aeration inside the microcosms was provided by bubbling filtered air through a pipette in the middle portion of the bottle. The microcosm-bottles received cotton stoppers, which were covered by plastic hoods. No nutrient was added to any microcosm and they were kept in an outdoor tank placed at the pier in the coastal laboratory of Instituto Oceanográfico da Universidade de São Paulo, in Ubatuba.
Table 1a. Experimental design used in winter and summer microcosms.
Water type
Light level
SACW SACW+CW CW
100% SACW100 SACW+CW100 CW100
30% SACW30 SACW+CW30 CW30
10% SACW10 SACW+CW10 CW10
light attenuation levels were the same from the previous experiments (Table 1b). The incubation periods were 8 days in winter, 15 days in summer and 14 days in the c-winter.
Table 1b. Experimental design used in c-winter microcosms.
Water type
Light level
Surface Bottom
100% S100 B100
30% S30 B30
10% S10 B10
In the three experimental series, the outdoor incubation tank was maintained under a continuous surface seawater circulation and the water temperature was monitored through 5 daily systematic readings of a thermometer kept inside the tank. The daily registers from an R-Fuess actinograph, which data were converted to µE m-2 s-1 units, monitored the photosynthetic active radiation (PAR).
Microcosms were sampled daily at 9 a.m. when aliquots of 300 ml were taken from each one and transported in the dark to the lab, where primary production incubations by 14C method
(Steemann-Nielsen, 1952) were immediately conducted. Also, samples for total chlorophyll-a (Chl) and its active fraction (acChl), phytoplankton counts and inorganic nutrients were obtained. For primary production measurements, a sub-sample of 100 ml of each microcosm was inoculated with 1 ml of NaH14CO
3 (20 µCi ml-1) and, from this mixture, aliquots of 30 ml were transferred to 3 borosilicate incubation bottles (2 light and one dark) and put in a BOD-like chamber under 400 µE m-2 s-1 halogen lamp light. Temperature was maintained close to the mean values registered in the outdoor tank. After 4h incubation, carbon uptake was ended by filtering the samples onto Millipore filters (0.45 µm pore), which were disposed in scintillation vials containing 7 ml of scintillation liquid (Bray, 1960). DPM was measured with a scintillation spectrometer Packard 1600. Carbon uptake (mgC m-3 h-1) was computed according to Strickland & Parsons (1968).
Samples for Chl determination were filtered onto GF/F Whatman and the filtrate water was used to nutrient determination. These samples were stored at -20°C in the dark until the processing. Pigment analyses from extracts in acetone 90% were done in a Turner 111 by the fluorescence method of Lorenzen (1966), which discriminates the Chl-a
fraction able to photosynthesize, referred as "active Chl" (acChl), from phaeophytin-a, fraction that lost the photosynthetic capability. The sum of these two fractions (acChl + phaeophytin) indicates the total Chl-a (Chl). Photosynthetic carbon assimilation was determined by the ratio PP/acChl expressed in mgC (mgChl h) -1.
Dissolved inorganic nitrogen (DIN) represents the sum of nitrate, nitrite and ammonium, which were analyzed according to Aminot & Chaussepied (1983). Phosphate and silicate analyses were conducted according to Grasshoff et al. (1983), but silicate results were not presented since its concentration tended to increase with the time, probably due to the washout from the borosilicate glass walls of the incubation bottles.
Phytoplankton samples were fixed in buffered formalin (0.4% final concentration) and counts were done according to Uthemöhl (1958), in an inverted microscope Zeiss at 625X amplification. At least 400 cells were counted per sample in order to keep the error between 10 and 20% (Lund et al., 1958). Taxa identification was based on Cupp (1943), Wood (1968) and Chrétiennot-Dinet (1977).
To compare the results, time series of Chl, acChl, cell density (cell) and primary productivity (PP) were normalized by the time zero (t0) value of the
respective microcosms growth curve. The non-dimensional variables derived from these computations were reported as Chl/Chl0,
acChl/acChl0, cell/cell0 and PP/PP0,
Specific growth rates (µ), were computed as:
µ =
t t
t
t
B
B
t
t
1
1
ln
1
++
−
where B represents the biomass related variables: Chlt/Chl0, acChlt/acChl0, cellt/cell0, and t the day of
incubation.
Nutrient assimilation rates were computed according to Aidar et al. (1991) as:
V(t) = - +
X N X dt dN 1
µ
where dN/dt is the temporal variation of nutrient concentration (in µM d-1), X is acChl concentration (µg l-1), µ is growth rate determined by changes in acChl (d-1), N nutrient concentration (µM). Thus, vDIN and vPO4
-3
indicating the daily assimilated nutrient mass per 1µg of acChl.
Several parameters derived from every microcosm growth curves were grouped in a matrix, in order to compare the results obtained in each experimental period. These parameters were: maximum value obtained for Chl/Chl0, acChl/acChl0,
PP/PP0, PP/acChl, cell/cell0, vDIN and vPO4-3
(vmaxDIN and vmaxPO4 -3
, respectively); time integrated values (represented by the brackets) of [Chl/Chl0],
[acChl/acChl0] and [PP/PP0]; maximum growth rates
(µmax) in terms of Chl/Chl0, acChl/acChl0 and cell/cell0
and mean growth rates in the exponential phase (µmean) for Chl/Chl0 and acChl/acChl0. Those data
were standardized and normalized before running cluster and discriminant analysis (using Statigraphics 5.1), aiming to point out the significant differences among the microcosms. Also, Pearson correlation was computed between pairs of those variables to verify significant linear relationships, denoted by P-values lower than 0.05 at 95% confidence level.
R
ESULTSWinter
The water representative of CW presented low concentrations of nutrients and phytoplankton biomass (Table 2). In the SACW, abundant DIN and low phosphate led to a N:P imbalance. Chl was extremely low (0.05 mg m-3) as the water was collected from the aphotic zone. In both waters, the phytoplankton community was represented mainly by picophytoflagellates (more than 80% in number of cells).
The temperature of flowing seawater in the outdoor incubation tank stayed around 18.3 ± 1.1° C, close to the in situ temperature of the CW. PAR daily average was 761.5 µE m-2 s-1 with higher variations occurring in days 4 and 5 (Table 3). In this first experimental series, the incubation period was planned to be 8 days, based on bibliographic references of similar experiments developed in Ubatuba, specially in the work of Teixeira et al. (1986) which reports a decline in natural phytoplankton population after 6 days of incubation, in microcosms without nutrient addition and at the same temperature range.
Phytoplankton development was monitored daily by in vivo fluorescence. However, this method failed to detect the small growth rates verified along the incubation period. When Chl analyses were done, results revealed that the experiment was ended when the microcosms were entering at the exponential
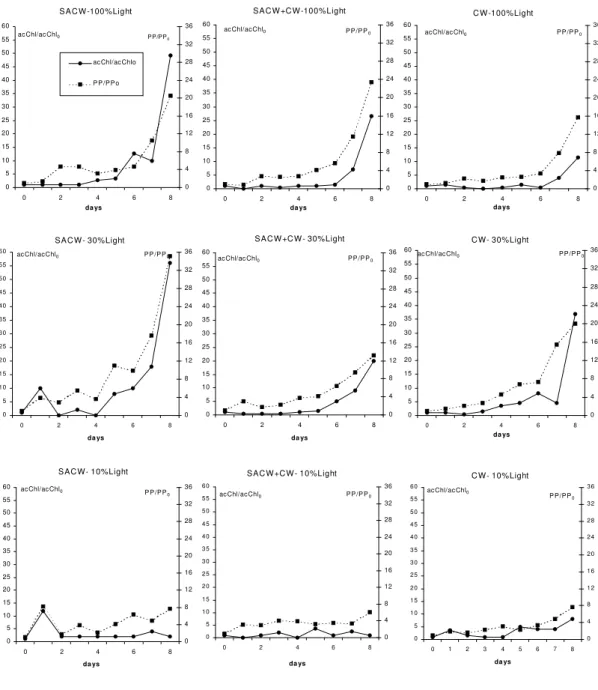
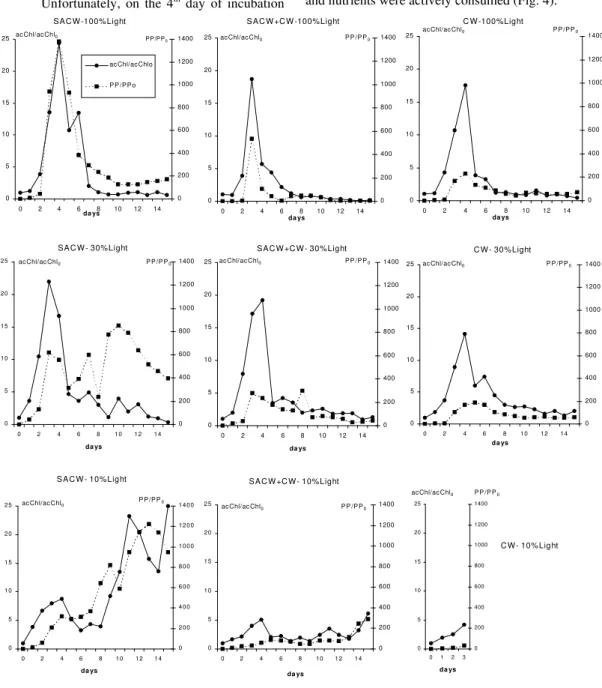
growth phase (Fig. 1). Consequently, complete phytoplankton development was not observed and certainly the maximum growth yield was not attained. So, the SACW fertilizer potential during winter conditions could not be properly evaluated. The most remarkable feature, independently of the water type or light attenuation level, was the long lag-phase observed: a minimum of 4 days.
Although the maximum growth had not been attained in any of the nine microcosms, some differences could be observed in the curves of acChl/acChl0 and PP/PP0. Microcosms at 10% light
level displayed the largest lag-phase. At 30% light, lag-phase is one day shorter than at 100% light level, varying between 4-5 days. SACW30 and SACW10 presented peaks of Chl and PP in the first day of incubation. Also, the initial slopes of the log-phase varied according to the water type: SACW100 and SACW30 microcosms displayed the highest slopes compared to the SACW+CW and CW at the same light levels, indicating that the SACW phytoplankton community was able to respond faster to favorable growth conditions, represented in this case to light availability. PP/PP0
curves followed closely the Chl/Chl0 ones, indicating
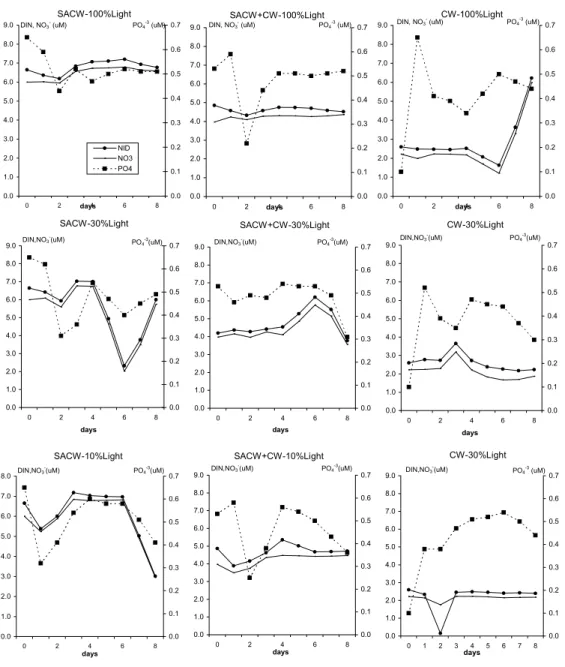
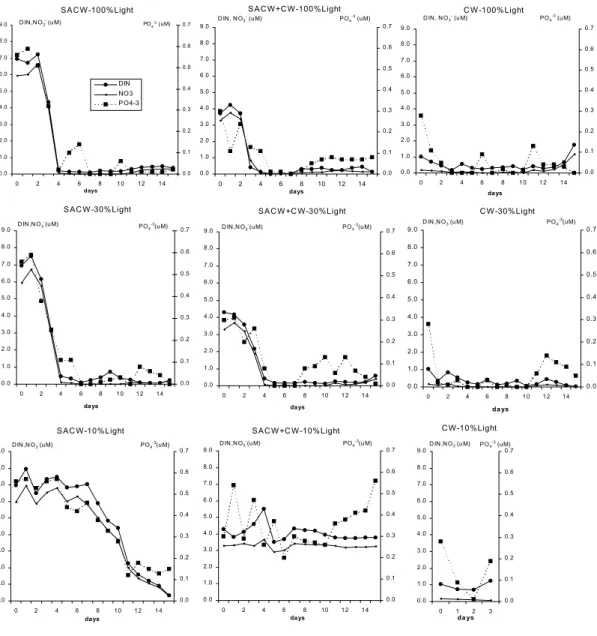
constancy in the assimilation rates per biomass units in all microcosms (Fig. 1). Inorganic nutrient concentrations in the nine microcosms did not show a common pattern (Fig. 2). Phosphate concentrations seemed to vary with small Chl increases in the second day and also at the end of the incubation, preceding the log-phase. Nitrate and DIN seemed to vary in some cases also preceding the log-phase. But, in all cases, no nutrient depletion was verified, indicating that the assayed waters still had chemical potential to develop a larger phytoplankton biomass.
Phytoplankton community was dominated by the picophytoflagellates (< 2 µm), which represented more than 80% of the total number of cells along the entire incubation period. It is interesting to note that, in the day 8 in the microcosms SACW100 and SACW30, diatoms became more abundant, representing respectively 22 and 10% of the total cell density, suggesting a possible diatom bloom development from this day. The main genera observed were Thalassiosira, Thalassionema
and Pseudo-nitzschia.
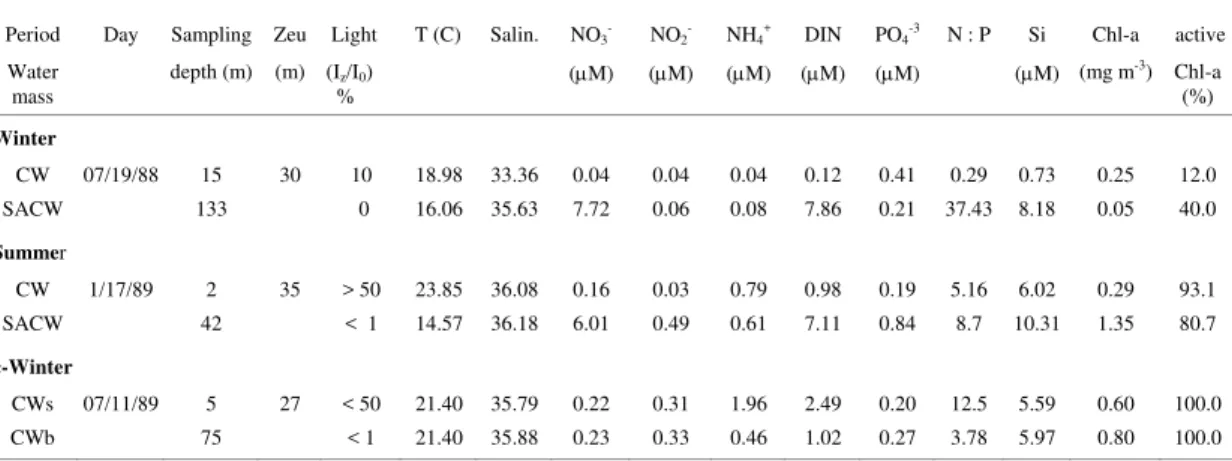
Table 2. Physical, chemical and biological characteristics of the water samples collected as representatives of CW and SACW for microcosm experiments, at the sampling time. (CWs and CWb indicate respectively the CW taken from surface and bottom layers).
Period Day Sampling Zeu Light T (C) Salin. NO3- NO2- NH4+ DIN PO4-3 N : P Si Chl-a active
Water
mass depth (m) (m) (I % z/I0) (μM) (μM) (μM) (μM) (μM) (μM) (mg m
-3) Chl-a
(%)
Winter
CW 07/19/88 15 30 10 18.98 33.36 0.04 0.04 0.04 0.12 0.41 0.29 0.73 0.25 12.0
SACW 133 0 16.06 35.63 7.72 0.06 0.08 7.86 0.21 37.43 8.18 0.05 40.0
Summer
CW 1/17/89 2 35 > 50 23.85 36.08 0.16 0.03 0.79 0.98 0.19 5.16 6.02 0.29 93.1
SACW 42 < 1 14.57 36.18 6.01 0.49 0.61 7.11 0.84 8.7 10.31 1.35 80.7
c-Winter
CWs 07/11/89 5 27 < 50 21.40 35.79 0.22 0.31 1.96 2.49 0.20 12.5 5.59 0.60 100.0
CWb 75 < 1 21.40 35.88 0.23 0.33 0.46 1.02 0.27 3.78 5.97 0.80 100.0
Table 3. Environmental variables monitored along the three microcosm series: daily average of seawater temperature in the incubation tank (°C), PAR (μE m-2s-1) and mean temperature in the incubation chamber during primary productivity
experiments.
Outdoor incubation temperature PAR (μE m-2s-1) PP incubation temperature
Day Winter Summer c-Winter Winter Summer c-Winter Winter Summer c-Winter
0 18.0 26.0 21.0 591.2 725.0 508.4 20.5 32.0 20.0
1 19.3 26.0 18.5 908.5 1095.9 516.3 19.5 26.0 20.0
2 19.6 28.0 19.5 808.8 825.1 503.0 20.5 23.5 20.5
3 20.0 28.0 21.0 824.5 941.8 526.7 23.5 23.5 22.0
4 18.0 27.0 19.5 405.6 654.3 388.2 21.5 19.0 21.0
5 17.5 27.0 20.0 1043.1 620.7 492.4 20.8 22.0 20.0
6 17.5 27.0 20.0 667.5 1038.8 477.2 19.5 25.0 20.0
7 16.8 27.0 21.0 842.9 1002.8 495.5 20.0 24.0 20.0
8 18.0 27.0 19.5 931.5 1167.0 560.4 21.5 24.0 20.0
9 27.5 20.5 950.3 579.2 25.0 22.0
10 28.0 21.0 950.3 544.1 21.0 20.0
11 27.0 21.0 1029.7 435.8 26.5 21.0
12 27.0 21.0 912.3 596.0 26.0 20.0
13 27.0 20.5 1033.7 196.7 25.0 21.0
14 27.0 20.5 901.3 131.8 25.0 20.5
15 27.0 245.5 24.5
Mean 18.3 27.1 20.3 761.5 923.2 487.1 20.8 24.5 20.5
St. Dev. 1.1 0.6 0.8 199.4 157.6 99.6 1.2 2.8 0.7
Maximum 20.0 28.0 21.0 1043.1 1167.0 596.0 23.5 32.0 22.0
S A C W -100%Light 0 5 10 15 20 25 30 35 40 45 50 55 60
0 2 4 6 8
da ys 0 4 8 12 16 20 24 28 32 36
ac Chl/ac Chlo
P P/P P o PP/PP0 ac Chl/ac Chl0
SA C W +C W -100%Light
0 5 10 15 20 25 30 35 40 45 50 55 60
0 2 4 6 8
da ys 0 4 8 12 16 20 24 28 32 36 P P /P P0 ac Chl/acChl0
C W -100%Light
0 5 10 15 20 25 30 35 40 45 50 55 60
0 2 4 6 8
da ys 0 4 8 12 16 20 24 28 32 36 P P /P P0 acChl/ac Chl0
S A C W - 30%Light
0 5 10 15 20 25 30 35 40 45 50 55 60
0 2 4 6 8
da ys 0 4 8 12 16 20 24 28 32 36 P P /P P0 ac Chl/acChl0
S A C W +C W - 30%Light
0 5 10 15 20 25 30 35 40 45 50 55 60
0 2 4 6 8
da ys 0 4 8 12 16 20 24 28 32 36 P P /P P0 acChl/ac Chl0
C W- 30%Light
0 5 10 15 20 25 30 35 40 45 50 55 60
0 2 4 6 8
da ys 0 4 8 12 16 20 24 28 32 36 P P /P P0 ac Chl/acChl0
S AC W - 10%Light
0 5 10 15 20 25 30 35 40 45 50 55 60
0 2 4 6 8
da ys 0 4 8 12 16 20 24 28 32 36 P P/P P0 ac Chl/ac Chl0
S AC W +C W - 10%Light
0 5 10 15 20 25 30 35 40 45 50 55 60
0 2 4 6 8
da ys 0 4 8 12 16 20 24 28 32 36 P P /P P0 ac Chl/acChl0
C W- 10%Light
0 5 10 15 20 25 30 35 40 45 50 55 60
0 1 2 3 4 5 6 7 8
da ys 0 4 8 12 16 20 24 28 32 36 P P/P P0 acChl/ac Chl0
Fig. 1. Temporal variation of active chlorophyll-a (acChl) and primary production rates (PP) normalized by the time zero value for each treatment (acChl/acChlo and PP/PPo), observed during the winter microcosms
Fig. 2. Temporal variation of dissolved inorganic nitrogen (DIN), nitrate (NO3-) and phosphate (PO4-3) in the nine microcosm
treatments performed during the winter microcosms (units in µM). Summer
At the time of the seawater sampling for summer microcosms, the water column was stratified,
presenting a thermal gradient of almost 10°C in 40 m of depth (Table 2). In CW, Chl and nutrients were low, indicating the oligotrophic condition usually detected in the mixing layer. On the other hand,
SACW-100%Light 0.0 1.0 2.0 3.0 4.0 5.0 6.0 7.0 8.0 9.0
0 2 days4 6 8
0.0 0.1 0.2 0.3 0.4 0.5 0.6 0.7 NID NO3 PO4 DIN, NO3
(uM) PO4
-3 (uM) SACW+CW-100%Light 0.0 1.0 2.0 3.0 4.0 5.0 6.0 7.0 8.0 9.0
0 2 days4 6 8
0.0 0.1 0.2 0.3 0.4 0.5 0.6 0.7 DIN, NO3
(uM) PO4
-3 (uM) CW-100%Light 0.0 1.0 2.0 3.0 4.0 5.0 6.0 7.0 8.0 9.0
0 2 days4 6 8
0.0 0.1 0.2 0.3 0.4 0.5 0.6 0.7 DIN, NO3- (uM) PO4-3 (uM)
SACW-30%Light 0.0 1.0 2.0 3.0 4.0 5.0 6.0 7.0 8.0 9.0
0 2 4 6 8
days 0.0 0.1 0.2 0.3 0.4 0.5 0.6 0.7 DIN,NO3 -(uM) PO 4 -3 (uM) SACW+CW-30%Light 0.0 1.0 2.0 3.0 4.0 5.0 6.0 7.0 8.0 9.0
0 2 4 6 8
days 0.0 0.1 0.2 0.3 0.4 0.5 0.6 0.7 DIN,NO3
-(uM) PO4
-3 (uM) CW-30%Light 0.0 1.0 2.0 3.0 4.0 5.0 6.0 7.0 8.0 9.0
0 2 4 6 8
days 0.0 0.1 0.2 0.3 0.4 0.5 0.6 0.7 DIN,NO3
-(uM) PO4
-3 (uM) SACW-10%Light 0.0 1.0 2.0 3.0 4.0 5.0 6.0 7.0 8.0
0 2 4 6 8
days 0.0 0.1 0.2 0.3 0.4 0.5 0.6 0.7 DIN,NO3
-(uM) PO4
-3 (uM) SACW+CW-10%Light 0.0 1.0 2.0 3.0 4.0 5.0 6.0 7.0 8.0 9.0
0 2 4 6 8
days 0.0 0.1 0.2 0.3 0.4 0.5 0.6 0.7 DIN,NO3
-(uM) PO4
-3 (uM) CW-30%Light 0.0 1.0 2.0 3.0 4.0 5.0 6.0 7.0 8.0 9.0
0 1 2 3 4 5 6 7 8
days 0.0 0.1 0.2 0.3 0.4 0.5 0.6 0.7 DIN,NO3
-(uM) PO4
-3
According to the preceding experience in winter, the incubation period was established to last 15 days to ensure that the complete phytoplankton growth would be observed. The mean temperature in the outdoor incubation tank was 27.1 ± 0.6 °C (Table 3), almost 4°C and 13°C higher than in situ temperatures of CW and SACW, respectively. Mean value of PAR was 923.2 μE m-2 s-1, typical for tropical latitudes.
Unfortunately, on the 4th day of incubation
the bottle of microcosm CW10 was broken and it was impossible to recover the water content. So, only the data up to day 3 are available for this microcosm.
Many differences were found in summer comparing to the winter. The more conspicuous was the reduced lag-phase observed in all microcosms: maximum of 2 days (against a minimum of 4 days in winter), high biomass yields were obtained (Fig. 3) and nutrients were actively consumed (Fig. 4).
SA C W -100%Light
0 5 10 15 20 25
0 2 4 6 8 10 12 14
da ys
0 200 400 600 800 1000 1200 1400
ac Chl/ac Chlo
P P /P P o PP/PP0 ac Chl/acChl0
S A C W +C W -100%Light
0 5 10 15 20 25
0 2 4 6 8 10 12 14
da ys
0 200 400 600 800 1000 1200 1400 P P /P P0 ac Chl/acChl0
C W-100%Light
0 5 10 15 20 25
0 2 4 6 8 10 12 14
da ys
0 200 400 600 800 1000 1200 1400 P P /P P0 ac Chl/ac Chl0
SA C W - 30%Light
0 5 10 15 20 25
0 2 4 6 8 1 0 1 2 1 4
da ys
0 200 400 600 800 1000 1200 1400 P P /P P0 acChl/ac Chl0
S A C W+C W - 30%Light
0 5 10 15 20 25
0 2 4 6 8 10 12 14
da ys
0 200 400 600 800 1000 1200 1400 P P /P P0 acChl/ac Chl0
C W - 30%Light
0 5 10 15 20 25
0 2 4 6 8 1 0 12 14
da ys
0 200 400 600 800 1000 1200 1400 P P /P P0 ac Chl/ac Chl0
S A C W - 10%Light
0 5 1 0 1 5 2 0 2 5
0 2 4 6 8 1 0 1 2 1 4
da ys
0 2 0 0 4 0 0 6 0 0 8 0 0 1 0 0 0 1 2 0 0 1 4 0 0 P P /P P0 ac Chl/acChl0
S A C W +C W - 10%Light
0 5 1 0 1 5 2 0 2 5
0 2 4 6 8 10 1 2 1 4
da ys
0 200 400 600 800 1000 1200 1400 P P /P P0 acChl/ac Chl0
C W- 10%Light
0 5 10 15 20 25
0 1 2 3
da ys
0 200 400 600 800 1000 1200 1400
P P /P P0 ac Chl/ac Chl0
Fig. 4. Temporal variation of dissolved inorganic nitrogen (DIN), nitrate (NO3-) and phosphate (PO4-3) in the nine
microcosm treatments performed during the summer (units in µM). Light level influenced both the biomass yield and the nutrient assimilation pattern. At 100 and 30% PAR, PP/PP0 and acChl/acChl0 maxima
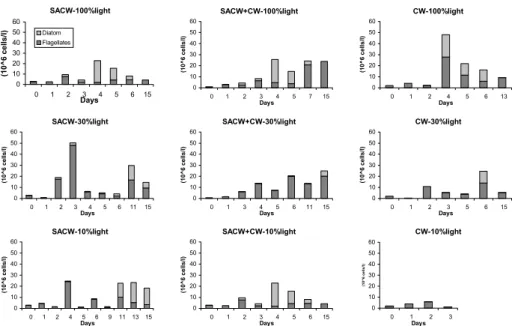
were observed on the third or fourth day of incubation (Fig. 3). Preceding these maxima a significant decrease in DIN and phosphate was observed (Fig. 4), especially in SACW and SACW+CW. Diatoms were the more abundant group in the biomass peak at 100% PAR, while flagellates dominated at 30% PAR (Fig. 5). Under 10% PAR, microcosm responses were distinct. SACW10 presented the greatest yields in terms of [Chl/Chl0], [acChl/acChl0]
and [PP/PP0] among all microcosms (Table 4) and
nutrient concentrations declined sharply after day 7, preceding the second and higher biomass peak (whose absolute value was 16.5 mgChl m-3) dominated by diatoms, in opposition to the initial biomass peak which was dominated by flagellates without a prior relevant nutrient consumption (Figs 3 to 5). A high degree of correlation between DIN consumption and µmeanacChl (91.2%, P=0.0016) and
vmaxDIN and [PP/PP0] (81.8%, P=0.013) suggests
that the biomass production is primarily linked to N uptake.
SA C W -100% Light
0.0 1.0 2.0 3.0 4.0 5.0 6.0 7.0 8.0 9.0
0 2 4 6 8 1 0 12 14
days 0.0 0.1 0.2 0.3 0.4 0.5 0.6 0.7 DIN NO3 P O4-3
S A C W +C W -100%Light
0.0 1.0 2.0 3.0 4.0 5.0 6.0 7.0 8.0 9.0
0 2 4 6 8 10 12 14
days 0 .0 0 .1 0 .2 0 .3 0 .4 0 .5 0 .6 0 .7 D IN , N O3- (uM) PO4-3 (u M)
C W -100% Light
0 .0 1 .0 2 .0 3 .0 4 .0 5 .0 6 .0 7 .0 8 .0 9 .0
0 2 4 6 8 1 0 12 14
da ys 0 .0 0 .1 0 .2 0 .3 0 .4 0 .5 0 .6 0 .7 D IN , N O3
(u M) PO4
-3
(u M)
S AC W -30% Light
0 .0 1 .0 2 .0 3 .0 4 .0 5 .0 6 .0 7 .0 8 .0 9 .0
0 2 4 6 8 10 1 2 14
da ys 0 .0 0 .1 0 .2 0 .3 0 .4 0 .5 0 .6 0 .7 D IN ,N O3
-(u M) PO4
-3
(u M)
S A C W +C W -30%Light
0 .0 1 .0 2 .0 3 .0 4 .0 5 .0 6 .0 7 .0 8 .0 9 .0
0 2 4 6 8 10 1 2 1 4
da ys 0.0 0.1 0.2 0.3 0.4 0.5 0.6 0.7 D IN ,N O3
-(u M) PO
4 -3(uM)
C W -30% Light
0.0 1.0 2.0 3.0 4.0 5.0 6.0 7.0 8.0 9.0
0 2 4 6 8 1 0 1 2 14
da ys 0.0 0.1 0.2 0.3 0.4 0.5 0.6 0.7 D IN ,N O3-(u M) PO4-3(uM)
S AC W -10% Light
0.0 1.0 2.0 3.0 4.0 5.0 6.0 7.0 8.0 9.0
0 2 4 6 8 10 1 2 1 4
days 0 .0 0 .1 0 .2 0 .3 0 .4 0 .5 0 .6 0 .7 D IN ,N O3
-(u M) PO
4 -3(uM)
S AC W +C W -10% Light
0 .0 1 .0 2 .0 3 .0 4 .0 5 .0 6 .0 7 .0 8 .0 9 .0
0 2 4 6 8 10 1 2 1 4
da ys 0.0 0.1 0.2 0.3 0.4 0.5 0.6 0.7 D IN ,N O3
-(u M) PO4
-3
(u M)
C W -10%Light
0 .0 1 .0 2 .0 3 .0 4 .0 5 .0 6 .0 7 .0 8 .0 9 .0
0 1 2 3
da ys 0.0 0.1 0.2 0.3 0.4 0.5 0.6 0.7 D IN ,N O3-(u M) PO4
-3
(uM)
D IN ,N O3- (u M) PO4
Fig. 5. Temporal variation of total phytoplankton cell density (106 cells l-1) in the summer microcosms,
emphasizing the dominance of the groups flagellates (phytoflagellates + dinoflagellates + silicoflagellates + cocolitophorids) and diatoms.
Table 4. Parameters derived from the 8 summer microcosms growth curves: maximum value obtained for Chl/Chl0,
acChl/acChl0, PP/PP0, PP/acChl, cell/cell0 (variables normalized by the time zero value); time integrated values (represented by
the brackets) of [Chl/Chl0], [acChl/acChl0] and [PP/PP0]; maximum growth rate (µmax) in terms of Chl/Chl0, acChl/acChl0 and
cell/cell0; mean growth rates in the exponential phase (µmean) obtained for Chl/Chl0 and acChl/acChl0 and maximum assimilation
rate of DIN and PO4-3 per active Chl units-vmaxDIN and vmaxPO4-3 (in µmol µgChl-1 d-1). (M=SACW+CW)
The greatest values of vmaxDINand vmaxPO4 -3
were registered in SACW microcosms followed by the intermediate values in the SACW+CW ones (Table 4), although vmaxPO4
-3
in CW had been higher than in the SACW+CW microcosms, as a result of an intense PO4-3 uptake in the first days in CW
microcosms.
Cluster analysis applied to the data on Table 4 corroborates the visual interpretation of Figure 3, separating 3 groups: one composed by SACW at the three light levels, characterized by greater [Chl/Chl0],
[PP/PP0], vmaxDIN, vmaxPO4-3 but with lower cell/cell0
than the other microcosms at the same light level. Another group comprising SACW+CW100, CW100 and SACW+CW30 presented the maximum yield in terms of cell density and values of [acChl/acChl0] and
[PP/PP0] a bit smaller than the first group ones. The
last group, composed by CW30 and SACW+CW10, presented the lower assimilation ratios (PP/acChl) and lower acChl yields. Discriminant analysis pointed out [PP/PP0] and vmaxDIN as the main parameters for
group separation.
C-winter
SACW-100%light
0 10 20 30 40 50 60
0 1 2 3 4 5 6 15
Days
(10^
6 cells/l)
Diatom Flagellates
SACW-30%light
0 10 20 30 40 50 60
0 1 2 3 4 5 6 11 15
Days
(10^6 cells/l)
SACW-10%light
0 10 20 30 40 50 60
0 1 2 4 5 6 9 11 13 15
Days
(10^6 cells/l)
SACW+CW-100%light
0 10 20 30 40 50 60
0 1 2 3 4 5 7 15
Days
(10^6 cells/l)
SACW+CW-30%light
0 10 20 30 40 50 60
0 1 3 4 5 6 11 15
Days
(10^6 cells/l)
SACW+CW-10%light
0 10 20 30 40 50 60
0 1 2 3 4 5 6 15
Days
(10^6 cells/l)
CW-100%light
0 10 20 30 40 50 60
0 1 2 4 5 6 13
Days
(10^6 cells/l)
CW-30%light
0 10 20 30 40 50 60
0 1 2 3 5 6 15
Days
(10^6 cells/l)
CW-10%light
0 10 20 30 40 50 60
0 1 2 3
Days
(10^6 cel
ls
/l
)
Summer Microcosm
max Chl/Chl0
max acChl/ acChl0
0 Chl Chl
0 acChl
acChl max
PP/PP0 PP0
PP max
PP/acChl max cell/cell0
µmax Chl
µmax acChl
µmean Chl
µmean acChl
µmax cell
vmax DIN
vmax PO4-3
(d) (d) (d) (mgC /
mg Chl h) (d
-1
) (d-1
) (d-1
) (d-1
) (d-1
) µ(µmol / gChl d)
(µmol /
µgChl d)
SACW100 26.54 24.35 69.38 72.01 1382.3 5197 38.90 8.14 2.49 1.26 7.21 5.90 1.69 10.56 1.11
M100 42.81 18.70 50.77 40.49 534.9 899 39.17 38.71 1.86 1.57 8.79 5.60 1.90 12.63 0.54
CW100 5.85 17.54 21.91 49.50 228.3 1173 72.67 24.51 1.01 1.35 1.37 4.26 1.55 3.70 0.71
SACW30 10.34 21.94 52.55 81.95 851.4 7132 146.89 17.86 1.16 1.28 3.06 6.97 3.08 16.03 1.32
M30 10.01 19.26 42.89 72.01 299.0 1693 40.64 19.09 1.60 1.39 2.49 5.17 1.19 6.09 0.51
CW30 6.02 14.11 29.02 63.75 189.4 1210 17.89 12.51 0.84 0.88 0.63 1.00 3.26 4.63 1.55
SACW10 14.83 27.23 111.14 153.67 1222.1 8560 22.17 8.82 0.82 1.34 1.42 1.05 2.05 16.06 1.43
This microcosm series was conducted to highlight the phytoplankton dynamics in a very common condition in wintertime: a physically homogeneous water column occupies the continental shelf, as SACW generally remains around the shelf-break. The question was: are there differences between surface and bottom phytoplankton communities into the same water mass?
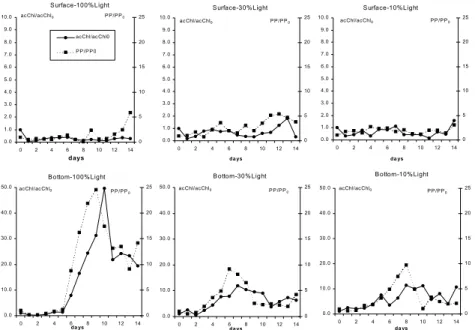
At the sampling time, phytoplankton biomass and inorganic nutrients in both depths were similar (Table 2), except to the higher ammonium concentrations at surface, that allowed supposing that a better growth could be expected for surface populations. However, time series of acChl/acChl0
and PP/PP0 (Fig. 6), clearly demonstrate the
differences between surface and bottom water microcosm responses: in surface, acChl/acChl0 values
were most of the time below 1 (indicating a biomass decrease related to initial concentration) whereas in the bottom ones, a significant phytoplankton biomass growth was verified at the three light levels (Table 5). The phytoplankton community present in bottom water was able to develop; meanwhile the surface one seemed to be depleted. These results indicate the existence of a vertical physiological stratification in the phytoplankton community at the sampling time.
Ammonium was the dominant nitrogen form in all microcosms and the variability in DIN
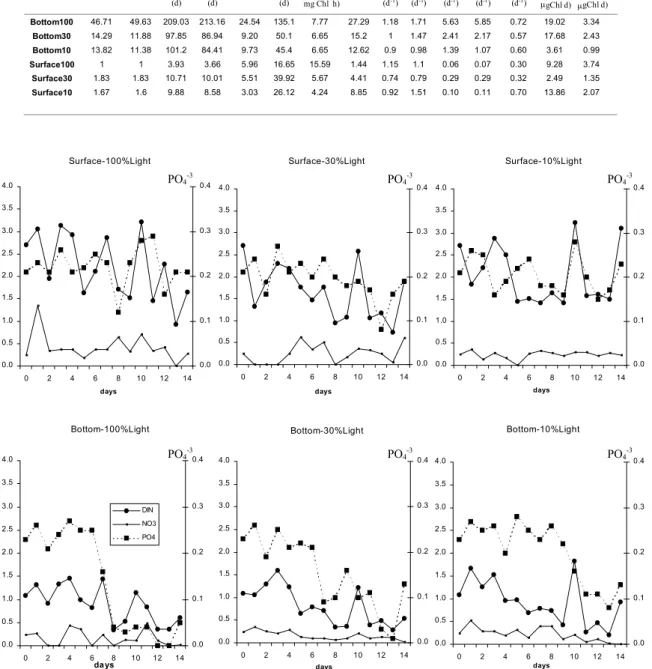
concentrations was generally related to it. In microcosms S100 and S30 there was a slight tendency to phosphate and DIN consumption with time, which was not evident in S10 (Fig. 7). In B100 and B30, DIN and phosphate concentrations decreased rapidly after day 6, preceding the biomass peak. In B10, DIN tended to decrease since day 1 and phosphate consumption was more intense after day 8, also preceding the Chl peak. Bottom water microcosms results showed the importance of light for biomass development: B100 attained the greater growth rates, using almost every available nutrient, while B30 and B10 were not significantly different in terms of biomass production and the nutrient consumption was lower. Maximum correlation was found between [PP/PP0] and [acChl/acChl0] (92%, P=0.001), vmaxPO4
-3
and µmaxChl (82%, P=0.022) and also vmaxDIN and
max PP/acChl (73.5%, P=0.037).
Cluster analysis applied to the data presented in Table 5 separated the microcosms in 3 groups: one represented by B100, which displayed the maximum Chl and PP yields, another one represented by S100 that did not present growth, and the last one composed by the other microcosms which displayed intermediate Chl and PP yields. Discriminant analysis pointed out that the main distinctive parameters were C assimilation ratio (PP/acChl), maximum cell/cell0 and
[PP/PP0].
Fig. 6. Temporal variation of active chlorophyll-a (acChl) and primary production rates (PP) normalized by the time zero value of each treatment (respectively acChl/acChl0 and PP/PP0), observed
during c-winter microcosm incubations, from surface and bottom layers.
S urface-100% Light
0.0 1.0 2.0 3.0 4.0 5.0 6.0 7.0 8.0 9.0 10.0
0 2 4 6 8 10 12 14
days
0 5 10 15 20 25
ac Chl/ac Chl0
P P /P P 0 P P /P P0 ac Chl/ac Chl0
S urface-30% Light
0.0 1.0 2.0 3.0 4.0 5.0 6.0 7.0 8.0 9.0 10.0
0 2 4 6 8 10 12 14
da ys
0 5 10 15 20 25 P P /P P0 ac Chl/ac Chl0
S urface-10%Light
0.0 1.0 2.0 3.0 4.0 5.0 6.0 7.0 8.0 9.0 10.0
0 2 4 6 8 10 12 14
da ys
0 5 10 15 20 25 P P /P P0 ac Chl/ac Chl0
B ottom-100% Light
0.0 10.0 20.0 30.0 40.0 50.0
0 2 4 6 8 10 12 14
da ys
0 5 10 15 20 25 ac Chl/ac Chl0 P P /P P0
B ottom-30% Light
0.0 10.0 20.0 30.0 40.0 50.0
0 2 4 6 8 10 12 14
da ys
0 5 10 15 20 25 ac Chl/ac Chl0 P P /P P0
B ottom-10% Light
0.0 10.0 20.0 30.0 40.0 50.0
0 2 4 6 8 10 12 14
da ys
Table 5. Parameters derived from the 6 c-winter microcosm growth curves: maximum value obtained for Chl/Chl0,
acChl/acChl0, PP/PP0, PP/acChl, cell/cell0 (variables normalized by the time zero value); time integrated values
(represented by the brackets) of [Chl/Chl0], [acChl/acChl0] and [PP/PP0]; maximum growth rate (µmax) in terms of
Chl/Chl0, acChl/acChl0 and cell/cell0; mean growth rates in the exponential phase (µmean) obtained for Chl/Chl0 and
acChl/acChl0 and maximum assimilation rate of DIN and PO4-3 per active Chl units-vmaxDIN and vmaxPO4-3 (in µmol µgChl-1 d-1).
Fig. 7. Temporal variation of dissolved inorganic nitrogen (DIN), nitrate (NO3-) and phosphate (PO4-3) in the c-winter
microcosms (units in µM).
D
ISCUSSION c-WinterMicrocosm max Chl/Chl0
max acChl/ acChl0
0 Chl Chl
0 acChl
acChl max
PP/PP0 PP0
PP max
PP/acChl max cell/cell0
µmax Chl
µmax acChl
µmean Chl
µmea n acChl
µmax cell
vmax DIN
vmax PO4-3
(d) (d) (d) mg Chl h)(mgC / (d-1) (d-1) (d-1) (d-1) (d-1) µ(µmol /
gChl d) (
µ
mol /
µ
gChl d)
Bottom100 46.71 49.63 209.03 213.16 24.54 135.1 7.77 27.29 1.18 1.71 5.63 5.85 0.72 19.02 3.34
Bottom30 14.29 11.88 97.85 86.94 9.20 50.1 6.65 15.2 1 1.47 2.41 2.17 0.57 17.68 2.43
Bottom10 13.82 11.38 101.2 84.41 9.73 45.4 6.65 12.62 0.9 0.98 1.39 1.07 0.60 3.61 0.99
Surface100 1 1 3.93 3.66 5.96 16.65 15.59 1.44 1.15 1.1 0.06 0.07 0.30 9.28 3.74
Surface30 1.83 1.83 10.71 10.01 5.51 39.92 5.67 4.41 0.74 0.79 0.29 0.29 0.32 2.49 1.35
Surface10 1.67 1.6 9.88 8.58 3.03 26.12 4.24 8.85 0.92 1.51 0.10 0.11 0.70 13.86 2.07
Surface-100%Light
0.0 0.5 1.0 1.5 2.0 2.5 3.0 3.5 4.0
0 2 4 6 8 10 12 14
days
0.0 0.1 0.2 0.3 0.4
Surface-30%Light
0.0 0.5 1.0 1.5 2.0 2.5 3.0 3.5 4.0
0 2 4 6 8 10 12 14
days
0.0 0.1 0.2 0.3 0.4
Surface-10%Light
0.0 0.5 1.0 1.5 2.0 2.5 3.0 3.5 4.0
0 2 4 6 8 10 12 14
days
0.0 0.1 0.2 0.3 0.4
Bottom-100%Light
0.0 0.5 1.0 1.5 2.0 2.5 3.0 3.5 4.0
0 2 4 6 8 10 12 14
da ys
0.0 0.1 0.2 0.3 0.4
DIN
NO3
PO4
Bottom-30%Light
0.0 0.5 1.0 1.5 2.0 2.5 3.0 3.5 4.0
0 2 4 6 8 10 12 14
days
0.0 0.1 0.2 0.3 0.4
Bottom-10%Light
0.0 0.5 1.0 1.5 2.0 2.5 3.0 3.5 4.0
0 2 4 6 8 10 12 14
days
0.0 0.1 0.2 0.3 0.4
PO4-3 PO4-3 PO4-3
Several studies pointed out the importance of the SACW presence over the continental shelf in increasing phytoplankton productivity. However, the present study constitutes the first tentative of quantifying the nutritional as well as thend also biological potential of this water mass based on phytoplankton growth rates.
Carpenter (1996), discussing about the microcosms application in ecological studies, states "microcosms have become an important tool for some ecologists. However, they also have serious limitations… The size and duration of microcosm experiments exclude or distort important features of
communities and ecosystems". He also emphasizes
that "The rich context of ecology, our fundamental understanding of phenomena at multiple scales... depend on appropriately scaled field studies. While microcosm experiments have many advantages, their
primary role is supportive and heuristic". Daehler &
Strong (1996) assert that the value of microcosms certainly depends on the questions being asked and the ecosystem or community being studied.
Even considering the limitations and biases inherent to microcosm approaches in representing natural conditions and given that all microcosms were submitted to the same "restrictions" allowing inter-comparisons, the present study was able to demonstrate the importance of the mixture of the nutrient rich SACW with the oligotrophic waters of the mixed layer (dominated by CW) in the Southeast Brazilian shelf, for the input of new nutrients and hence new production. Also, it was evident that the autochthonous phytoplankton community of SACW acts as a biological seeder when it reaches the euphotic layer developing high biomass.
Maximum Chl yields here obtained can be slightly overestimated by at least two reasons: as microcosms enclose amounts of water, they prevent cell losses by physical factors (Estrada et al., 1987) and the small-scale turbulence generated by the bubbling air inside the bottles also could have a positive effect on biomass increase as verified by Alcaraz et al. (2002).
Eppley (1972) demonstrated that the ratio of cell division increases exponentially in the 0-40°C interval, so the differences between lag-phase for phytoplankton growth observed in the experiments of summer and winter may be related to the differences in water temperature at the outdoor tank in both periods.
Albeit there are great differences between SACW in situ temperature and the temperature in the incubation tanks, especially in the summer experiments (∆T=14°C), the results obtained represent the potential of biomass production of SACW inside the euphotic zone, considering the intensive nutrient
consumption in all SACW microcosms. If the incubation temperature had been lower, probably the biomass yields would have been smaller, and so the potential yield would have been underestimated. Field observations in different SACW upwelling events at Cabo Frio (RJ) and neighboring area reported by several authors (Valentin et al., 1986, Lins da Silva et al., 1988; Gonzalez-Rodrigues et al., 1992, Moser & Gianesella-Galvão, 1997, among others) showed that the phytoplankton development after an upwelling depends on the water heating. Indeed, Gonzalez-Rodriguez (op. cit.) characterized the upwelling phenomenon in three sequential phases where the second one, named as "productive phase", is typified by the water heating accompanied by the phytoplankton biomass increase.
Delgadillo-Hinojosa et al. (1997) observed that the increase in daily-integrated primary production was positively correlated to nitrate concentrations. Marañón et al. (2003) found that the rate of nutrient supply to the euphotic layer, estimated from variations in the nitracline depth, appeared as the most relevant environmental factor in explaining the observed variability in the primary productivity. The same feature was observed in the summer microcosms where the main nitrogen source was nitrate. The analyzed parameters vmaxDIN and vmaxPO4-3 reflect the
degree of phytoplankton adaptation to the environmental trophic conditions: the lowest vmaxDIN
values were registered in CW microcosms while SACW+CW presented intermediate values and the highest occurred in SACW, independently of the light level (Table 4). This feature indicates that the more oligotrophic adapted the community is, the lower is the nutrient demand per Chl unit.
expected depending on its characteristics: if the SACW stays at deeper portions of the euphotic zone, the nutrient consumption and autochthonous phytoplankton development will be different from a shallower upwelling condition. According to the present data, in the first case a slow nutrient consumption and a slow biomass increase but with higher yields would be expected, whereas if the SACW reaches the upper layers of the euphotic zone, an ephemeral and high biomass diatom peak following an intense nutrient consumption will be observed. In terms of nutrient profit, each condition results in different degrees of system enrichment: opportunist diatom peaks with higher growth rates could be uncoupled to zooplankton population able to graze them efficiently. In this case, most of that phytoplankton biomass will settle down, constituting a food source for benthos in shallow areas and a substrate to bacterial nutrient remineralization, allowing the nutrient turnover into the mixing layer. In the case where the nutrients were consumed slowly, the biomass peak is longer and grazing can be an important route to export nutrients to pelagic fish. This means that the upwelling characteristics will determine the main enrichment route into the trophic web. Similar conclusions were presented by Valentin
et al. (1991) that states that the best biological results
are obtained when the SACW penetration occurs slowly and continuously, allowing the establishment of a well-structured phytoplankton community. The phytoplankton community composition also has an important role in the energy flux in terms of food quality for the herbivores. Planktonic diatoms are the usual food for zooplankton and filter feeding fishes and contribute in a direct way to large fishable populations in coastal zones. In contrast, flagellates are frequently poor foods for most grazers and can lead to undesirable eutrophication effects (Officer & Ryther, 1980).
Odebrecht & Djurfelt (1996) observed that nutrient injection into the euphotic zone through bottom driven turbulence both during upwelling and downweling conditions, fuels the subsurface growth of large diatoms, leading to a surface chlorophyll maximum in a layer of relative low mixing rates, which may provide optimal food, for most pelagic filter feeders. In this case, the authors affirm that a simple and short trophic system, with low losses, would be expected, as a result of the growth of large centric diatoms.
Valentin et al. (1986) following an upwelling event at Cabo Frio (RJ), observed a diatom species succession related to the water warming: under lower temperatures and high nutrients the genera
Thalassionema, Diploneis and Pleurosigma dominate,
while in warmer and lower nutrient upwelled water
the dominating genera were Chaetoceros, Nitzschia,
Rhizosolenia and Leptocylindrus, indicating specific
adaptive mechanisms. In summer microcosms, under high incubation temperature, the diatom bloom was mainly composed by the genera Nitzschia,
Thalassiosira and unidentified nanoplanktonic
centrics.
Saldanha-Corrêa (1999) verified dynamic stable conditions during a strong SACW upwelling in São Sebastião coast, when this water reached the 25m depth and returned to deeper layers after 36h. In this occasion, SACW nutrients were not introduced into the mixed layer, due to the lack of turbulent mixing. Conversely, in this same period, a biomass increase was detected in the SACW domain (temperature was higher than 17°C), representing the autochthonous phytoplankton development, as the water entered into the euphotic layer. This observation agrees with the fact that phytoplankton responses occur on a scale of hours to days (Ferris & Christian, 1991 & Prézelin et al., 1991) and corroborates the existence of a viable autotrophic community living outside the euphotic zone, which can growth significantly when light becomes available (Murphy & Cowles, 1997).
In the c-winter, the water column was homogeneous in terms of temperature and salinity and nutrient concentrations were similar between surface and bottom waters. However, the differences in biomass yields between surface and bottom microcosms indicate that bottom waters possessed some kind of bio-stimulant substance, not evaluated in the nutrient analysis performed. The sediment suspension due to the bottom friction promoted by water movements should be responsible for the introduction of these substances into the deeper layers of the water column, where they became available for phytoplankton. Indeed, Gianesella-Galvão & Saldanha-Corrêa (1995)based on fixed station data where physical and chemical conditions of the water column and phytoplankton biomass were monitored, verified an event of SACW intrusion in the outer shelf during the winter with a simultaneous phytoplankton productivity decrease. These authors discuss that, as the intrusion was very slight and occurred under dynamic stable conditions, the mixture between the water masses was negligible and in addition SACW acted as a physical barrier, isolating the remaining water column from the bottom, preventing the upward flow of settled remineralized substances from the sediment-water interface to the oligotrophic water column.
A
CKNOWLEDGEMENTSWe thank Elizabeth Aidar (in memoriam) for all the contributions she gave along the entire project, to Marta Stephan for the help in fieldwork, to Dr. Robert Owen for the helpful suggestions on data analysis and also to the two anonymous reviewers for the comments and suggestions.
R
EFERENCESAidar, E.; Ehrlich, R.; Asano, C. S. & Sigaud, T. C. S. 1991. Variação da composição química do meio de cultura e da bioquímica celular de Phaeodactylum tricornutum, em cultivos estanques. Bolm. Inst. Oceanogr., 39(2):131-139.
Aidar, E.; Gaeta. S. A.; Gianesella-Galvão, S. M. F.; Kutner, M. B. B. & Teixeira, C. 1993. Ecossistema costeiro subtropical: nutrientes dissolvidos, fitoplâncton e clorofila-a e suas relações com as condições oceanográficas na região de Ubatuba, SP. Publção esp. Inst. oceanogr., (10): 9-43, 1993.
Alcaraz, M.; Marrasé, C.; Peters, F.; Arin, L. & Malits, A. 2002. Effects of turbulence conditions on the balance between production and respiration in marine planktonic communities. Mar. Ecol. Progr. Ser., 242:63-71. Aminot, A. & Chaussepied, M. 1983. Manuel des analyses
chimiques en milieu marin. Brest, C.N.E.X.O. 395 p. Brandini, F. P. 1988a. Composição e distribuição do
fitoplâncton na região sueste do Brasil e suas relações com as massas de água (Operação Sueste I- inverno/ 1982). Ciênc. Cult., 40(4):334-341.
Brandini, F. P. 1988b. Hydrography, phytoplankton biomass and photosynthesis in shelf and oceanic waters off southeastern Brazil during autumn (May/June 1983). Bolm Inst. oceanogr., S Paulo, 36(1/2):63-72.
Brandini, F. P. 1990. Hydrography and characteristics of the phytoplankton in shelf and oceanic waters off southeastern Brazil during winter (July/August 1982) and summer (February/March 1984). Hydrobiol., 196:111-148.
Bray, G. A. 1960. A simple efficient liquid scintillator for counting aqueous solution in a liquid scintillation counter. Analyt. Biochem., 1:279-285.
Carpenter, S. R. 1996. Microcosms experiments have limited relevance for community and ecosystem ecology. Ecology, 77(3): 677-680.
Castro Filho, B. M.; Miranda, L. B. & Miyao, S. Y. 1987. Condições hidrográficas na plataforma continental ao largo de Ubatuba: variações sazonais e em média escala. Bolm Inst. oceanogr., S Paulo, 35(2):135-151.
Chrétiennot-Dinet, M. J. 1977. Les Nanoflagellés. Problèmes systematiques et écologiques. Seminaires du Laboratorie d'Oceanographie Biologique. Institut Ocean., 3(3):29-62. Ciotti, A. M.; Odebrecht, C.; Fillmann, G. & Moller Jr, O. O.
1995. Freshwater outflow and Subtropical Convergence influence on phytoplankton biomass on the southern Brazilian continental shelf. Continent. Shelf. Res., 15(14):1737-1756.
Cupp, E. E. 1943. Marine plankton diatoms of the west coast of North America. Bull. Scripps Inst. Oceanogr., 5(1):1-237.
Daehler, C. C. & Strong, D.R. 1996. Can You Bottle Nature? The Roles of Microcosms in Ecological Research. Ecology, 77(3):663-664.
Delgadillo-Hinojosa, F.; Gaxiola-Castro, G.; Segovia-Zavala, J. A.; Muñoz-Barbosa, A. & Orozco-Borbón, M. V. 1997. The effect of vertical mixing on primary production in a Bay of the Gulf of California. Estuar. coast. Shelf Sci., 45:135-148.
Émilsson, I. 1961. The shelf and coastal waters off southern Brazil. Bolm Inst. oceanogr., S Paulo, 11(2):101-112. Eppley, R. W. 1972. Temperature and phytoplankton growth
in the sea. Fish. Bull. natn. mar. Fish. Serv., U.S., 70(4):1063-1085.
Estrada, M.; Alcaraz, M. & Marrasé, C. 1987. Effects of turbulence on the composition of phytoplankton assemblages in marine microcosms. Mar. Ecol. Prog. Ser., 38:267-281.
Ferris, J. M. & Christian, R. 1991. Aquatic primary production in relation to microalgal responses to changing light: a review. Aquat. Sci., 53:187-217. Gaeta, S. A.; Susini, S. M.; Metzler, P. M.; Francos, M. S. &
Abe, D. S. 1999. Environmental forcing on biomass and primary productivity of the coastal ecosystem in Ubatuba region, southern Brazil. Rev. bras. oceanogr., 47(1):11-27.
Gonzalez-Rodriguez, E.; Valentin, J. L.; André, D. L. & Jacob, S. A. 1992. Upwelling and downwelling at Cabo Frio (Brazil): comparison of biomass and primary production responses. J. Plank. Res., 14(2):289-306. Grasshoff, K.; Ehrhardt, M. & Kremling, K. 1983. Methods
of seawater analysis. 2nd ed. Basel, Verlag Chemie. 419
p.
Lins da Silva, N. M.; Valentin, J. L. & Bastos, C. T. B. 1988. O microfitoplâncton das águas costeiras do litoral fluminense (Estado do Rio de Janeiro): lista de espécies e aspectos ecológicos. Bolm Inst. oceanogr., S Paulo, 36(1/2):1-16.
Lorenzen, C. J. 1966. A method for continuous measurement of "in vivo" chlorophyll concentration. Deep-Sea Res., 13:223-227.
Lund, J. W. G.; Kippling, C. & Le Gren, E. D. 1958. The inverted microscope method of estimating algal numbers and the statistical basis of estimations by counting. Hydrobiol., 11:143-170.
Maglioca, A.; Miranda, L. B. & Signorini, S. R. 1979. Physical and chemical aspects of transient stages of the upwelling at Southwest of Cabo Frio (23° S - 41° W). Bolm Inst. oceanogr., 28 (2):37 – 46.
Marañón, E.; Behrenfeld, M. J.; González, N.; Mouriño, B. & Zubkov, M. V. 2003. High variability of primary production in oligotrophic waters of the Atlantic Ocean: uncoupling from phytoplankton biomass and size structure. Mar. Ecol. Prog. Ser., 257:1-11.
Matsuura, Y. 1986. Contribuição ao estudo da estrutura oceanográfica da região sudeste entre Cabo Frio (RJ) e Cabo de Santa Marta Grande (SC). Ciênc. Cult., 38(8):1439-1450.
Mesquita, A. R. de; Leite, J. B. de A. & Rizzo, R. 1983. Note on the shelf break upwelling off the southeast coast of Brazil (Lat. 26°30' S). Bolm Inst. oceanogr., S Paulo, 32(2):193-198.
Miller, W. E.; Greene, J. C. & Shiroyama, T. 1978. The Selenastrum capricornutum Printz algal assay bottle test. Experimental design, application and data interpretation protocol. US Environmental Protection Agency- EPA-600/978-018, Environmnental Research Laboratory, Corvallis. 125p.
Moreira da Silva, P. C. 1971. Upwelling and its biological effects in southern Brazil. In: Fertility of the Sea. Costlow, J.D. ed. New York, Gordon and Breach Science Publishers Inc. p. 469-474.
Moser, G. A. O. & Gianesella, S. M. F. 1997. Biological and oceanographic upwelling indicators at Cabo Frio (RJ). Rev. bras. oceanogr., 45(1/2): 11-23.
Murphy, A. M. & Cowles, T. L. 1997. Effects of darkness on multi-excitation in vivo fluorescence and survival in a marine diatom. Limnol. Oceanogr., 42(6):1444-1453. Odebrecht, C. & Djurfelt, L. 1996. The role of nearshore
mixing on phytoplankton size structure off Cape Santa Marta Grande, southern Brazil (Spring 1989). Arch. Fish. Mar. Res., 43 (3): 217-230.
Officer, C. B. & Ryther, J. H. 1980. The possible importance of silicon in marine eutrophication. Mar. Ecol. Progr. Ser., 3:83-91.
Pires-Vanin, A. M. S.; Rossi-Wongschowski, C. L. D. B.; Aidar, E.; Mesquita, H. de S. L.; Soares, L. S. H.; Katsuragawa, M. & Matsuura, Y. 1993. Estrutura e função do ecossistema de plataforma continental do Atlântico Sul brasileiro: síntese dos resultados. Publção esp. Inst. oceanogr., 10:217-231.
Prézelin, B. B.; Tilzer, M. M.; Schofield, O. & Haese, C. 1991. The control of the production process of phytoplankton by the physical structure of the aquatic environment with special reference to its properties. Aquat. Sci., 53:138-186.
Rocha, G. R. A.; Gasalla, M. A.; Rossi-Wongtshowski, C. L. D. B.; Soares, L. S. H.; Pires-Vanin, A. M. S.; Muto, E. Y.; Cergole, M. C.; Aidar, E.; Mesquita, H. S. L.; Gianesella-Galvão, S. M. F.; Vega-Pérez, L. A. & Jarre-Teichmann, A. 1998. Quantitative model of trophic interactions in the Ubatuba shelf system (Southeast Brazil). Naga, 21(4):26-32.
Steemann-Nielsen, E. 1952. The use of radio-active carbon (14C) for measuring organic production in the sea. J. Cons. perm. int. Explor. Mer., 18:117-140.
Strickland, J. D. H. & Parsons, T. S. 1968. A pratical handbook of seawater analysis. Bull. Fish. Res. Bd Can., 167:1-311.
Teixeira, C. 1973. Preliminary studies of primary production in the Ubatuba region (Lat. 23°30´S-Long. 45°06´ W), Brazil. Bolm Inst. oceanogr., S Paulo, 22:49-58. Teixeira, C.; Kutner, M. B. B.; Aidar-Aragão, E. & Schmidt,
G. 1986. Algal assay for limiting nutrients for phytoplankton production and growth at Flamengo Bay (Ubatuba-Brazil). Rev. bras. Biol., 46(3):491-506. Uthermöhl, H. 1958. Zur Vervollkommnung der quantitativen
Phytoplankton Methodik. Mitt.int. Ver. theor. angew. Limnol.,9:1-38,pl.1.
Valentin, J. L.; Lins da Silva, N. M.; Monteiro-Ribas, W. M.; Mureb, M. A.; Bastos, C. T. B. T.; Tenenbaum, D. R.; André, D. L.; Jacob, S. A. & Pessotti, E. 1986. Le plancton dans l'upwelling de Cabo Frio (Brésil): microrépartition spatio-temporelle à une station fixe. Ann. Inst. océanogr., 62(1):117-135.
Valentin, J. L.; Macedo-Saidah, F. E.; Tenembaum, D. R. & Lins da Silva, N. 1991. A diversidade específica para análise das sucessões fitoplanctônicas. Aplicação ao ecossistema da ressurgência de Cabo Frio (RJ). Nerítica, 6(1-2):7-26.
Wood, E. J. F. 1968. Dinoflagellates of the Caribbean Sea and adjacent areas. Coral Gables, University of Miami Press. 142p.
Sources of unpublished material
Gianesella-Galvão, S. M. F. & Saldanha-Corrêa, F. M. P. 1995. A conceptual model for primary production in the Ubatuba region. In: XII International Symposium on Environmental Biochemistry. Rio de Janeiro (RJ), September 03 to 08, 1995. Abstracts, p. 125.
Saldanha-Corrêa, F. M. P. 1999. Aspectos da variação vertical e temporal da produção primária e biomassa fitoplanctônica, em uma estação fixa na região costeira de São Sebastião (SP). Tese de Doutorado. Universidade de São Paulo, Instituto Oceanográfico. 100 pp.+tabs e figs.