A COMPARISON OF THE RETENTION CAPABILITY AMONG THREE DIFFERENT
GLASS-FIBER FILTERS USED FOR CHLOROPHYLL-A DETERMINATIONS.
Flávia M. P. Saldanha-Corrêa*, Sônia M. F. Gianesella & José Juan Barrera-Alba
Instituto Oceanográfico da Universidade de São Paulo (Praça do Oceanográfico, 191 05508-900, São Paulo, SP, Brasil)
Chlorophyll-a (Chl-a) is a ubiquitous photosynthetic pigment in phytoplanktonic species, which include eukaryotic and prokaryotic organisms (cyanobacteria). Thus it has been used commonly as a reliable proxy for total phytoplankton biomass (Gregor & Marsálek, 2004) since the early 1930s (Phinney & Yentsch, 1985). Glass fiber filters have traditionally been used to concentrate phytoplankton cells to extract the pigments for spectrophotometric measurements. However, after the discovery of photoautotrophers smaller than 1 µm, such as cyanobacteria (Waterbury
et al., 1979) and picoeukaryotes (Johnson & Sieburth, 1982), membrane filters of varied composition and smaller nominal pore size (0.22 or 0.10 µm) have been suggested in order to retain these organisms (Li et al.,
1983; Platt et al., 1983). Many comparisons between glass fiber and membrane filters for several kinds of analyses, such as seston, POC, primary production by
14
C method and also pigments have been carried out (Sheldon, 1972; Holm-Hansen & Reimann, 1978; Phinney & Yentsch, 1985; Morán et al., 1999; Ashimoto & Hiomoto, 2000).
Morán et al. (1999) compared the filters GF/C (1.2 µm), GF/F (0.7 µm), polycarbonate (0.2 µm) and cellulose esters (0.22 µm) using natural samples and verified no significant differences among these filters in terms of Chl-a retention, since flow cytometry analyses showed that most cells were larger than 1 µm. But these authors discuss that this result could be different if picoplankton had contributed in a large fraction in those samples. Ashimoto & Hiomoto (2000) found no significant difference between Chl-a concentrations obtained from GF/F and Nuclepore 0.22 µm in samples of subarctic Pacific. Chavez et al. (1995) compared Chl-a measurements obtained from field samples using Whatman GF/F and Nuclepore or Poretics 0.22 µm filters and concluded that GF/F can be used to measure accurately Chl-a even in oligotrophic waters such as found in the low latitude subtropical gyres and equatorial divergence. So, in biological oceanography GF/F filters are accepted as a standard for phytoplankton Chl-a determination (Chavez et al., 1995; Morán et al., 1999).
_________
Contr. No. 864 do Inst. Oceanogr. da Usp.
In the present work the performance of three different glass fiber filters on harvesting small cells for the determination of Chl-a concentration was compared. The filters (47 mm diameter) were: 0.7 µm GF/F Whatman, Millipore AP-40 (nominal porosity not informed by Millipore), and 0.4 µm Macherey-Nagel GF-5. According to APHA (1985), Millipore AP-40 is the standard filter for seston determination, meaning that it can retain particles bigger than 0.45 µm (accepted threshold for dissolved matter). Despite GF/F filters are adequate for Chl-a analysis, they are one of the most expensive filter brands and, consequently, sometimes the number of samples has to be reduced in order to fit into the project budget. So, the comparison with these cheaper and similar filters (AP-40 Millipore and GF-5 Macherey-Nagel) was made in order to check if they might constitute a reliable alternative for concentrating phytoplankton cells for Chl-a determination. If so, the costs of this analysis can be reduced allowing the possibility of more extensive or intensive monitoring programs or sampling schedules in a project.
To test the hypothesis that the three chosen filters performs equally, two experiments were conducted: one using a dense Synechococcus culture simulating an eutrophic condition (Synechococcus
Test) and another one using natural seawater taken from a very oligotrophic area (Oligotrophic Seawater Test).
Synechococcus Test
Synechococcus is an abundant
picoplanktonic organism in warm seas. Cells are coccoid to rod shaped ranging in size from 0.7 to 0.9 µm diameter and 1 to 2.5 µm length (Waterbury et al.,
1985) and possess as photosynthetic pigments only Chl-a and phycoerythrin, whose absorption peak is at 545 nm (Olson et al., 1990). Such characteristics allow the assessment of the performance of these filters in picoplankton retention and also the comparison between Lorenzen (1967) and Jeffrey & Humphrey, (1975) spectrophotometric equations for Chl-a determination due to the absence of others chlorophylls interference.
Laboratory of Oceanographic Institute of São Paulo University and diluted in aged seawater. As the sample filtered volume should be related to the expected algal concentration (Nush, 1980), sub samples of 200 ml (volume previously tested as near the GF/F clogging point) were filtered onto 8 replicates of the three filter types, at a vacuum pressure below 20 cm Hg. After the filtration, the filters were immediately transferred to centrifuge tubes, to which 12 ml of 90% acetone were added and filters were quickly macerated with a glass stick. To mitigate acetone volatilization, air temperature was kept at 18°C and filter maceration took no longer than one minute. Tubes were kept in the dark at -20°C for 24h. Extract was clarified by centrifugation at 2000 rpm for 15 min and the supernatant transferred to a 5 cm path length glass cuvette. All these steps were conducted at dim light to avoid phaeophytinization. The absorbance was measured in a Hitachi U2000 spectrophotometer (wavelength accuracy ± 0.4 nm) at the wavelengths of 750, 665, 645, 630 nm and again at 750 and 665 nm after acidification with 3 drops of HCl 1N (decreasing pH to around 2.7). Every sample was read twice to check the spectrophotometer data reproducibility (photometric accuracy ± 0.001 abs.).
Chl-a concentration was computed according to the equations by Lorenzen (1967), that discriminate Chl-a from phaeopigments-a, and also by Jeffrey & Humphrey (1975) equations. The sum of Chl + phaeopigments, given by the Lorenzen equations, is equivalent to the Chl-a concentration given by Jeffrey & Humphrey equation once this method does not discriminate the functional Chl-a from its degradation products (chlorophyllide, phaeophorbide and phaeophytin). Lorenzen & Jeffrey (1980) compared results obtained by these spectrophotometric methods with pure pigments and verified a good agreement
between recovery results and the real Chl-a concentration in the absence of other chlorophylls. In the presence of chlorophylls b, and c, Chl-a estimates by the monochromatic method are affected. Hence, these two methods provide complementary information: Lorenzen indicates the amount of Chl-a able to photosynthesize, which is an important information once, in field samples, phaeophytin content can be highly variable and may be also an indicative the phytoplankton physiological status. Jeffrey & Humphrey method gives best Chl-a estimates when other chlorophylls are present in the extract.
The filtration at AP-40 was faster than at GF/F and GF-5, which were similar between them. The three filter types showed no differences in the maceration process and there were also no differences in turbidity of the extract derived from the 3 filters: the absorbance at 750 nm showed values below 0.008, an essential condition to get good pigment quantification. Table 1 presents the Chl-a results obtained from the eight replicates of the three filter types, based on Lorenzen and Jeffrey & Humphrey equations. The highest coefficient of variation (CV) was observed in AP-40 data set, but Morán et al.
(1999) found even higher CV in some GF/F samples in their experiments.
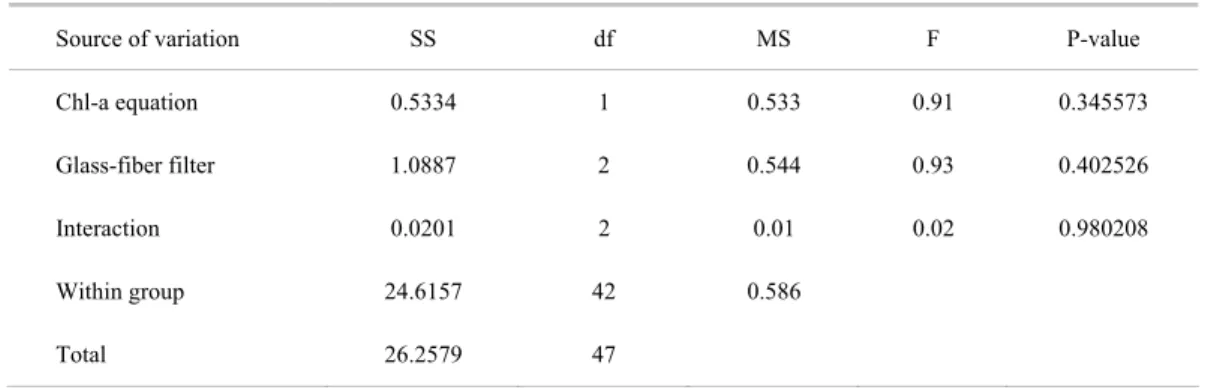
Two-way ANOVA applied to this data set (Table 2) indicated that there were no significant differences in Chl-a mean concentration among the three filters used and also regarding to the two computation methods applied. This agreement was due to the absence of other chlorophylls in Synechococcus
culture and also due to the low content of Chl-a degradation products (very low phaeophytin, data not presented) since the culture used was in the log-phase of growth.
Table 1. Chl-a average values (mg m-3) computed by the spectrophotometric methods of Jeffrey & Humphrey (1975) and Lorenzen (1967) in Synechococcus Test samples for the three glass fiber filters: GF/F Whatman, AP-40 Millipore and GF-5 Macherey–Nagel. (n=8)
Filters
Analysis Method GF/F Whatman AP-40 Millipore GF-5 MN
mean 9.41 9.53 9.69
SD 0.32 1.03 0.46 Jeffrey & Humphrey (1975)
CV (%) 3.45 10.84 4.76
mean 9.24 9.34 9.43
SD 0.26 0.89 0.53 Lorenzen (1967)
CV (%) 2.84 9.55 5.63
Table 2. Two-way ANOVA summary applied to Synechococcus Test data: Factor A is the equation used for Chl-a computation (Jeffrey & Humphrey, 1975 or Lorenzen, 1967), Factor B is the glass-fiber filter (GF/F, AP-40 and GF-5).
Source of variation SS df MS F P-value
Chl-a equation 0.5334 1 0.533 0.91 0.345573
Glass-fiber filter 1.0887 2 0.544 0.93 0.402526
Interaction 0.0201 2 0.01 0.02 0.980208
Within group 24.6157 42 0.586
Total 26.2579 47
This result indicates that the three filters used perform equally when the sample posses a high phytoplankton density, equivalent to an eutrophic condition, or even in a oligo or mesotrophic condition once an adequate sample volume is filtered, approximating to the filter clogging point.
Oligotrophic Seawater Test
Surface seawater was collected from a pelagic station in South Atlantic Ocean (Lat. 18°S; Long. 36°38.5´W, local depth 3,800m) dominated by the oligotrophic waters of the Brazil Current (T=24.7°C; S= 37.39). About 80 liters were collected with Niskin bottles and transferred to plastic carboys, which were kept under refrigeration for five days. In the laboratory, the water from the several carboys were transferred to a single container and homogenized. Sub samples of 2 l were taken from this bulk volume using graduated cylinders (previously calibrated) and filtered onto GF/F, GF-5 and AP-40 filters in 10 replicates for each filter type. After filtration, filters were submitted to the same maceration, extraction and centrifugation processes described for the Synechococcus test. Fluorometric methods are more sensitive to the low amount of Chl-a usually found in oligotrophic waters. Then, Chl-a content was determined in a Turner 10-AU fluorometer (Lorenzen, 1966) calibrated with standard Chl-a (Sigma). Results are presented in Table 3. Phaeophytin data were omitted since the concentration obtained in all samples was extremely low. The Least Significant Difference (LSD) test indicated that the average Chl-a concentration resulted from both GF/F and GF-5 samples were significantly different from AP-40 average, at 1% confidence level.
Table 3. Chl-a (mg m-3) results obtained by fluorimetric method (Lorenzen, 1966) for the GF/F, AP-40 and GF-5 filters in Oligotrophic Seawater Test.
The phytoplankton biomass in the natural seawater was also evaluated by epifluorescence microscopy as total and autotrophic cell abundance. Two aliquots of 15 ml from unfiltered seawater were stained with DAPI (1 mg ml-1 final concentration) for
ten minutes and filtered onto black 0.2 µm PORETICS polycarbonate membrane filters. The filters were laid on microscope slides and cells were counted under a ZEISS JENALUMAR epifluorescence microscope at 1000x magnification using an UV filter combination (Porter & Feig, 1980) for total cells. Autotrophic cells were counted according to MacIsaac & Stockner (1993). To checkout the retention efficiency of the 3
Replicates Filters
GF/F AP-40 GF-5
1 0.125 0.088 0.145
2 0.095 0.089 0.141
3 0.122 0.097 0.129
4 0.145 0.095 0.109
5 0.143 0.101 0.131
6 0.128 0.095 0.128
7 0.127 0.083 0.130
8 0.130 0.087 0.132
9 0.136 0.091 0.109
10 0.130 0.082 0.128
mean 0.128 0.091 0.128
SD 0.014 0.006 0.012
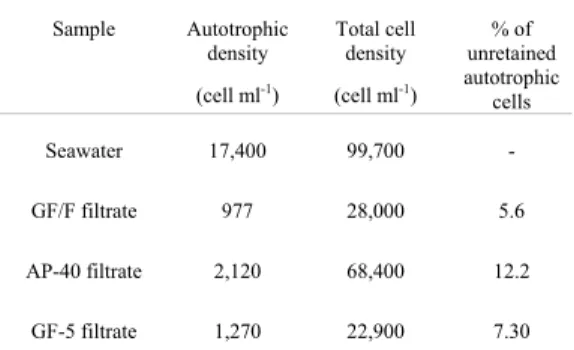
glass fiber filters, two aliquots of 15 ml from the filtrated seawater in each filter were taken and prepared for microscope counts following the same procedure applied to unfiltered seawater. Cell density in the unfiltered seawater (natural seawater) was extremely low and all representatives belong to the picoplankton size class. The results obtained for the three filters effluent (Table 4) corroborated the Chl-a concentration data since AP-40 effluent presented the highest number of autotrophic cells, indicating that this filter was less effective in retain the autotrophic picoplankton than GF/F and GF-5. Chaves et al.
(1995) obtained a range of 0.2 to 5.8% of prochlorophytes passing through uncombusted GF/F filters (analyzed by flow cytometry). The value verified in our study is in agreement to their observations.
Table 4. Mean cell density (cell ml-1) in the unfiltered seawater and in the seawater samples after passing through the filters GF/F, AP-40 and GF-5 to compute the percentage of autotrophic unretained cells for each filter.
Sample Autotrophic density
(cell ml-1 )
Total cell density
(cell ml-1 )
% of unretained autotrophic
cells
Seawater 17,400 99,700 -
GF/F filtrate 977
28,000 5.6
AP-40 filtrate 2,120 68,400 12.2
GF-5 filtrate 1,270 22,900 7.30
It is relevant to note that the filtered sample volume should be related to the phytoplankton biomass content (Nush, 1980). In the case of Oligotrophic Seawater Test, only 2 l were filtered due to logistic factors. For performing spectrophotometric analysis this volume is small, around 10 l per sample should have been filtered. For this reason, samples had to be analyzed by fluorescence, which is more sensitive than spectrophotometry. Thus, the precision of the results was good, once the coefficients of variation remained below 10.8 % (Table 3), not quite different from those obtained in the Synechococcus
test (Table 1) and also in other studies performed using GF/F filters (e.g. Morán et al., 1999). It can be considered also that, to a certain degree, the small filtered volume in the Oligotrophic Seawater Test pointed out the differences among the filters tested.
Present results demonstrate that the GF/F, AP-40 and GF-5 perform similarly in the harvesting capability in dense phytoplankton biomass (eutrophic) samples, such as the case of Synechococcus test. Hence, all of them can be indiscriminately used in
cases of meso and eutrophic conditions such as found in coastal and estuarine areas. However, in very oligotrophic waters on which picoplankton is the dominant size class in the sample, GF/F or GF-5 should be preferred in place of AP-40.
A
CKNOWLEDGEMENTSWe acknowledge Qualiquima Comércio Ltda. for providing the filters GF-5 Macherey-Nagel for the tests, Dr. Ilson Carlos da Silveira for collecting the seawater, Dr. Salvador A. Gaeta for allowing the use of the Turner Fluorometer and Marta Stephan and Mayza Pompeu for the logistic help.
R
EFERENCESAPHA (American Public Health Association) 1985. Standard methods for the examination of water and wastewater. 16th ed. Washington, APHA. 1288p.
Ashimoto, S. H. & Hiomoto, A. S. 2000. Comparison of GF/F filters and 0.2 and 0.6 µm Nuclepore filters on the chlorophyll retention. Bull. Nat. Res. Inst. Far Seas Fish., 37:45-48.
Chavez, F. P.; Buck, K. R.; Bidigare, R. R.; Karl, D. M.; Hebel, D.; Latasa, M. & Campbell, L. 1995. On the chlorophyll a retention properties of glass-fiber GF/F filters. Limnol. Oceanogr., 40:428-433.
Gregor, J. & Marsalek, B. 2004. Freshwater phytoplankton quantification by chlorophyll a: a comparative study of in vitro, in vivo and in situ methods. Water Res., 38:517-522.
Holm-Hansen, O. & Reimann, B. 1978. Chlorophyll a determination: improvements in methodology. Oikos, 30:438-447.
Jonhson, P. W. & Sieburth, J. McM. 1982. In situ morphology and occurrence of eucaryotic phototrophs of bacterial size in the picoplankton of estuarine and oceanic waters. J. Phycol., 18: 318-327.
Jeffrey, S. W. & Humphrey, G. F. 1975. New spectrophotometric equations for determining chlorophylls a, b, c and c2 in higher plants, algal and natural phytoplankton. Biochem. Physiol. Planzen Bd.,167 S:191-194.
Li, W. K. W.; Subba Rao, D. V.; Harrison, W. G.; Smith, J. C.; Cullen, J. J.; Irwin, B. & Platt, T. 1983. Autotrophic picoplankton in the tropical ocean. Science, 219:292-295.
Lorenzen, C. J. 1966. A method for continuous measurement of "in vivo" chlorophyll concentration. Deep-Sea Res., 13:223-227.
Lorenzen, C. J. 1967. Determination of chlorophyll and phaeopigment: spectrophotometric equations. Limnol. Oceanogr., 12:343-346.
Lorenzen, C. J. & Jeffrey, S. W. 1980. Determination of chlorophyll in seawater. Unesco tech. pap. mar. sci., 35. 20p.
Morán, X. A. G.; Gasol, J. M.; Aurin, L. & Estrada, M. 1999. A comparison between glass fiber and membrane filters for the estimation of phytoplankton POC and DOC production. Mar. Ecol. Prog. Ser., 187:31-41.
Nusch, E. A. 1980. Comparison of different methods for chlorophyll and phaeopigment determination. Arch. Hydrobiol. Belh. Ergebn. Limnol., 14:14-36
Olson, R. J.; Chisholm, S. W.; Zettler, E. R. & Armbrust, E. V. 1990. Pigments, size, and distribution of Synechococcus in the north Atlantic and Pacific Oceans. Phinney, D. A. & Yentsch, C. S. 1985. A novel
phytoplankton chlorophyll technique: toward automated analysis. J. Plankt. Res., 7(5):633-642.
Platt, T.; Subba Rao, D. V. & Irwin, B. 1983. Photosynthesis of picoplankton in the oligotrophic ocean. Nature, 301:702-704.
Porter, K. G. & Feig, Y. S. 1980. The use of DAPI for identifying and counting aquatic microflora. Limnol. Oceanogr., 25 (5): 943-948.
Sheldon, R. W. 1972. Size separation of marine seston by membrane and glass fiber filters. Limnol. Oceanogr., 17:494-498.
Waterbury, J. B.; Watson, S. W.; Guillard, R. R. L. & Brand, L. E. 1979. Widespread occurrence of a unicellular marine planktonic cyanobacterium. Nature, 277:293-294. Waterbury, J. B.; Willey, J. M.; Franks, D. G.; Valois, F. W. & Watson, S. W. 1985. A cyanobacterium capable of swimming motility. Science, 230:74-76.