ON THE DETERMINATION OF A CONVERSION FACTOR FROM LABELLED
THYMIDINE INCORPORATION BY BACTERIA TO CELL PRODUCTION IN A
SUB-TROPICAL ESTUARY: PRELIMINARY RESULTS
José Juan Barrera-Alba1; Sônia Maria Flores Gianesella1; Flávia Marisa Prado Saldanha-Corrêa1; & Gleyci Aparecida Oliveira Moser2
1
Instituto Oceanográfico da Universidade de São Paulo (Praça do Oceanográfico, 191 05508-900, São Paulo, SP, Brasil)
2
Faculdade de Ciências Ambientais - Oceanografia. Centro Universitário Monte Serrat - UNIMONTE.
(Campus Ponta da Praia, Av. Saldanha da Gama, 89, 11030-220, Santos, SP, Brasil)
Bacterial carbon production has become a key parameter in quantifying carbon flows through aquatic food webs (Smith & Azam, 1992). Measurement of
3
H-Thymidine (3H-TdR) incorporation into bacterial DNA is a useful method to determine bacterial cell production in seawater, freshwater and sediment (Fuhrman & Azam, 1980; Riemann et al., 1982; Moriarty & Pollard, 1981). Fuhrman & Azam (1980) related the need of an adequate conversion factor to estimate of bacterial cell production from 3H-TdR incorporation into DNA, and since then several authors have discussed methodological aspects.
On the basis of theoretical considerations, a factor ranging between 0.2 to 1.3 x 10¹⁸ cells per mol of incorporated 3H-TdR has been proposed (Fuhrman & Azam, 1980). Empirical conversion factors have also been determined by simultaneous measurements of rates of 3H-TdR incorporation and cell production computed from direct counts for different marine environments around the world. The large range of variation for this factor may be found among these studies due to both high conversion factors derived from (3H-TdR) isotope dilution (Moriarty, 1984) and
to the characteristics of the different environment and climatic condition under consideration, and it was demonstrated that the coupling between population growth and 3H-TdR is not uniform (Riemann et al.,
1987). Up to this moment, no conversion factor was proposed in the literature on tropical or sub-tropical estuaries, as well. In this sense, the present work represents a first effort to determine a conversion factor for a sub-tropical estuary.
On May 2004, estuarine water (salinity 22; temperature 24ºC) from the inner portion of the Cananéia Estuarine System, at Cananéia Sea (25º00’S, 47º54’W), Brazil, was collected to estimate an empirical conversion factor for labeled thymidine incorporation to cells produced. Cell production rate __________
Contr. no. 863 do Inst. oceanogr. da Usp.
was empirically estimated on dilution culture experiment by correlation of changes in cell abundance and 3H-TdR uptake rates (Kirchman et al., 1982). The experiment used bacterial culture media prepared by filtering an aliquot of estuarine water sample onto 1µm NUCLEPORE polycarbonate filters. Another aliquot was filtered through a GELMAN pleated capsule with 0.2 µm Versapor membrane. The sample filtered in 1µm was then diluted in a ratio of 1:10 with the 0.2 µm filtered water. A total bacterial culture volume of 2000 ml was incubated for 40h in the dark, at room temperature, which varied from 22.5 to 26.2ºC. The culture was sub-sampled at 5h intervals for determination of cell abundance and bacterial secondary production experiments (3H-TdR incorporation rate). For cell abundance determination three aliquots of 2-3 ml were stained with DAPI (1 µg ml-1 final concentration) for 10 minutes and filtered onto black 0.2 µm PORETICS polycarbonate membrane filters. The filters were laid on microscope slides between layers of immersion oil, and cells were counted under a ZEISS JENALUMAR epifluorescence microscope under 1000x magnification using a UV filter combination (Porter & Feig, 1980). Secondary production followed the method proposed by Smith & Azam (1992) but using
3
at 12000 rpm and the liquid was aspirated. The samples were washed by the addition of 1.25 ml of ice-cold TCA 5%, vortex mixed, centrifuged and aspirated. This process was repeated three times and then 1.5 ml of scintillation cocktail (Bray, 1960) was added and vortexed. The micro-centrifuge tubes were placed into scintillation vials and radioassayed in a liquid scintillation spectrometer (PACKARD Tri-Carb1600). DPM counts were converted to mols of incorporated 3H-TdR l-1 h-1 according to the equation proposed by Bell (1993):
[
]
313 10 * * * ) 10 * 5 . 4 ( * − − − = V t SA dpm dpm
v sample blank
(mol 3H-TdR l-1 h-1) (1)
where 4.5 x 10⁻¹³ is the number of curies per dpm; SA is the specific activity of the 3H-TdR added to the sample in curies per mmol; t is the incubation time in h; V is the incubation volume in l; and 10-3 is the correction from mmol to mol.
The conversion factor (C) from 3H-TdR incorporation to the number of cells produced at the same time interval was computed by the derivative method described by Kirchman et al. (1982) and modified by Bell et al. (1983):
) ( ) ( t v t N
C=
µ
cells (mol 3H-TdR) -1 (2)where N(t) and ν(t) are, respectively, the bacterial abundance and the incorporation rate at any time, and µ is the slope of lnN(t) versus time, i.e. the growth rate (h-1).
The conversion factor was also computed by the integrative method described by Riemann et al.
(1987) which considers the number of bacterial cells produced at a selected time interval of the experiment (the final abundance minus the initial abundance at the time interval) divided by the total amount of 3H-TdR incorporated during the same interval:
t i f v t N t N C ∆ −
= ( ) ( ) cells (mol 3H-TdR) -1 (3)
Another way to calculate the conversion factor was presented by Ducklow & Hill (1985):
To No e
No
C=
δ
*b ≈µ
* cells (mol 3H-TdR) -1 (4)where No and To are, respectively, the bacterial
abundance and the incorporation rate at time = 0, µ is
the slope of linear regression of ln(N) vs. time, and δ and b are respectively the slope and y-intercept of linear regression of ln(T) vs. time.
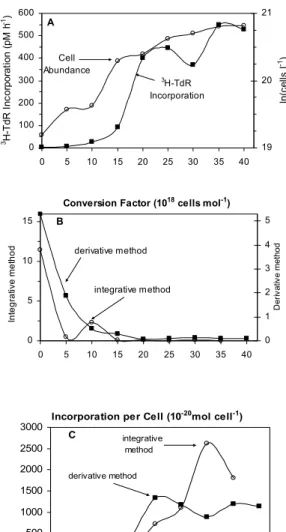
As bacterial grazing was minimized by filtration and dilution with 0.2 µm-filtered water, bacterial abundance increased exponentially as indicated on Figure1A. After 25h of incubation, the growth rate decreased, and the last 10 hours represent a stationary phase. A maximum cell number of 1.1x10⁹ cells l-1 was recorded at the end of the experiment (Table 1). The maximum growth rate was 0.0421 h-1, a value comparable with those obtained by Kirchman & Hoch (1988) in the Delaware Estuary (Table 2). The incorporation rate of 3H-TdR both per h-1 and per cell, showed an increase after 15 h, corresponding to the end of the exponential phase of the growth curve (Figs 1A and 1C). Some researchers observed an uncoupling between TdR incorporation and cell number increase, especially due to a lag phase experienced by bacteria after the beginning of the experiment with filtered or diluted water (Rieman et al., 1987).
based on the initial incorporation rate, it can be biased by the artifacts discussed by Kirchman & Hoch (1988), resulting in an overestimated conversion factor. These results show the difficulty of this task since there is a high variation depending on the considered algorithm, and there is little information about which one was used by each author to compare our results. 0 100 200 300 400 500 600
0 5 10 15 20 25 30 35 40
3H -T dR I nc or por at ion ( pM h -1) 19 20 21 ln (c e lls l -1) Cell Abundance 3H-TdR Incorporation A
Conversion Factor (1018 cells mol-1)
0 5 10 15
0 5 10 15 20 25 30 35 40
In te g ra ti v e m e th o d 0 1 2 3 4 5 D e ri va tive m e th o d derivative method integrative method B
Incorporation per Cell (10-20mol cell-1)
0 500 1000 1500 2000 2500 3000
0 5 10 15 20 25 30 35 40 time (h)
derivative method integrative method
C
Fig. 1. Bacterial growth experiment in May 2004 to estimate conversion factor for the thymidine (3H-TdR) method. (A)
Bacterial abundance (cells l-1) and Thy incorporation rate pM
(3H-TdR) h-1; (B) Conversion factors (1018 cells (mol 3
H-TdR)-1) calculated by the derivative (eq. 2) and integrative
(eq. 3) methods and (C) 3H-TdR Incorporation rates of per cell (10-20 mol 3H-TdR cell-1).
It should be noted that even though the present paper considered a single trial from a single location, it is a necessary step to establish an appropriate set ofconversion factors to a sub-tropical estuary, providing a basis to compare the obtained factors with those obtained from temperate environments. TdR metabolism could also result in tritium incorporation in macromolecules indistinguishable from DNA by the simple extraction and hydrolysis procedures typically used to separate incorporated from unincorporated TdR (Hollibaugh, 1988). A number of authors have reported that 3H-TdR labels other macromolecules as
well as DNA, and it can be a significant source of error in bacterioplankton productivity estimates in certain environments (see in Hollibaugh, 1988). But, in spite of this, and based on: 1- the theoretical assumption that 3H-TdR is incorporated exclusively into cellular DNA (Fuhrman & Azam, 1980); 2- that in most environments, 3H-TdR appears to be incorporated specifically, or almost specifically, into DNA by microbial assemblages (see in
Hollibaugh, 1988); and 3- that our conversion factors, both calculated by integrative and derivative methods, were similar to those found in different estuarine systems and inside the range of theoretical ones, the present data constitute a reference for future studies on bacterial production in Brazilian estuaries.
The great variety of environmental conditions in tropical estuaries both due to hydrographic gradients and to temporal variation (tidal stages, annual cycle, etc) can hinder the establishment of a unique conversion factor. Another source of uncertainty for the measurement of bacterial production is the carbon content per bacterial cell. Therefore, a complete study to provide both a set of conversion factors and an estimation of carbon content per bacterial cell over an annual cycle, comparing different estuaries or along salinity gradients and tidal stages (e.g.) is, actually, necessary to an improved determination of bacterial productivity.
A
CKNOWLEDGMENTSTable 1. Mean cell abundance (N), standard deviation of abundance and incorporation rates of 3H-TdR along the incubation
experiment.
Time (h) 0 5 10 15 20 25 30 35 40
N(x 108 cells l-1) 2.16 3.15 3.34 6.52 7.17 9.00 9.85 10.88 11.01
std.dev. (x 108 cells l-1) 0.88 0.89 0.84 0.85 0.89 0.93 0.78 0.75 0.84
v(x 1012 mole 3H-TdR l-1 h-1) 1.72 7.00 27.81 92.18 402.75 445.37 369.53 550.26 528.64
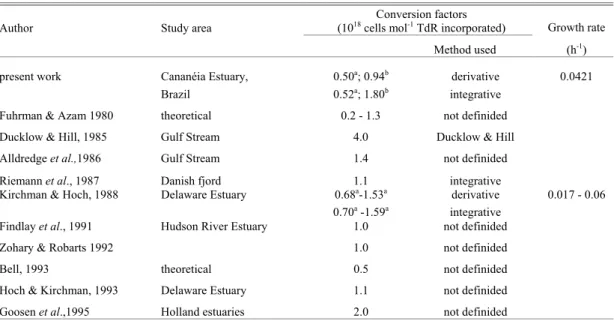
Table 2. Growth rate and mean conversion factors calculated for this experiment and by others authors.
Author Study area
Conversion factors
(1018 cells mol-1 TdR incorporated) Growth rate
Method used (h-1)
present work Cananéia Estuary, 0.50a; 0.94b derivative 0.0421
Brazil 0.52a; 1.80b integrative
Fuhrman & Azam 1980 theoretical 0.2 - 1.3 not definided Ducklow & Hill, 1985 Gulf Stream 4.0 Ducklow & Hill Alldredge et al.,1986 Gulf Stream 1.4 not definided
Riemann et al., 1987 Danish fjord 1.1 integrative
Kirchman & Hoch, 1988 Delaware Estuary 0.68a-1.53a derivative 0.017 - 0.06
0.70a -1.59a integrative
Findlay et al., 1991 Hudson River Estuary 1.0 not definided
Zohary & Robarts 1992 1.0 not definided
Bell, 1993 theoretical 0.5 not definided
Hoch & Kirchman, 1993 Delaware Estuary 1.1 not definided Goosen et al.,1995 Holland estuaries 2.0 not definided
a
calculated without considering < 5h factor conversion
b calculated considering < 5h factor conversion
Rest of factor conversion has not information about algorithm used.
R
EFERENCESBell, R. T. 1993. Estimating production of heterotrophic bacterioplankton via incorporation of tritiated thymidine. In: Kemp, P.; Sherr, B.; Sherr, E. & Cole, J. eds. Handbook of methods in aquatic microbial ecology. Lewis Publishers, Inc. p. 495-503.
Bell, T. B.; Ahlgren, G. M. & Ahlgren, I. 1983. Estimating bacterioplankton production by measuring 3H-thymidine
incorporation in a eutrophic Swedish lake. Appl. environ. Microbiol., 45:1709-1721.
Bray, G. A. 1960. A simple efficient liquid scintillator for counting aqueous solution in a liquid scintillation counter. Analyt. Biochem., 1:279-285.
Ducklow, H. W. & Hill, S. 1985. Tritiated thymidine incorporation and the growth of heterotrophic bacteria in warm core rings. Limnol. Oceanogr., 30:260-272. Fuhrman, J. A. & Azam, F. 1980. Bacterioplankton
secondary production estimates for coastal waters of British Columbia, Antarctica, and California. Appl. environ. Microbiol., 39:1085-1095.
Hollibaugh, J. T. 1988. Limitations of the [3H]thymidine
method for estimating bacterial productivity due to thymidine metabolism. Mar. Ecol. Prog. Ser., 43:19-30. Kirchman, D. L. & Hoch, M. P. 1988. Bacterial production
Kirchman, D.; Ducklow, H. & Mitchell, R. 1982. Estimates of bacterial growth from changes in uptake rates and biomass. Appl. environ. Microbiol., 49:1296-1307.
Moriarty, D. J. W. 1984. Measurements of bacterial growth rates in some marine systems using the incorporation of tritiated thymidine into DNA. In: Hobbie, J. E. & Williams, P. J. le B eds. Heterotrophics activity in the sea. New York, Plenum Press. p. 217-231.
Moriarty, D. J. W. & Pollard, P. C. 1981. DNA synthesis as a measure of bacterial productivity in seagrass sediments. Mar. Ecol. Prog. Ser., 5:151-156.
Porter, K. G. & Feig, Y. S. 1980. The use of DAPI for identifying and counting aquatic microflora. Limnol. Oceanogr., 25(5):943-948.
Riemann, B.; Fuhrman, J. A. & Azam, F. 1982. Bacterial secondary production in freshwater measured by 3
H-thymidine incorporation method. Microb. Ecol., 8:101-114.
Riemann, B.; Bjørnsen, P. K.; Newell, S. & Fallon, R. 1987. Calculation of cell production of coastal marine bacteria based on measured incorporation of 3H-thymidine.
Limnol. Oceanogr., 32:471-476.
Smith, D. C. & Azam, F. 1992. A simple, economical method for measuring bacterial protein synthesis rates in seawater using 3H-leucine. Mar. microbiol. Food Webs,
6(2):107-114.