ISSN 1553-3468
© 2011 S. Ponkumar et al., This open access article is distributed under a Creative Commons Attribution (CC-BY) 3.0 license
Corresponding Author: Iyandurai, N., Department of Physics, Thiruvalluvar Government Arts College, Rasipuram-637401, TamilNadu, India
Structural Analysis of DNA Interactions with
Magnesium Ion Studied by Raman Spectroscopy
Ponkumar, S., P. Duraisamy and N. Iyandurai
Department of Physics, Thiruvalluvar Government Arts College,
Rasipuram-637 401, TamilNadu, India
Abstract: Problem statement: In the present study, FT Raman spectroscopy had been used
to extend our knowledge about Magnesium ion - DNA interactions at various volume ratios (1:50, 1:20, 1:10 and 1:5). Approach: The analysis of FT Raman data supported the existence of structural specificities in the interaction and also the stability of DNA secondary structure. Results: Results from the Raman spectra clearly indicate that the interaction of Magnesium ion with DNA is mainly through the phosphate groups of DNA with negligible change of the B-conformation of DNA at all the volume ratios studied. For example, band at 1079 cm−1 is assigned to the symmetrical stretching vibration of the nucleic acid phosphodioxy (PO-2) group. This band in the order 1079→ 1075→ 1070→ 1066→ 1063 cm−1 at all Magnesium ion DNA concentrations studied. Similarly, Raman band at 845 cm−1 due to antisymmetrical phosphodiester (O-P-O) stretching of DNA. Conclusion: Magnesium ion interaction with the DNA phosphate is weak in comparison to interactions with the bases. On the other hand, the Raman signature of B-DNA is largely unperturbed by magnesium ion, suggesting much weaker interactions.
Key words: Stretching vibration, B conformation, FT Raman data, FT Raman
spectroscopy, Raman spectra, volume ratios, nucleic acids, magnesium deficiency, stacking interactions
INTRODUCTION
Metal ions are essential for the biological activity of nucleic acids, as well as the characteristics that can prove harmful, result from the interaction of metals to nucleic acids. It is for this reason that studies of the effects of metal interaction in nucleic acids are very much important. Magnesium deficiency causes renal complications. The appearance of several diseases is related to its depletion in the human body (Anastassopoulou and Theophanides, 2002). The binding of metals by nucleosides and nucleotides has been investigated for a number of years. Because of recent observations that some metal ions cause chromosome damage and consequently is mutagenic, there is renewed interest in the binding of heavy metals to polynucleotide. Interestingly, binding of Magnesium ions to the
backbone phosphate groups may play role in enhancing the lifetime of the open state of the DNA base pairs, thus accelerating the regulatory process of genetic information transfer. The alkaline earth metals also play the role of stabilizing the double helix by neutralization of the negative changes on the phosphate groups. Remarkably, extreme stabilization by metal ions can lead to rather adverse result, i.e., the mis-pairing of bases. Since the correct propagation of the genetic code requires the correct complementary base pairing, mis-pairing can lead to error (Printz and Hippel, 1965).
136 analyze the effect of Magnesium ion on DNA at various volume ratios.
MATERIALS AND METHODS
Highly polymerized calf-thymus DNA sodium salt (6.2% sodium content, 13% H2O content) and were purchased from Sigma Chemical Co. DNA was deproteinated by the addition of CHCl3 and isoamyl alcohal in NaCl solution. Sodium-DNA was dissolved in 50mM NaCl (pH 7.20) at 5°C for 24 h with occasional stirring to ensure the formation of a homogeneous solution.
The appropriate amount of magnesium ion (50 mM) was prepared in distilled water and added drop wise to the DNA solution to attain the desired Magnesium ion - DNA (1:50, 1:20, 1; 10 and 1:5), volume ratios. The pH of all the solutions was adjusted at 7.
FT Raman measurements: FT Raman spectra
were recorded in a Bruker Equimox 55 FT spectrometer supplied with a Raman module. Spectra are applied at the spectral resolution of 2cm−1, using excitation radiation wave number at 1064 nm from Nd-YAG laser working at 500 mW. We used a standard quartz cell for liquids (1-cm section) where approximately 1 mL of the solutions was placed. Backscattering collection of the Raman radiation was performed using a mirror behind the cell and minimum of 2000 scans were accumulated in all case to enhance the signal-to-noise ratios. Raman spectra were recorded between 600 and 1800 cm−1. The Raman spectra of Magnesium
ion-DNA complexes at various volume ratios (1:50, 1:20, 1:10 and 1:5) are recorded.
RESULTS AND DISCUSSION
Analysis of FT Raman spectroscopic data: The
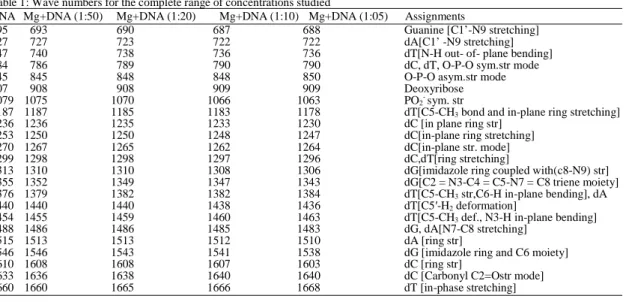
FT Raman spectra of calf-thymus DNA and Magnesium ion - DNA complexes (1:50, 1:20, 1:10 and 1:5 volume ratios) are displayed in Fig. 1 and Table 2 shows the relevant wave numbers for the complete range of concentrations studied.
Fig. 1: FT Raman spectrum of calf thymus DNA and Magnesium ion – DNA complexes (1:50, 1:20, 1:10 and 1:5 volume ratios)
Table 1: Wave numbers for the complete range of concentrations studied
DNA Mg+DNA (1:50) Mg+DNA (1:20) Mg+DNA (1:10) Mg+DNA (1:05) Assignments
695 693 690 687 688 Guanine [C1’-N9 stretching]
727 727 723 722 722 dA[C1’ -N9 stretching]
747 740 738 736 736 dT[N-H out- of- plane bending]
784 786 789 790 790 dC, dT, O-P-O sym.str mode
845 845 848 848 850 O-P-O asym.str mode
907 908 908 909 909 Deoxyribose
1079 1075 1070 1066 1063 PO2- sym. str
1187 1187 1185 1183 1178 dT[C5-CH3 bond and in-plane ring stretching]
1236 1236 1235 1233 1230 dC [in plane ring str]
1253 1250 1250 1248 1247 dC[in-plane ring stretching]
1270 1267 1265 1262 1264 dC[in-plane str. mode]
1299 1298 1298 1297 1296 dC,dT[ring stretching]
1313 1310 1310 1308 1306 dG[imidazole ring coupled with(c8-N9) str]
1355 1352 1349 1347 1343 dG[C2 = N3-C4 = C5-N7 = C8 triene moiety]
1376 1379 1382 1382 1384 dT[C5-CH3 str,C6-H in-plane bending], dA
1440 1440 1440 1438 1436 dT[C5′-H2 deformation]
1454 1455 1459 1460 1463 dT[C5-CH3 def., N3-H in-plane bending]
1488 1486 1486 1485 1483 dG, dA[N7-C8 stretching]
1515 1513 1513 1512 1510 dA [ring str]
1546 1546 1543 1541 1538 dG [imidazole ring and C6 moiety]
1610 1608 1608 1607 1603 dC [ring str]
1633 1636 1638 1640 1640 dC [Carbonyl C2=Ostr mode]
The FT Raman spectra of the Magnesium ion - DNA at various volume ratios show wave number shifts, indicating that interactions are present without condensation.
Interpretation of FT Raman spectra of solutions in water: Raman bands in the 600-800 cm−1
regions occur due to C-C and C-N bonds of the base residues, which stretch and contract in phase. Such a ring breathing vibrations invariably give often the most intense Raman bands in the spectrum (Thomas, 1970).
The Raman band observed at 695 cm−1 of calf thymus DNA is assigned to breathing motion of the guanine coupled through the C1’-N9 glycoside bond to a deoxyribose vibration (Benevides et al., 1984). The 695 cm−1 band also characterizes the C2’-endo/anti conformation of B-DNA in aqueous solution (Kiefer, 2007). In Magnesium ion - DNA spectrum the 695 cm−1 band of metal free DNA shifts in the order 695→693→690→687→688 cm−1 at all the concentrations studied. This result indicate that in the presence of Magnesium ions the B-form structure is melted and the population of dG conformers changes from predominantly C2’-endo/anti to a mixture of C2’-endo/anti and C2’-endo/syn conformers. Duguid et al. (1993) observed similar spectral changes in the study of Raman spectroscopy of DNA – metal complexes.
The sugar coupled adenine vibration observed at 727 cm−1 in metal free DNA is observed at 727, 723 and 722 cm−1 in Magnesium ion -DNA complexes, which may be due to strong interaction of the bases with one another or with the metal ions. Harada and Takeuchi, (1986) observed similar results in the Raman spectra of tryptophan and related compounds. The N-H out-of plane bending vibration of thymine near 747 cm−1 of metal free DNA identifies the C2’ endow/anti conformers of dT (Rush and Peticolas, 1995). In Magnesium ion-DNA complexes, the 747 cm−1 band of DNA shifts to lower frequency in the order 747→ 740→738→736 cm−1, which indicates that the tensional rotations about the glycosyl bond become more flexible in Magnesium ion - DNA complexes. Duguid et al. (1996) have observed similar results.
The 784 cm−1 band is the composite of two major bands, one due to the cytosine ring breathing mode (Tajmir-Riahi et al., 1988) and the other due to phosphosiester symmetric stretching vibration (Dam et al., 2002). The cytosine vibration is sensitive to deputation exocyclic substitution while the phosphodiester vibration is less sensitive to deputation. The thymidine vibration, which
involves both significant contribution from deoxyribose ring and dominant contribution from the thymine vibration, is sensitive to C2’ deuteration (Tsuboi et al., 1997). The appearance of the cytosine vibration at higher frequency at 790 cm−1 in Magnesium ion -DNA (higher concentration) spectrum indicates that Magnesium ions react readily with the N3 atom of cytosine.
Raman bands in the 750-850 cm−1 spectral intervals have been assigned to vibrations which involve a large contribution from oxygen-phosphorous stretching of the phosphodiester (O-P-O) linkages (Ruiz-Chica et al., 2001) and oxygen-phosphorous stretching of the phophodioxy (PO2) group (Nafisi et al., 2008). Because of obvious coupling between sugar and phosphate groups, these bands are extraordinarily sensitive to the nucleic acid backbone conformation and provide a firm empirical basis for DNA conformational analysis (Nafisi et al., 2008). FT-Raman spectrum of calf thymus DNA exhibits a band at 845 cm−1 due to ant symmetrical phosphodiester (O-P-O) stretching (Ruiz-Chica et al., 2001). This band is considered as diagnostic B conformation (Nafisi et
al., 2008). The 845 cm−1 frequency originates from vibrations associated with the 3’ 5’ - phosphodiester network (C-O-P-O-C). The 845 cm−1 band is shifted in the order 845→ 848→ 850 cm−1 at all the Magnesium ion - DNA complex ratios studied. This is an indicative of a wide distribution of torsion angles in the backbones of Magnesium ion – DNA. Thomas III Rush and Warner, 1995 pragmatic show the matching results in an ab initio transform calculation of resonance Raman spectra of uracil, 1-methyluracil and 5-methyluracil.
138 1075→ 1070→ 1066→ 1063 cm−1. This effect is due to interaction of Magnesium ions with the ionized PO–2 groups through water molecules (outer-space interactions or, more generally, formation of water-separated in pairs). The effect of the metal action in this Mg2+----O(H)-H----O2P type of aggregate is to increase the acidity of the water molecules and to strengthen the hydrogen bond affecting the phosphate group, causing a decrease in frequency of the symmetric stretch PO– 2 vibration (Toyama et al., 1993).
Raman bands in 1180-1600 cm−1 region of the Raman spectrum arises primarily from conjugated CC, CN and CO in-plane stretching modes of the urine and pyramiding bases in which adjoining bonds stretch with 180º phase difference (Aida et
al., 1997). These Raman bands have the potential
for diagnosis of nucleic acid secondary structure. The FT-Raman spectrum of DNA in H2O solution exhibits bands at 1187 and 1236 cm−1. These two bands have been assigned to vibrations involving stretching of exocyclic C5-CH3 bond of thymine and in-plane ring vibrations of cytosine (Rush and Peticolas, 1995). In the presence of Magnesium ions the 1187 cm−1 thymine band of metal free DNA shifts in the order 1187→ 1185
→1183→ 1178→ 1177 cm−1, the lower frequency shift is due to a decrease in electron delocalization in the thymine bases as DNA melts and the metal ion interaction with the melted structure. Duguid et
al. (1993) have observed similar frequency shift
during thermal denaturation of calf-thymus DNA. Similarly the 1236 cm−1 band shifts in the order 1236→ 1235→ 1233→ 1230 in the presence of Magnesium ions. These effects are attributed to partial disruption of A-T base pairs and metal binding at N3 atom of thymine and cytosine.
Three bands are observed in the FT-Raman spectrum of DNA at 1253, 1270 and 1299 cm−1. The first two bands are due to ring stretching vibration of cytosine, while the 1299 cm−1 band is due to ring stretching vibration of both cytosine and thymine (Spiker and Levin, 1975). All these bands shifted downwards to several cm−1 in presence of Magnesium ions indicating interactions are present. The FT-Raman spectrum of DNA shows a band 1313 cm−1 due to guanine imidazole ring coupled with C8-N9 stretching vibration (Iyandurai and Sarojini, 2009). This band is shifted in the order 1313→ 1310→ 1308→ 1306 cm−1 upon complex formation with Magnesium ions. Similarly, Raman band observed at 1355 cm−1 band in H2O solution has been assigned to a guanine imidazole ring mode of the C2 = N3–C4 = C5–N7 = C8 triene moiety (Iyandurai and Sarojini,
2009) which shifts in the order 1355→ 1352→
1349→ 1347→ 1343 cm−1 at all the Magnesium ion -DNA complexes studied. The results suggest partial denaturation of DNA in the presence of metal ions and metal ion binding with the denatured structure. Duguid et al. have made similar observations in Raman spectra of calf-thymus DNA in the presence of divalent metal ions during thermal denaturation (Duguid et al., 1993).
The intense band at 1376 cm−1 is assigned to in-plane ring vibration (Iyandurai and Sarojini, 2009) and C6-H in plane bend vibration of thymine. This normal mode also involves the exocylic C5-CH3 group of thymine and is sensitive to the methyl group environment. Adenine also contributes to this intense band (Po et al., 2007). This band shifts to higher frequency side in the presence of Magnesium ion indicating metal binding at N3 atom thymine and adenine. Raman band at 1440 cm−1 has been assigned to C5’-H2 deformation of thymine. This band is shifted to 1436 cm−1 at higher Magnesium ion - DNA concentration. This shows minor C5’-H2 deformation of thymine. The Raman band measured at 1454 cm−1 in the Raman spectrum of DNA has been assigned to the deoxyribose moieties (Iyandurai and Sarojini, 2009). They correspond to ethylene bending modes, although they should also have some contributions from adenine vibrations. This band shifts in the order 1454→ 1455→ 1459→ 1460→ 1463 cm−1 at all Magnesium ion -DNA complexes studied.
The 1488 cm−1 band of FT-Raman spectrum has been assigned to a vibration involving a large displacement of N7 and C8 atoms of urine (guanine and adenine) (Po et al., 2007). The guanine contribution is greater, approximately threefold larger than that of adenine. The band has great diagnostic value, both as a monitor of deuterium exchange kinetics of the urine C8H group and as an indicator of urine N7 hydrogen bonding interactions. The present result shows metal ion binding at N7 position of guanine through water molecule. The effect of the metal ion in this Mg2+-O(H)--H--N7 type of aggregate is to increase the strength of the hydrogen bonds between the N7 of guanine and hydrogen of water, causing a decrease in frequency of the 1488 cm−1 band.
concentration this band exhibits shift in the order 1515
→
1510 and 1546→
1538 cm−1 indicating guanine contributes more than an adenine.The region 1600-1750 cm−1 in Raman spectrum is often called the “double-bond region” contains bands due to stretching vibrations of double bonds including carbonyl groups of C, G and T. Also the bands in this region include contributions from in-plane deformations of NH groups of G (amino and amino), C (amino) and T (amino). The 1610 cm−1 band of metal free DNA due to ring stretching vibration of cytosine shifts to
lower frequency in the order
1610
→
1608→
1607→
1603 cm−1 in Magnesium ion -DNA complexes. This result indicates metal binding at N3 atom of cytosine. The 1630 cm−1 band of metal free DNA assigned to C2=O stretching and NH2 scissoring vibration (Moreira et al., 2008) of cytosine shifts to higher frequencynear 1640cm−1 in Magnesium ion -DNA (1:5 volume ratio) complex spectrum. Ordinarily, the frequency of a C = O stretching vibration increases with decreasing hydrogen-bonded strength (Tomlinson and Peticolas, 1970). The elevated C2 = O frequency in the complex spectrum reflects carbonyls less strongly hydrogen bonded in the Magnesium ion - DNA complex than in the metal-free DNA. The Raman band observed at 1660 cm−1 in metal free DNA, due to thymine in-phase stretching of C5-C6, C2 = O and C4 = O vibrations exhibits small shift in the order 1660
→
1665→
1666→
1668 cm−1 in Magnesium ion-DNA complexes indicating unshackling of the A-T base pairs.CONCLUSION
The FT-Raman spectra of DNA with Magnesium ion interpret that the ion bind to the phosphate groups of DNA, with negligible change of the B-conformation of DNA. The ribose moieties of all Magnesium ion-DNA complexes have a mixture of C2’-endo and C3’endo sugar bucker. Magnesium ions interact (via H2O) with acceptor sites on the urine (N7) rings and make tensional rotations about the glycosyl bond more flexible. A notable exception is an extensive perturbation by magnesium ions on pyrimidine (N3) ring. Various bands assigned to urine and pyramiding vibrations in the region 1200-1600 cm−1 are sensitive to base unshackling (elimination
of hypo chromic effect) in Magnesium ion - DNA complexes.
REFERENCES
Aida, M., M. Kaneko, M. Dupuis, T. Ueda and K. Ushizawa et al., 1997. Vibrational modes in thymine molecule from an ab initio MO calculation. Spectrochimica Acta Part A: Mol. Biomol. Spectroscopy, 53: 393-407. DOI: 10.1016/S1386-1425(96)01811-2
Anastassopoulou, J. and T. Theophanides, 2002. Magnesium-DNA interactions and the possible relation of magnesium to carcinogenesis. Irradiation and free radicals, Crit. Rev. Oncol. Heamatol., 42: 79-91. PMID: 11923070 Aubrey, K.L., S.R. Casjens, G.J. Thomas Jr., 1992.
Secondary structure and interactions of the packaged dsDNA genome of bacteriophage P22 investigated by Raman difference spectroscopy. Biochemistry, 31: 11835-11842. PMID: 1445916
Benevides, J.M., A.H.J., Wang, G.A.V.D. Marel, J.H.V. Boom and A. Rich et al., 1984. The Raman spectra of left-handed DNA oligomers incorporating adenine-thymine base pairs, Nucl. Acids Res., 12: 5913-5925. DOI: 10.1093/nar/12.14.5913
Bruce, C., 2007. FT-Raman spectroscopy: A catalyst for the raman explosion? J. Chem. Educ., 84: 75-75. DOI: 10.1021/ed084p75 Dam, L.V., N. Korolev and L. Nordenskiold, 2002.
Polyamine-nucleic acid interactions and the effects on structure in oriented DNA fibers. Nucl. Acids Res. 30: 419-428. DOI: 10.1093/nar/30.2.419
Duguid, J., V.A. Bloomfield, J. Benevides and G.J. Thomas Jr., 1993. Raman spectroscopy of DNA-metal complexes. I. Interactions and conformational effects of the divalent cations: Mg, Ca, Sr, Ba, Mn, Co, Ni, Cu, Pd and Cd. Biophys. J., 65: 1916-1928. PMCID: PMC1225927
Guan, Y. and G.J. Thomas Jr., 1996. Vibrational analysis of nucleic acids. III. Conformation-dependent Raman markers of the phosphodiester backbone modeled by dimethyl phosphate. J. Mol. Structure, 379: 31-41. DOI: 10.1016/0022-2860(95)09059-2.
140 Iyandurai, N. and R. Sarojini, 2009.
Selenomethionine induced changes on the binding of spermine with DNA: A study by fourier transform raman and fourier transform infra red spectroscopy. Int. J. Pharmacol., 5: 126-136. DOI: 10.3923/ijp.2009.126.136 Kiefer, W. and A. Beckmann, 1984. Non-linear
coherent Raman spectroscopy. J. Mol. Structure, 113: 83-99. DOI: 10.1016/0022-2860(84)80135-0
Kiefer, W., 2007. Recent advances in linear and nonlinear raman spectroscopy I. J. Raman Spectroscopy, 38: 1538-1553. DOI: 10.1002/jrs.1902
Moreira, L.M., L. Silveira Jr., F.V. Santos, J.P. Lyon and R. Rocha et al., 2008. Raman spectroscopy: A powerful technique for biochemical analysis and diagnosis. Spectroscopy, 22: 1-19. DOI: 10.3233/SPE-2008-0326
Nafisi, S., M. Hashemi, M. Rajabi and H.A. Tajmir-Riahi, 2008. DNA adducts with antioxidant flavonoids: Morin, apigenin and naringin. DNA Cell Biol., 27: 433-442. DOI: 10.1089/dna.2008.0735
Po, A., R.A. Bitar, K. Yassoyama, H. Martinho and A.M. Santo et al., 2007. Study of normal colorectal tissue by FT-Raman spectroscopy. analytical Bioanalytical Chem., 387: 1643-1648. DOI: 10.1007/s00216-006-0819-1 Printz, M.P. and P.H.V. Hippel, 1965. Hydrogen
exchange studies of DNA structure. Proc. Nat. Acad. Sci. U. S. A., 53: 363-370. PMID: 14294070
Ruiz-Chica, A.J., A.R. Khomutov, M.A. Medina, F. Sanchez-Jimenez and F.J. Ramirez, 2001. Interaction of DNA with an aminooxy analogue of spermidine-an IR and FT-Raman approach. J. Mol. Structure, 565-566: 253-258. DOI: 10.1016/S0022-2860(00)00842-5
Rush, T.I. and W.L. Peticolas, 1995. Ab Initio transform calculation of resonance raman spectra of uracil, 1-Methyluracil and 5-Methyluracil. J. Phys. Chem., 99: 14647-14658. DOI: 10.1021/j100040a012
Spiker Jr., R.C. and I.W. Levin, 1975. Raman spectra and vibrational assignments for dipalmitoyl phosphatidylcholine and structurally related molecules. Biochimica Biophys. Acta, 388: 361-373. PMID: 1137716 Tajmir-Riahi, H.A., M. Langlais and R. Savoie,
1988. A laser Raman spectroscopic study of the interaction of calf-thymus DNA with Cu(II) and Pb(II) ions: Metal ion binding and DNA conformational changes. Nucleic Acids Res., 16: 751-762. DOI: 10.1093/nar/16.2.751 Thomas Jr., G.J., 1970. Raman spectral studies
of nucleic acids: III. Laser-excited spectra of ribosomal RNA. Biochim. Biophys. Acta (BBA)-Nucleic Acids Protein Synthesis, 213: 417-423. DOI: 10.1016/0005-2787(70)90049-3
Thomas Jr., G.J., J.M. Benevides, S.A. Overman, T. Ueda and K. Ushizawa et al., 1995. Polarized Raman spectra of oriented fibers of A DNA and B DNA: Anisotropic and isotropic local Raman tensors of base and backbone vibrations. Biophys. J., 68: 1073-88. PMID: 7756527
Tomlinson, B.L. and W.l. Peticolas, 1970. Conformational dependence of Raman scattering intensities in polyadenylic acid. J Chem. Phys., 52: 2154-2156. PMID: 5445421 Toyama, A. Y. Takino, H. Takeuchi and I. Harada,