Printed in Brazil - ©2004 Sociedade Brasileira de Química 0103 - 5053 $6.00+0.00
A
r
ti
c
le
* e-mail: [email protected]
Fourier Transform Infrared Determination of Imidacloprid in Pesticide Formulations
Guillermo Quintás, Sergio Armenta, Salvador Garrigues* and Miguel de la Guardia
Department of Analytical Chemistry, University of Valencia, Edifici Jeroni Muñoz, 50th Dr. Moliner, 46100 Burjassot, Valencia, Spain
Foi desenvolvido um método simples usando Infra-Vermelho com Transformada de Fourier (IRFT) para a determinação de Imidaclopride em formulações pesticidas. As amostram foram diluídas com CHCl3 e os espectros de IRFT de amostras e padrões foram obtidos numa resolução nominal de
4 cm-1, entre 4000 e 900 cm-1, com acumulação de 25 espectros. A determinação de Imidaclopride foi
feita medindo-se tanto a área do sinal obtido entre 1577 e 1567 cm-1 ou a altura do sinal a 1572 cm-1, ambos
com correção de linha base horizontal a 1900 cm-1. Os limites de detecção atingidos da ordem de
9 µg g-1, foram apropriados para a determinação de Imidoclopride em formulações comercias
disponíveis. Os resultados com IRFT forma estatisticamente comparáveis àqueles encontrados para Cromatografia Líquida de Alta Performance (HPLC). O procedimento desenvolvido reduz o consumo de solventes orgânicos por preparação de amostra, de 53 mL de CH3CN requeridos com HPLC para 2,5 mL de CHCl3, reduzindo o descarte gerado, e aumenta a freqüência de medidas de 10 para 60 amostras h-1, quando comparado ao método de referência usando HPLC-UV.
A simple method has been developed for Fourier Transform Infrared (FTIR) determination of Imidacloprid in pesticide formulations. Samples were diluted with CHCl3 and the FTIR spectra of samples and standards were obtained at a nominal resolution of 4 cm-1 from 4000 to 900 cm-1
accumulating 25 scans. Imidacloprid determination was based on the measure of either peak area from 1577 to 1567 cm-1 or peak height at 1572 cm-1, both corrected using a horizontal baseline
defined at 1900 cm-1. The limits of detection achieved, of the order of 9 µg g-1, were appropriate for
the determination of Imidacloprid in commercially available formulations. FTIR results were statistically comparable to those found by High Performance Liquid Chromatography (HPLC). The procedure developed reduces organic solvent consumption, per sample preparation, from 53 mL CH3CN required for HPLC to 2.5 mL CHCl3, and reduces waste generation also increasing the sample measurement frequency from 10 h-1 to 60 h-1 as compared with the HPLC-UV reference
method.
Keywords: Imidacloprid, pesticide formulations, FTIR, HPLC-UV
Introduction
Imidacloprid, 1-(6-chloro-3-pyridylmethyl)-N-nitroimidazolidin-2-ylideneamine, 1-[(6-chloro-3-pyridinyl)methyl]-N-nitro-2-imidazolidinimine, (CAS 13826-41-3), is a general use pesticide, classified by the USA Environmental Protection Agency (EPA) in both toxicity class II and class III.1 This pesticide is found in a
variety of commercial insecticides as soluble concentrate, concentrated suspension and as wettable powder in different
concentrations between 20% m/v and 70% m/m.2
Imidacloprid is a systemic, chloro-nicotinyl insecticide for soil, seed and foliar uses, which is employed for the
control of sucking insects including rice hoppers, aphids, thrips, whiteflies, termites, turf insects, soil insects and some beetles. It is commonly used on rice, cereal, maize, potatoes, vegetables, sugar beets, fruit, cotton, hops and turf, and is especially systemic when used for seed or soil treatment. The insecticidal effect of Imidacloprid is achieved through bioaccumulation of acetylcholine in the target insects.3
Imidacloprid has been determined at trace levels in different environmental and food samples by high performance liquid chromatography with either mass
spectrometry (HPLC-MS)4-6 or UV detection (HPLC-UV)
using conventional dispersive spectrometers7-10 or diode
array detectors,11,12 with Imidacloprid being determined in
water,4,9 fruits and vegetables 5-7,10,12 and greenhouse air.11
Imidacloprid determination in coffee,13 vegetables14 and
water and soil15 using mass spectrometric detection
(GC-MS).
Non-chromatographic methods developed for Imidacloprid determination were based on enzyme-linked immunosorbent assays (ELISA)16-18 and flow injection
analysis with photochemically induced fluorescence detection (FIA-PIF).19
For the determination of Imidacloprid in formulated insecticides, the Collaborative International Analytical
Council (CIPAC) recommended procedure20 is based on
HPLC-UV and it seems to be that the most extended methodology for the analysis of pesticide formulations.21,22
Fourier Transform Infrared spectrometry (FTIR) provides highly useful information about the structure of analites and it can be used for both qualitative and
quantitative analysis.23,24 Because of this we have
developed a series of analytical methodologies for the FTIR determination of Fluometuron,25 Buprofezin,26 Folpet and
Metalaxyl.27 However there is no analytical procedure
proposed in the literature for the determination of Imidacloprid in pesticide formulations by FTIR.
One of the identity tests proposed by CIPAC20 is based
on the comparison of FTIR spectra of samples or technical standards with that of pure standard in the spectral region between 1700 and 1400 cm-1 using KBr discs. However,
the possibilities of this technique for the quantification of Imidacloprid were not explored.
The aims of this work are the development of a fast and environmentally friendly procedure, based on the use of FTIR, for the determination of Imidacloprid in commercial formulations which could be applied for quantitative purposes in both commercial formulations and technical products.
Experimental
Apparatus and reagents
A Nicolet (Madison, WI, USA) Magna 750 FTIR spectrometer, equipped with a temperature-stabilized deuterated tryglycine sulfate (DGTS) detector and controlled with Nicolet Omnic 2.1 (Madison, WI, USA),
was employed for spectral measurements of CHCl3
solutions of Imidacloprid using a micro flow cell with a pathlength of 0.11 mm (Graseby-Specac, Orpinghton, UK) with ZnSe and CaF2 windows.
For introduction of samples and standards into the flow cell a Gilson Minipuls 2 peristaltic pump (Villiers-le-Bel, France) equipped with solvent resistant viton tubes of 3 mm od and 1 mm id was employed. The connection
between the cell and the peristaltic pump was made using a 0.8 mm id PTFE tube.
A Hewlett-Packard HPLC Series 1050 High Perfor-mance Liquid Chromatograph, equipped with a Kromasil C-18, 5 µm particle diameter, 250 x 4.6 mm id column, and a variable wavelength UV-Vis detector, was also employed for the analysis of insecticide formulations, this metho-dology being employed as a reference for the validation of the FTIR measurements.
The Imidacloprid standard (99.9% m/m) was purchased from Fluka (Buchs, Switzerland). Analytical grade chloroform
stabilized with 150 mg L-1 amylene and HPLC grade
acetonitrile were supplied by Scharlau (Barcelona, Spain) and were employed for the preparation of samples and standards, also using Milli-Q grade water for the mobile phase. Imidacloprid, 20% (m/v) soluble concentrate commercial formulations, were obtained directly from the Spanish market.
Reference procedure
Weigh accurately 40 mg of sample and dilute with CH3CN in a 25 mL volumetric flask, sonicating during 5 min in an ultrasound water bath. Dilute 1 mL of this solution to 25 mL and filter through a 0.22 µm nylon filter. Inject 20 µL of this latter solution in the chromatographic system using a 60:40 acetonitrile:water mobile phase at 1 mL min-1 Imidacloprid being determined in the isocratic
mode by absorbance measurements at 285 nm. For the quantification of Imidacloprid, peak areas obtained at a retention time of 3.5 min for the samples were interpolated using external calibration established using standard solutions of Imidacloprid in acetonitrile over the concen-tration range from 3 to 30 µg mL-1.
Recommended procedure
Weigh accurately 20 mg of sample and dilute with 4 g chloroform using ultrasonic agitation for 5 min. Filter this solution through a 0.22 µm nylon filter and aspirate directly into the FTIR measurement cell by using a peristaltic pump. The FTIR spectra were obtained, from 4000 to 860 cm-1, in the stopped-flow mode at 4 cm-1
nominal resolution, accumulating 25 scans using, as a background, the cell filled with CHCl3.
The concentration of Imidacloprid in the samples was obtained by interpolation of peak areas from 1577 to 1567 cm-1 with an horizontal baseline fixed at 1900 cm-1 using
Results and Discussion
FTIR spectra of Imidacloprid
Figure 1 shows the FTIR spectra, in the wavenumber region from 2000 to 950 cm-1, of a chloroform solution of
Imidacloprid at 3.3 mg g-1, a sample solution containing
0.8 mg g-1 Imidacloprid and a technical product solution
containing 4.0 mg g-1 of Imidacloprid.
The spectra of both the technical product and the pure standard solution in CHCl3 present the same absorption bands, corresponding to the Imidacloprid molecule. On the other hand, it can be seen that the presence of different excipients in the formulation provide additional bands which, to a large extend, produce spectral differences between the FTIR spectra of the samples and the standards. Despite that, the bands at 1572 and 1548 cm-1
, due to the
=CH- stretching of the pyridine group, are clearly observed in all cases and seem to be free from matrix interferences. The -NO2 symmetric stretching band located at 1300 – 1250 cm-1, while the bands in the region between 1420
and 1500 cm-1, and that at 1109 cm-1, which are probably
due to the aromatic =CH- and to the aryl-Cl stretching, respectively,28 seem to be affected by the formulation
components and thus can not be employed for Imidacloprid determination without carrying out matrix removal.
Selection of the appropriate bands
As can be seen in Figure 1 the bands at 1572 and 1548 cm-1 are the bands of Imidacloprid which are clearly isolated
and, apparently, do not overlap with any band of the different excipients in the formulated samples.
Thus, these bands were selected for Imidacloprid measurements. To obtain the best analytical performance of the FTIR determination of Imidacloprid, the use of peak height and peak area were evaluated, also using different baseline corrections.
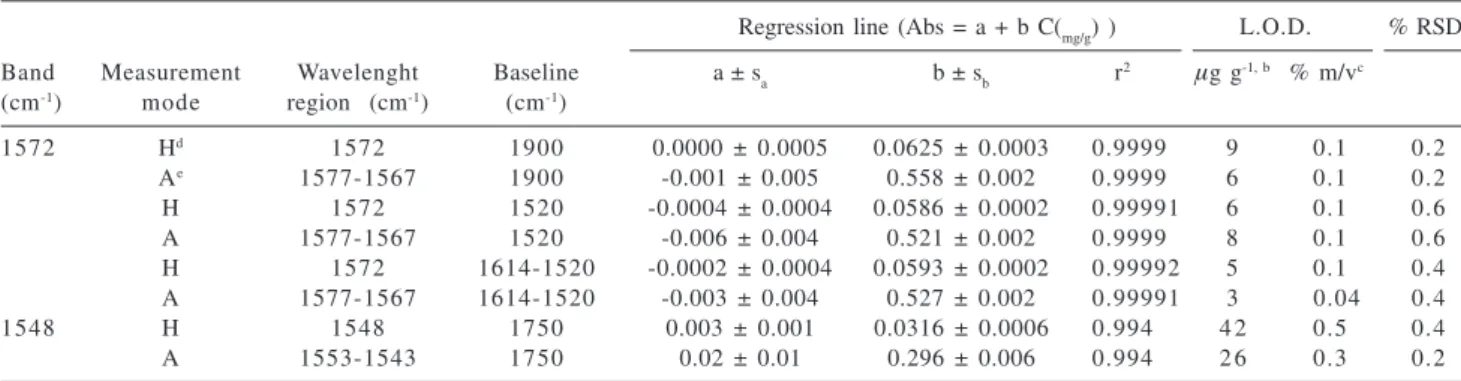
Table 1 summarizes the main characteristics of the different regression lines found using the 1572 cm-1 and the
1548 cm-1 bands. As it can be seen, the band at 1548 cm-1
provides a reduced sensitivity and a high limit of detection, also involving a reduced linearity to the calibration lines, as compared with results found using the band at 1572 cm-1.
For this latter band the regression lines had linear coefficients higher than 0.9999 showing the good linearity of the fits. The limits of detection obtained for the latter band ranged from 4 to 9 µg g-1, from 0.04 to 0.1 % m/v in the formulated
pesticide, being thus appropriate for the determination of Imidacloprid in formulations. On the other hand the use of peak areas does not significantly improve the limits of detection despite the higher sensitivities found when peak areas is employed. Thus the use of either peak height at 1572 cm-1 or peak area from 1577 to 1567 cm-1, both
corrected using an horizontal baseline defined at 1900 cm-1
are indicated, because these measurement conditions provide the lowest RSD values, and limits of detection of 9 and 6 µg g-1, respectively, which are equivalent to 0.1 and
0.07% m/v of Imidacloprid in the original sample when using a sampling mass of 20 mg.
In the selected conditions the regression lines obtained using an external calibration set were comparable with those
Figure 1. FTIR spectra of Imidacloprid. Note: Spectra were obtained in CHCl3 solutions containing 0.8, 4.0 and 3.3 mg g-1 Imidacloprid of a
found by standard addition, which were A1577-1567 = (0.045 ± 0.001) + (0.559 ± 0.004) CIMID (mg g-1), with a regression
coefficient r2 = 0.9993, and H
1757 = (0.052 ± 0.002) + (0.062
± 0.001) CIMID (mg g-1), with a regression coefficient r2 =
0.9992, thus indicating the absence of matrix effects.
Measurement conditions
In order to select the most appropriate measurement conditions for the FTIR determination of Imidacloprid, the effect of using different nominal resolution values was studied and also that of the number of accumulated scans per spectrum on the signal to noise ratio of the Imidacloprid band at 1572 cm-1.
The effect of the nominal resolution on the spectral size and shape of the bands of Imidacloprid in CHCl3 is shown in Figure 2. From the inset the effect of the resolution on the peak height at 1572 cm-1, corrected with a horizontal
baseline established at 1900 cm-1 is observed. The use of a
high value of nominal resolution can not be recommended, because of the low sensitivity achieved and the deformation of the absorption bands, due to the low collection time required and the low noise obtained. A nominal resolution of 4 cm-1 was chosen, which provides good sensitivity,
with a loss of only a 2.4% with respect to that found using 1 cm-1, and implies a 50% reduction of the acquisition
time, thus increasing the sample throughput with a small sensitivity loss.
Table 1. Imidacloprid regression linesa obtained using peak area and peak height measurements for different band and using different baseline
criteria
Regression line (Abs = a + b C(mg/g) ) L.O.D. % RSD
Band Measurement Wavelenght Baseline a ± sa b ± sb r2 µg g-1, b % m/vc
(cm-1) mode region (cm-1) (cm-1)
1572 Hd 1572 1900 0.0000 ± 0.0005 0.0625 ± 0.0003 0.9999 9 0.1 0.2
Ae 1577-1567 1900 -0.001 ± 0.005 0.558 ± 0.002 0.9999 6 0.1 0.2
H 1572 1520 -0.0004 ± 0.0004 0.0586 ± 0.0002 0.99991 6 0.1 0.6
A 1577-1567 1520 -0.006 ± 0.004 0.521 ± 0.002 0.9999 8 0.1 0.6
H 1572 1614-1520 -0.0002 ± 0.0004 0.0593 ± 0.0002 0.99992 5 0.1 0.4
A 1577-1567 1614-1520 -0.003 ± 0.004 0.527 ± 0.002 0.99991 3 0.04 0.4
1548 H 1548 1750 0.003 ± 0.001 0.0316 ± 0.0006 0.994 4 2 0.5 0.4
A 1553-1543 1750 0.02 ± 0.01 0.296 ± 0.006 0.994 2 6 0.3 0.2
a Calibration curve obtained for five standards of Imidacloprid at concentrations ranging from 0 to 3.30 mg g-1; b Limit of detection established
from six independent measurements of a blank solution and a probability level of 99.6% (k =3); c Limit of detection in the original sample
established from six independent measurements of a blank solution and a probability level of 99.6% (k =3) for a sample mass of 20 mg; d H= Peak
height; e A= Peak area.
Figure 2. FTIR spectra of a standard solution of Imidacloprid in CHCl3 (1.7 mg g-1) measured using 1, 2, 4, 8 and 16 cm-1 nominal resolution values
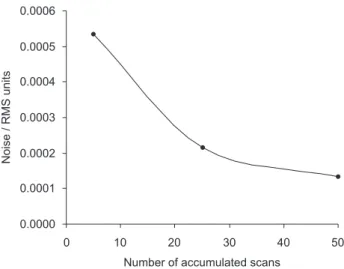
Figure 3 shows, for a nominal resolution of 4 cm-1, the
effect of increasing the number of scans, from 5 to 50, on the noise measured as root mean square (RMS) of absorbance signals of pure CHCl3 in the region between
1577 and 1567 cm-1. In order to ensure a compromise
between sample measurement frequency and signal to noise ratio, 25 scans were selected for further measurements.
Comparison between HPLC and FTIR methods
Table 2 shows the data found for the determination of Imidacloprid in three commercially available pesticide formulation samples, obtained by using both the FTIR procedure and the HPLC-UV reference method and, as can be seen, statistically comparable data were found by both procedures using either peak height or peak area measurements for the band at 1572 cm-1, thus showing
that the accuracy of the developed procedure is comparable to that found by the CIPAC recommended strategy. Additionally a higher repeatability found on using FTIR measurements can be noticed compared to that found by
HPLC, probably due to the use of the successive dilutions involved in the chromatographic procedure.
Table 3 summarizes the main analytical parameters found using the developed procedure compared with those of the reference HPLC-UV method. The low limit of detection achieved by HPLC-UV makes it appropriate for the determination of Imidacloprid at low concentration levels as, for example, in treated crops or waste waters, but the concentration level at which HPLC works also requires a high sample dilution for the analysis of pesticide formulations which increases waste generation and degrades the precision of the method.
The solvent volume employed for the measurement of
a single sample was 2.5 mL of CHCl3 for FTIR
determination and 53 mL of CH3CN for HPLC, it also being necessary, in this later case, the use of a mobile phase which increases waste generation in 60 mL h-1. So the FTIR
procedure can be considered an environmentally friendly alternative to the use of HPLC-UV in the analysis of formulations. On the other hand, the sample throughput of the FTIR procedure was 60 samples h-1, compared to 10 h-1
for HPLC, thus increasing laboratory efficiency and providing faster methodology.
Conclusions
The FTIR procedure developed for the quantitative determination of Imidacloprid in pesticide formulations provides statistically comparable results to those found by using a reference HPLC procedure and clearly reduces sample handling by reducing the need of sample dilution resulting in a significant reduction of waste generation and offering a faster alternative method.
Table 3. Comparison of the analytical figures of merit of the FTIR method and the HPLC-UV procedure
Analytical parameters HPLC-UV reference FTIRa
Intercept (a ± sa) 0.7 ± 0.3 -0.001 ± 0.005 Slope (b ± sb) 31.67 ± 0.02 0.558 ± 0.002
(au mg-1 l) (au mg-1 g)
Correlation 0.99998 0.9999
coefficient (r2)
Concentration range 0 – 30 (µg ml-1) 0 – 3.3 (mg g-1)
% RSDb 0.05 0.2
LOD (µg g-1) 0.03 9
LOD (% m/v) 0.03 0.1
% RSDc 1.1 0.3
a Using peak area values measured between 1577 and 1567 cm-1 with
a baseline established at 1900 cm-1; b Relative standard deviation
val-ues obtained from six measurements of a standard solution located at the middle of the calibration line.; c Mean relative standard deviation
obtained for three replicate analysis of three commercially available samples containing approximately 20% m/m of Imidacloprid.
Table 2. Determination of Imidacloprid in pesticide formulations analyzed by the FTIR procedure developed and by the HPLC-UV reference method
Imidacloprid (% m/v)a
FTIR HPLC-UV
Sample HEIGHTb AREAc
1 20.07 ± 0.07c 20.00 ± 0.08 20.1 ± 0.4
2 20.00 ± 0.04 20.01 ± 0.02 20.2 ± 0.1
3 20.0 ± 0.2 20.0 ± 0.1 20.1 ± 0.2
a Mean value ± standard deviation established from three
indepen-dent replicates; b Peak height at 1572 cm-1 with an horizontal baseline
at 1900 cm-1; c Peak area between 1577 and 1567 cm-1 with an
horizontal baseline at 1900 cm-1.
Acknowledgements
Authors acknowledge the financial support of the Generalitat Valenciana Project GV01-249 and the grant provided by the Laboratorio de Higiene Laboral y Ambiental of the Universitat de Valencia and Laboratorios Ibáñez to carry out this study. S. Armenta acknowledges the FPU Grant of the Ministerio de Educación, Cultura y Deporte de España (Ref. AP2002-1874).
References
1. Meister, R.T., ed.In Farm Chemicals Handbook 1994; Meister Publishing Company: Willoughby, OH, 1994.
2. de Liñan, C.; Vademecum de Productos Fitosanitarios y
Nutricionales, Ed. Agrotécnica S. L.: Madrid, 2000. 3. Kidd, H.; James, D. R., eds. In The Agrochemicals Handbook,
3rd ed., Royal Society of Chemistry Information Services:
Cambridge, UK, 1991.
4. Hernandez, F.; Sancho, J. V.; Pozo, O.; Lara, A.; Pitarch, E.; J. Chromatogr. A2001, 939, 1.
5. Pous, X.; Ruiz, M. J.; Pico, Y.; Font, G.; Fresenius’ J. Anal. Chem. 2001, 371, 182.
6. Fernandez-Alba, A. R.; Tejedor, A.; Aguera, A.; Contreras, M.; Garrido, J.; J. AOAC. Int. 2000, 83, 748.
7. Dai, H.; Li, Y. J; Zhang, Y.; Fenxi Ceshi Xuebao 2002, 21, 70. (CA 136:305.493)
8. He, J.; Chang, J. B.; Guo, R. Y.; Liu, P.; Lin, S. F.; Chen, R. F.; Wang, Q. A.; Sepu. 2000, 18, 181.
9. Guiberteau-Cabanillas, A.; Galeano-Diaz, T.; Mora-Diez, N.; Parrilla-Vazquez, P.; Salinas-Lopez, F.; Talanta 2001, 53, 943. 10. Ishii, Y.; Kobori, I.; Araki, Y.; Kurogochi, S.; Iwaya, K.; Kagabu,
S.; J. Agric. Food Chem. 1994, 42, 2917.
11. Garrido-Frenich, A.; Egea-Gonzalez, F. J.; Martinez-Vidal, J. L.; Parrilla-Vazquez, P.; Mateu-Sanchez, M. J.; J. Chromatogr. A 2000, 869, 497.
12. Fernandez-Alba, A. R.; Valverde, A.; Aguera, A.; Contreras, M.; Chiron, S.; J. Chromatogr. A1996, 721, 97.
13. Lodevico, R. G.; Li, Q. X.; Anal. Lett. 2002, 35, 315. 14. Navalon, A.; Gonzalez-Casado, A.; El-Khattabi, R.; Vilchez, J.
L.; Fernandez-Alba, A. R.; Analyst 1997, 122, 579. 15. Vilchez, J. L.; El-Khattabi, R.; Fernandez, J.; Gonzalez-Casado,
A.; Navalon, A.; J. Chromatogr. A1996, 746, 289.
16. Lee, J. K.; Ahn, K. C.; Park, O. S.; Kang, S. Y.; Hammock, B. D.; J. Agric. Food. Chem. 2001, 49, 2159.
17. Wanatabe, S.; Ito, S.; Kamata, Y.; Omoda, N.; Yamazaki, T.; Munakata, H.; Kaneko, T.; Yuasa, Y.; Anal. Chim. Acta 2001,
427, 211.
18. Li, K.; Li, Q. X.; J. Agric. Food. Chem. 2000, 48, 3378. 19. Sarkar, M. A.; Biswas, P. K.; Roy, S.; Kole, R. K.; Chowdhury,
A.; Bull. Environ. Contam. Toxicol. 1999, 63, 604. 20. Collaborative International Pesticides Analytical Council
(CIPAC) Handbook; CIPAC Ltd; 1994, Volume H, 185. 21. Li, L. S.; Fenxi. Shiyanshi 1998, 17, 60. (CA 130: 91.577)
22. Macke, M. M.; J. AOAC Int. 1998, 81, 344.
23. Cadet, F.; de la Guardia, M., In Quantitative Analysis, Infra-red. Encyclopedia of Analytical Chemistry. Meyers, R. A., ed., John Wiley & Sons, Ltd: Chichester, 2000.
24. Garrigues, S.; de la Guardia, M.; Infrared Quantitative Analy-sis; Encyclopedia of Analytical Chemistry, John Wiley & Sons, Ltd: Chichester, 2002, vol. 2.
25. Armenta S.; Quintás G.; Moros J.; Garrigues S.; de la Guardia M.; Anal. Chim. Acta 2002, 468, 81.
26. Quintás G.; Morales-Noé A.; Parrilla C.; Garrigues S.; de la Guardia M.; Vib. Spectroscopy 2003, 31, 63.
27. Quintás, G.; Armenta, S.; Morales-Noé, A.; Garrigues, S.; de la Guardia, M.; Anal. Chim. Acta 2003, 480, 11.
28. Lin-Vien, D.; Colthup, N.B.; Fateley, W.G.; Grasselli, J.G.;
Infrared and Raman Characteristic Frequencies of Organic
Molecules. Academic Press: London, 1991, 296.
Received: February 25, 2003