Electrochemical Behaviour of Iron in NaOH 0.01 mol/L Solutions
Containing Variable Amounts of Silicate
Suzana T. Amaral
a*, and Iduvirges L. Müller
ba
Instituto de Química, Universidade Federal do Rio Grande do Sul,
Av. Bento Gonçalves 9500, C.P. 15003, 91501-970 Porto Alegre - RS, Brazil b
Departamento de Metalurgia, Universidade Federal do Rio Grande do Sul,
Av. Osvaldo Aranha 99, sala 607, 90035-190 Porto Alegre - RS, Brazil
Ciclos voltamétricos repetitivos do ferro em soluções de NaOH contendo concentrações variáveis de silicato entre 10 ppm e 1500 ppm, mostram comportamentos diferentes da primeira varredura quando comparada com as subsequentes, em todas as soluções testadas. Esta diferença indica uma modificação do processo de formação do filme com a ciclagem. Foi observada uma transição do perfil i/E entre 10 ppm e 100 ppm de silicato o que permite formular considerações sobre a incorporação de silicato ao filme.
Repetitive voltammetric cycling of iron in NaOH solutions containing variable silicate concen-trations between 10 ppm and 1500 ppm, shows different behaviour for the first scan when compared to the following ones in all studied solutions. This difference indicates a modification on the film formation process. A transition in the i/E profile between 10 ppm and 100 ppm of silicate was observed allowing considerations about silicate incorporation to be formulated.
Keywords: iron, cyclic voltammetry, anodic films, passive films
Introduction
Iron passivation in different electrolytes has been ex-tensively studied1-44. Many investigations were carried out using highly alkaline solutions2-18 or using buffer solutions as carbonate/bicarbonate19-26 or borate buffer27-32 when a constant and not very high pH is desirable. Many products have been identified as resulting from the anodic polariza-tion of iron at different potentials, by different surface analysis techniques6-13,22,26,33-45. Several electrochemical techniques have also been used to investigate the kinetics of the formation of these products and among them cyclic voltammetry is one of the most used2-8,14-22.
The surface analysis techniques that perform in-situ analysis have the great advantage of avoiding decomposi-tion and/or dehydradecomposi-tion of products formed which is inevi-table with ex-situ analysis due to the high vacuum conditions and to the heating promoted by electron bom-bardment1,14,28,33-38.
Although there is no consensus about the nature of products formed on an iron surface during anodic polariza-tion, some ferric products are often mentioned as the pas-sive film components and almost all authors propose that
the ferrous species formed during anodic polarization, which are the precursors of ferric ones, are the species Fe(OH)26,7,18,22,42,43.
At more anodic potentials, some authors identified β -FeOOH and sometimes Fe3O4 using in-situ Mössbauer
spectroscopy12, while others based on in-situ Raman spec-troscopy results proposed a bi-layer structure of γ-Fe2O3/γ
-FeOOH7 or Fe3O4/d-FeOOH10 (or α-FeOOH13). In-situ
UV and visible spectroscopy techniques have also deter-mined such a bi-layer structure15. Another proposition for the film passive composition based in elipsometric results7, XANES in-situ27,28 and other optical techniques37,39,44, is a superposition of Fe3O4/γ-FeOOH at the beginning which
changes to Fe3O4/γ-Fe2O3 after ageing although it was not
specified after how long a time and at which potential. Nevertheless some elipsometric9,10,29,41, Raman29 a n d Mössbauer40 results identified γ-FeOOH as the only passi-vant species while infrared16,17 results identified Fe3O4 as
the only passivant species.
The in-situ analysis results show that the film presents an amorphous character due to water presence which is an
essential factor for passivation and this amorphous charac-ter is destroyed if the film is dried10,14,34,35.
When a passive film is described as a double layer film, the inner layer is considered a barrier layer and the outer layer is a substrate for Fe(II)/Fe(III) redox reactions during potential cycling6,7,22,42,43.
The literature shows that the i/E profile obtained in cyclic voltammetry depends on the potential perturbation program characteristics. The real number of potentiody-namic peaks for iron are still questionable2-4 and they change with repetitive cycling. Generally three or four anodic peaks and one or two cathodic ones are identified for iron. Although the considered mechanisms may be different, almost all authors agree that the first and second anodic peaks are associated to ferrous species formation
2-8,11,16,45,46 although these anodic peaks are sometimes
at-tributed to Fe3O4 formation8,11,15,16, or the first one to
adsorbed hydrogen oxidation14,16. The third and fourth anodic peaks are associated to ferric species formation
2-8,11,14,15,45,46. The first cathodic peak is associated with the
third and fourth anodic peaks and is attributed to ferric species reduction to ferrous ones2-8,14,15 while the second cathodic peak is associated to the first and second anodic peaks and should correspond to ferrous species reduction to metallic iron2-7,45,46 or Fe3O4 reduction to ferrous
spe-cies8.
The aim of this study is to investigate the iron behaviour during repetitive cycling in NaOH 0.01 mol/L solutions containing variable amounts of silicate ranging from 0 ppm to 1500 ppm in order to evaluate the influence of this anion well known for its inhibitive properties of iron corrosion in aqueous solutions.
Experimental
An iron disk electrode (Gallard-Schlesinger 99.999 %) with a diameter of 4.9 mm embedded in PTFE served as the working electrode. Its surface was polished with emery paper of grit 400, 600 and 1000 and with 1 micron alumina and washed with double-distilled water and acetone. Be-fore each experiment the disk was electroreduced at -1600 mV (SCE) for 10 min in a three electrode electrochemical cell to obtain reproducible results. The counter electrode was a platinum wire and the reference electrode was a saturated calomel electrode (SCE) to which all the poten-tials in the text are referred.
Solutions were prepared using boiled, double-distilled water and p.a. reagents. The silicate composition was 18% Na2O, 63% SiO2 and 18% H2O. The silicate concentrations
used were: 0, 10, 20, 50, 75, 100, 250, 500, 750, 1000, 1250 and 1500 ppm as SiO2 and the NaOH concentration was
always 0.01 mol/L The temperature was kept at 25 °C and nitrogen bubbling was used throughout the experiments to remove oxygen from the solution.
The disk electrode potential was scanned repetitively between +600 mV and -1300 mV during ten cycles at a scan rate of 50 mV/s and a constant electrode rotation rate of 1000 rpm was used.
The equipment consisted of a Pine Model AFRDE5 Bipotentiostat, an Analytical Rotor and a BBC Model SE 780 XY Recorder.
Results and Discussion
Figure 1 shows the voltammograms of the first to the fifth cycle and the tenth cycle of iron for solutions NaOH 0.01 mol/L + SiO2 x ppm (x = 0, 20 and 50) and Fig. 2 the
same for solutions NaOH 0.01 mol/L + SiO2 x ppm (x =
75, 100, 250 and 1000).
It can be seen that the first anodic scan presents three anodic peaks (a1, a2, a3) and in the solutions containing
silicate above 50 ppm an anodic shoulder a’3 appears. The
anodic peak potentials become less negative as the silicate concentration increases. The first cathodic scan, in solu-tions containing silicate with concentrasolu-tions above 50 ppm, presents one cathodic peak c1 that is associated to a3 and
a’3, as proven by preliminary tests47. The solutions without
silicate and up to 20 ppm SiO2, do not present
distinguish-able cathodic peaks at the first scan and it is probdistinguish-able that ferric and ferrous species reduction may be hindered by the hydrogen evolution reaction.
Based on the literature already mentioned, and in po-tential-pH diagrams developed by Misawa48, it is possible
to propose that the processes that probably are occurring during the first anodic scan are:
- peak a1:
Fe + 2 H2O → Fe(OH)2(monolayer) + 2 H+ + 2 e- (1)
- peak a2:
Fe + 2 H2O → Fe(OH)2(multilayer) + 2 H+ + 2 e- (2)
3 Fe + 4 H2O → Fe3O4 + 8 H+ + 8 e- (3)
3 Fe(OH)2→ Fe3O4 + 2 H2O + 2 H+ + 2 e- (4)
- peak a3:
Fe(OH)2→ γ-FeOOH + 2 H2O + H+ + e- (5)
- peak a’3:
Fe3O4 + 2 H2O → 3 γ-FeOOH + H+ + e- (6)
These processes are in agreement with thermodynamic data since the peak potential values are slightly more anodic than the equilibrium potentials predicted by Misawa48 for
these reactions at pH 12, which are respectively:
(1) Eeq = - 1,057 mV (4) Eeq = - 979 mV
(3) Eeq = - 1,038 mV (6) Eeq = - 159 mV
An experimental separation of the anodic peaks for the first scan, followed by a stoichiometric charge balance47, reinforce that the possibility of these processes are occur-ring is feasible.
The anodic charge density associated with the first anodic scan is bigger than the cathodic charge density associated with the first cathodic scan in all solutions tested and this fact proves that , if no important metal dissolution occurs as has been found47, at the end of the first cathodic scan the film is not completely reduced and the electrode surface is probably recovered by Fe(OH)2. The hydrogen
evolution reaction is polarized at the end of this scan which reinforces the proposition that the ferrous species are not completely reduced.
The i/E profile for the first anodic scan is similar for all solutions but the total anodic charge density for the first anodic scan is approximately constant in solutions up to SiO2 100 ppm, then decreases until SiO2 1250 ppm and
remains constant for higher concentrations. Data are shown in Fig. 3 and indicate that, for the film formed at the first anodic scan, the thickness decreases gradually from 100
ppm SiO2 to 1250 ppm SiO2 and this thickness reduction
reaches about 30 % when SiO2 concentration in solution is
1250 ppm.
It is important to stress that “thickness” does not mean necessarily the physical thickness of the film. The incorpo-ration of silicate in the film (or other components from solution) could contribute to the increase of its dimension, although the anodic charge involved in its formation could be decreasing. The fact is that in the presence of silicate the film formed is more resistive.
Some interesting facts are observed along the second scan:
Peak a1 disappears in all solutions, which may indicate
that the surface is already recovered by a tridimensional film, probably Fe(OH)2, formed in the previous cycle.
Peaks a3 (and a’3) disappear in all solutions which
indicates, according to the above proposed processes, that ferric species formation from Fe(OH)2 is not occurring.
Current density values within the peak a2 potential
range decrease in all solutions and this fact allows the proposition that at this potential range Fe3O4 formation
pre-existent Fe(OH)2 to Fe3O4 at the Fe(OH)2/solution
interface. The peak a3 disappears and thus, the ferric species
formed at peaks a4 and a’4 are not the same ones formed at
peak a3 in the first scan. For this reason, it is reasonable to
believe that from the second anodic scan another species preferentially formed that differs from Fe(OH)2, along the
potential range corresponding to peak a2.
New anodic and cathodic peaks appear and from this point on, the behaviour in solutions: NaOH 0.01 mol/L and NaOH 0.01 mol/L + SiO2 250 ppm will be analysed
sepa-rately. The results of all the other solutions will be com-pared afterwards.
A new anodic peak a’4 appears at -675 mV in NaOH
0.01 mol/L solution as well as a new anodic peak a4 at -515
mV in NaOH 0.01 mol/L + SiO2 250 ppm solution. These
peaks can be attributed to the oxidation of the outer Fe3O4
layer (formed from Fe(OH)2) to α-FeOOH, since the
equi-librium potential for this reaction at pH = 12 is -710 mV48. The difference between potential peaks a4 and a’4 can be
explained if it is accepted that silicate present in solution promotes the polarization of this reaction.
In NaOH 0.01 mol/L + SiO2 250 ppm solution a new
cathodic peak c2 appears at -690 mV and is clearly
associ-ated with a4, therefore it should correspond to the reduction
of α-FeOOH to Fe3O4. The i/E profile is distorted in the
peak c1 potential range and it is possible that at this potential
range the Fe3O4 reduction to Fe(OH)2 added to the
reduc-tion of other ferric species formed in the passive zone occurs. This correlation can be proved by varying the anodic reversion potential for the tenth cycle and the results are shown in Fig. 4a. Thus it is reasonable to propose that
Figure 2. Voltammograms of the first to fifth and of the tenth cycle for solutions of NaOH 0.01 mol/L containing: (v = 50 mV/s and w = 1000 rpm). 2a: 75 ppm SiO2; 2b: 100 ppm SiO2; 2c: 250 ppm SiO2; 2d: 1000 ppm SiO2
Figure 3. Total charge density for the first anodic scan (•) and % of film thickness decrease in relation to silicate free solution (x) for the SiO2
at the end of the second cathodic scan the film of Fe(OH)2
is thicker than at the end of the previous scan and it is possible that below this film a thin Fe3O4 film has been
formed from metallic iron in the second anodic scan which does not participate in the associated electrochemical proc-esses occurring at a4/c2.
In the pure NaOH solution two cathodic peaks appear, c’1 (at -890 mV) and c’2 (at -970 mV) being well
distguished from the hydrogen evolution reaction which in-crease, if compared with the first scan. One possibility that can be pointed out is that at c’1 reduction of α-FeOOH to
Fe3O4 occurs and at c’2 reduction of Fe3O4 to Fe(OH)2
occurs simultaneously with the reduction of ferric species, formed along the passive potential range, to Fe(OH)2.
Likewise it is also possible to suggest that at the end of the second cathodic scan the film of Fe(OH)2 thickens covering
an inner thin film of Fe3O4 that does not participate in
electrochemical processes occurring at a’4/c’1 and is only
partially reduced at c’2. Figure 4b shows the results of tests
varying the anodic reversion potential in the tenth cycle and the results prove this peaks correlation.
The repetitive cycling shows:
In the NaOH 0.01 mol/L + SiO2 250 ppm solution, the
current densities of peaks a4 and c2 increase significantly.
The suggestion is that at the end of each complete cycle, the outer film of Fe(OH)2 thickens as well as the inner film
of Fe3O4 which allows an increasing formation of α
-FeOOH in the next anodic scan.
In the NaOH 0.01 mol/L solution, the current density of anodic peak a’4 increases more significantly than peak a4
in the silicate containing solution, but cathodic peaks c’1
and c’2 are substituted, from the third cathodic scan on, by
another cathodic peak c’3 (at -1090 mV) which increases
during the following scans more significantly than the cathodic peak c2 in the silicate solution. Cathodic peak c’3
may be attributed to reduction of ferric species directly to Fe(OH)2 and thus, at the end of each complete cycle the
outer Fe(OH)2 layer should thicken over an inner layer of
Fe3O4 which does not participate in electrochemical
proc-esses occurring at a’4/c’3 and is not completely reduced.
This Fe3O4 film, which thickens at each new cycle, may
promote an increasing formation of α-FeOOH at a’4 in the
next anodic scan.
These considerations suggest that in both solutions the film formed after ten consecutive cycles is composed of an inner layer of Fe3O4 that thickens in each cycle and by an
outer layer of α-FeOOH that participates in oxidation/re-duction processes also thickening in each cycle. Similar results for i/E profiles during cycling have already been detected for different alkaline solutions2-7,42,43 and similar propositions for film composition after cycling have also been advanced2-8,11-13,15,42,43. As the anodic peak a4
in-crease is smaller than that of peak a’4, it is plausible that the
inner film of Fe3O4 oxidizes to a smaller intensity and
becomes thicker in the presence of silicate than in absence of silicate. This means that the inner layer (barrier layer) in the tenth cycle should be thicker when silicate is present in solution.
Analyzing the voltammograms for the other solutions, it is clear that a transition in the i/E profile is occurring between concentrations of SiO2 10 ppm and SiO2 100 ppm:
For SiO2 10 ppm: The i/E profile behaviour along
progressive cycling is the same as the solution without SiO2, but the current density values are smaller.
For SiO2 100 ppm: The i/E profile behaviour along
cycling is the same for the solution containing SiO2 250
ppm, but the current density values are smaller.
For concentrations of SiO2 between 10 and 100 ppm:
Analyzing the tenth cycle, it is possible to notice a transi-tion: a’4 decreases when SiO2 concentration increases until
75 ppm and a4 appears when SiO2 concentration is 50 ppm
and increases with higher concentration. At 100 ppm, a’4
disappears and only a4 is observed. The cathodic peak c2 is
observed from SiO2 20 ppm on and it increases with SiO2
concentration.
These facts suggest that the silicate present in solution not only polarizes the anodic reactions but is also respon-sible for some differences between the α-FeOOH formed at a’4 when compared to that one formed at a4. This differ-Figure 4. Correlation between anodic and cathodic peaks for
voltammo-grams of the tenth cycle in solutions:
ence may be attributed to a gradual silicate incorporation in the outer film as its concentration in solution increases which may modify the film composition and/or structure. This modified species can be denoted by α-FeOOH*.
For SiO2 concentrations greater than 250 ppm, the
anodic peak a4 as well as the cathodic peak c2 decrease with
increasing SiO2 concentration practically disappearing for
concentrations greater than 1500 ppm. It is possible to suggest that for SiO2 concentrations from 250 ppm on, the
silicate interferes in the kinetics of α-FeOOH* film forma-tion decreasing the process rate and consequently decreas-ing α-FeOOH* film thickening during cycling.
It is well known that cycling promotes the ageing of the film5. The fact that the i/E profile is very similar during the first anodic scan in solutions containing or not SiO2 and
changes during cycling showing different peaks in the absence and presence of SiO2, indicates that time is very
important in silicate actuation. The aged passive film seems to be more protective if SiO2 is present in solution. Previous
experiments47 showed that the corrosion potential for iron electroreduced in each solution lies, after some time, at a passive zone and coincides with peak a4 potential in
solu-tions containing SiO2 and with peak a’4 potential in
solu-tions without SiO2. This demonstrates that the species
formed during cycling is probably the same as formed in open circuit conditions after ageing.
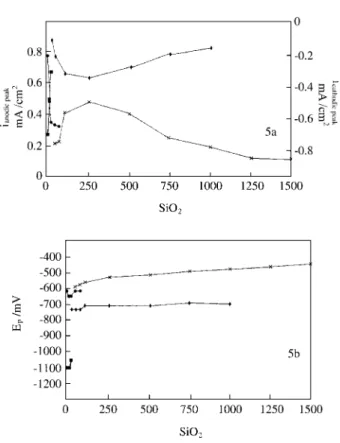
Figure 5 shows the variation of peak potential (Ep) and
peak current density (ip) with SiO2 concentration for anodic
peaks a’4 and a4 and for cathodic peaks c’3 and c2 for the
tenth cycle. The results for Ep variation may be explained
admitting that the α-FeOOH* composition changes gradu-ally as SiO2 concentration in solution increases which
promotes changes in ∆Gºformation for α-FeOOH*. Previous
experiments47 showed that the variation of peak potential
(Ep) with potential scan rate (v) is significant at the first
cycle but it is almost negligible at the tenth cycle which means that species formed at the tenth cycle (aged species) are more stable than the ones formed at the first cycle2,5.
Figure 6 shows the potential at which the line of zero current is crossed (EFlade). This potential varies from the
first to the tenth cycle which indicates that the film formed in the first anodic scan is not the same as that formed in the tenth scan. Both potential values (1st and 10th) become gradually less negative as SiO2 content in solutions
in-creases, for concentrations greater than 100 ppm.
The variation of peak a4 potential (Epa4) with the
poten-tial scan rate (v) for the tenth scan is not significant: not more than 20 mV when comparing v = 5 mV/s and v = 150 mV/s in NaOH 0.01 mol/L + SiO2 500 ppm. On the other
hand, in the same solution, the potential peak values for the peaks observed along the first scan present a significant variation with v: 150 mV for a2, 275 mV for a3 and 270 mV
for a’3 when comparing v = 5 mV/s and v = 150 mV.
The facts mentioned above indicate that the species formed during cycling are more stable than those formed during the first scan.
Some important facts should be emphasized:
- The capacitive current (iDL), that can be estimated by:
iDL = CDL . v (CDL = double layer capacitance and v = sweep
rate), can be neglected at the sweep rate of 50 mV/s. According to the literature2,38,46,47 double layer capacitance is generally within a range of 20 - 40 µF/cm2, or lower when a film is recovering the metallic surface, and conse-quently the value of the capacitive current at 50 mV/s is
Figure 6. EFladevs. [SiO2] for first (•) and the tenth (x) cycle.
Figure 5. Peak current density (ip) vs. [SiO2] (5a) and peak potential (Ep)
vs. [SiO2] (5b) for:
• peak a’4 peak c’3
around 1 - 2 µA/cm2. For this reason almost all of the total current may be considered as a faradaic current.
- Although adsorption processes were not specially investigated, it is believe that silicate does not adsorb on electrode surface because previous studies47, showed that the total current increases as the electro-reduction potential becomes more negative, suggesting a "cleaner" surface and the tests of the present study were carried out after an electro-reduction at -1600 mV. Furthermore, the same study47 proved that silicate promotes an increase of the electrolyte ohmic resistance, probably due to a colloidal consistency of the solution in the region near the electrode, and also promotes an increase of the charge transfer resis-tance affecting the film growth kinetics.
- The electrode rotation rate was chosen as being con-stant because previous studies47 using ring-disk rotating electrode and variable electrode rotation rates, proved that at pH 12 neither soluble species were formed, neither mass transport processes in the solution nor were important for the process kinectics.
Conclusions
Although this study is essentially qualitative it shows that the passive film formed on iron in NaOH 0.01 mol/L solutions, changes during ageing leading to a different composition and/or structure if SiO2 is present in solution
in concentrations greater than 50 ppm, the last one being more protective than that formed in pure NaOH 0.01 mol/L.
References
1. Vilche, J.R.; Arvia, A.J. Anal. Acad. Nac Cs. Ex. Fis.
Nat. 1981, 33.
2. Guzmán, R.S.S.; Vilche, J.R.; Arvia, A.J.
Electro-chim. Acta 1979, 24, 395.
3. Guzmán, R.S.S.; Vilche, J.R.; Arvia, A.J. J. Appl.
Electrochem. 1981, 11, 551.
4. Guzmán, R.S.S.; Vilche, J.R.; Arvia, A.J. Anales
Asoc. Quím Argentina 1982, 70, 999.
5. Vilche, J.R.; Arvia, A.J. Acta Cient. Venezolana 1980,
31, 408.
6. Albani, O.A.; Zerbino, J.O.; Vilche, J.R.; Arvia, A.J.
Electrochim. Acta 1986, 31,1403.
7. Albani, O.A.; Gassa, L.M.; Zerbino, J.O.; Vilche, J.R.; Arvia, A.J. Electrochim. Acta 1990, 35, 1437. 8. Hugot-Le-Goff, A.; Flis, J.; Boucherit, N.; Joiret, S.;
Wilinski, J. J. Electrochem. Soc. 1990, 137, 2684. 9. Szklarska-Smialowska, Z.; Kozlowski, W. Corrosion
1984, 40, 595.
10. Zakroczymski, T.; Fan, C.-J.; Szklarska-Smialowska, Z. J. Electrochem. Soc. 1985, 132, 2862.
11. Flis, J.; Oranowska, H.; Szklarska-Smialowska, Z.
Corros. Sci. 1990, 30, 1085.
12. Geronov, Y.; Tomov, T.; Georgiev, S. J. Appl.
Elec-trochem. 1975, 5, 351.
13. Huang, Z.Q.; Ord, J.L. J. Electrochem. Soc. 1985, 132, 24.
14. Burke, L.D.; Lyons, M.E.G. J. Electroanal. Chem and
Interfacial Electrochem 1986, 198, 347.
15. Zhang, H.; Park, S.M. J. Electrochem. Soc. 1994, 141, 718.
16. Zou, J.; Chin, D. Electrochim. Acta 1987, 32, 1751. 17. Zou, J.; Chin, D. Electrochim. Acta 1988, 33, 477. 18. Armstrong, R.D.;Baurhoo, I. J. Electroanal. Chem.
and Interfacial Electrochem. 1972, 40, 325.
19. Valentini, C.R.; Moina, C.A.; Vilche, J.R.; Arvia, A.J.
Anales Asoc. Quím. Argentina 1983, 71, 555.
20. Valentini, C.R.; Moina, C.A.; Vilche, J.R.; Arvia, A.J.
Corros. Sci. 1985, 25, 985.
21. Castro, E.B.; Valentini, C.R.; Moina, C.A. Vilche, J.R.; Arvia, A.J. Corros. Sci. 1986, 26, 781.
22. Castro, E.B.; Vilche, J.R.; Arvia, A.J. Corros. Sci.
1991, 32, 37.
23. Davies, D.H.;Burstein, G.T. Corrosion 1980, 36, 416. 24. Rangel, C.M.; Fonseca, I.T.; Leitão, R.A.
Electro-chim. Acta 1986, 31, 1659.
25. Rangel, C.M.; Fonseca, I.T.; Leitão, R.A.
Electro-chim. Acta 1989, 34, 255.
26. Gui, J.; Devine, T.M. Corros. Sci.1995, 37, 1177. 27. Davenport, A.J.; Bardwell, J.A.; Vitus, C.M. J.
Elec-trochem. Soc. 1995, 142, 721.
28. Davenport, A.J.; Sansone, M. J. Electrochem. Soc.
1995, 142, 725.
29. Ohtsuka, T.; Ju, J.-C.; Ito, S.; Einaga, H. Corros. Sci.
1994, 36, 1257.
30. Kozlowski, W.;Flis, J. Corros. Sci. 1988, 28, 787. 31. Kozlowski, W.;Flis, J. Corros. Sci. 1991, 32, 861. 32. Rubim, J. J. Electrochem. Soc. 1993, 140, 1601. 33. Gui. J.; Devine, T.M. Corros. Sci. 1994, 36, 441. 34. Kuroda, K.; Cahan, B.D.; Nazri, Gh.; Yeager, E.;
Mitchell, T.E. J. Electrochem. Soc. 1982, 129, 2163. 35. Debnath, N.C.; Anderson, A.B. J. Electrochem. Soc.
1982, 129, 2169.
36. Kruger, J. Corros. Sci. 1989, 29, 149. 37. Bockris, J.O’M. Corros. Sci. 1989, 29, 291.
38. Searson, P.C.; Latanision, R.M.; Stimming, U. J.
Electrochem. Soc. 1988, 135, 1358.
39. Rauscher, A.; Konno, H.; Nagayama, M. Electrochim.
Acta 1977, 22, 823.
40. Vértes, Cs.; Varsányi, M.L.; Vértes, A.; Meisel, W.; Gütlich, P. Electrochim. Acta 1993, 38, 2253. 41. Szklarska-Smialowska, Z.; Zakroczymski, T.; Fan,
C.-J. J. Electrochem. Soc. 1985, 132, 2543.
43. Juanto, S.; Schrebler, R.S.; Zerbino, J.O.; Vilche, J.R.; Arvia, A.J. Electrochim. Acta 1991, 36, 1143. 44. Takahashi, K.; Bardwell, J.A.; MacDougall, B.;
Gra-ham, M.J. Electrochim. Acta 1992, 37, 477.
45. MacDonald, D.D.; Roberts, B. Electrochim. Acta
1978, 23, 557.
46. MacDonald, D.D.; Roberts, B. Electrochim. Acta
1978, 23, 781.
47. Amaral, S.T. Iron Electrochemical behaviour in
Alka-line Solution Containing Sodium Silicate, Dr. Thesis,
UFRGS, Brasil, 1996.
48. Misawa, T. Corros. Sci. 1973, 13, 659.