Brazilian Journal of Physics, vol. 36, no. 3B, September, 2006 925
Phase Evolution of the Electronic Transmission Through a Kondo Correlated Quantum Dot
R. Franco, J. Silva-Valencia,
∗Departamento de F´ısica, Universidad Nacional de Colombia, A.A. 5997, Bogot ´a, Colombia
and M. S. Figueira
∗Instituto de F´ısica, Universidade Federal Fluminense,
Avenida Litorˆarea s/n, 24210-346, Niter´oi, Rio de Janeiro, Brazil
Received on 8 December, 2005
We study the scattering phase shift of the Kondo assisted transmission through a quantum dot (QD), consid-ering a model that includes an additional non resonant channel transmission. To compute the phase evolution and the transmission amplitude of the QD, for different temperatures, we describe the QD employing the single Anderson impurity model in the limit of infinity Coulomb repulsion, within the X-boson approach. Our results are consistent with the development of an unusually large phase evolution at aroundπ in the Kondo valley, observed in recent experiments, and is consistent with others theoretical treatments.
Keywords: Quantum dots; Scattering phase; Kondo effect; X-boson
I. INTRODUCTION
The scattering phase shift of the Kondo effect cannot be ac-cessed in bulk Kondo systems or in mesoscopic systems by means of conductance measurements [1–3]. It was theoreti-cally predicted that the Kondo scattering in the unitary limit (the localized occupation numbernf ≈1), of the impurity An-derson model induces a phase shift ofπ/2 [4]. However, re-cent experimental results for a quantum dot (QD) embedded in a double path electronic interferometer [1, 2], presents anom-alous behavior, as plateaus of the phase shift at aroundπ. Re-cent theoretical work [5], employing the Anderson impurity model to describe the QD and using the numerical renormal-ization group (NRG) technique, predicts the existence of a π/2 plateaus for the phase evolution of the QD in the Kondo limit. This prediction disagrees with the experimental reports of Y. Ji et.al. [2] which measures the complex transmission amplitude of a QD near the unitary limit and observed that the transmission phase evolves almost linearly over a range of about 1.5π, when the Fermi energy was scanned through a spin degenerate energy level of the QD. Another theoretical treatment, developed to describe the same problem [6], em-ploys the Kondo model for a single and multilevel QD and using scale arguments obtain results that agree well with the experiments [1, 2] in the Coulomb blockade regime, but fail to explain the large span of the phase shift in the Kondo regime [2]. Other argument suggested that the stochastic fluctuation of the Kondo temperature (TK) due to topology, finite size effects and mesoscopic fluctuations, should originate serious limitations to determine the transmission phase through a QD [7].
We consider a model that includes a weak direct non-resonant transmission through a QD, represented in Fig. 1 by the pathW as well as a Kondo-resonant transmission chan-nel represented in the same figure by the leads connected to the quantum dot by the hopping term V. This model was previously discussed employing the slave boson mean field technique (SBMFT) [8]. The importance of including more than one resonant transmission channel is that the Fano-type
R W
QD
V V
L
FIG. 1: Pictorial view of the embedded QD in the leads. The hop-ping between the leads and the QD is represented by the letterVand the tunneling amplitudeW is responsible for the direct transmission between the left and right leads.
interference between the resonant and the non-resonant trans-mission channel can provide a possible explanation for the anomalous phase drop accompanied by transmission zero [9– 11]. Our model is formally equivalent to a two terminal AB interferometer containing a QD [12], but in this work the phase shift is not computed and the reference arm is associated with our direct transmission termW. It is necessary to high-light, that in our treatment the non-resonant direct channel, describes the direct transmission through the QD. The phase shift computed, takes into account the transmission through all the system (resonant transmission of the QD channel, and theW-direct channel) and not only through the QD [5].
926 R. Franco et al.
II. MODEL
We employ the model HamiltonianH=HL+HR+HD+HT to describe the QD system, represented in a pictorial form in Fig. 1. The Hamiltonian for the left (L) and right (R) leads are given by
Hα=
∑
k,αEk,αc†k,α,σck,α,σ (α=L,R), (1)
wherec†k,α,σ(ck,α,σ) is a creation (destruction) operator of an
electron with energyEk,α, momentumkand spinσon the lead
α. The interacting QD is described by
HD=
∑
σEd,σXd,σσ, (2)
where this term describes the Anderson impurity character-ized by a localcharacter-ized d level Ed,σ, (we employ the d letter
to indicate the localized electrons at the impurity site). We work in the infinite correlation limit U =∞, because this limit is able to catch all the relevant physics of the Kondo effect and the Yang Ji et.al. experiment [1, 2] were per-formed in a strong correlated QD (U=1.5meV) [15]. We shall employ the Hubbard operators [16] to project out the doubly occupied state |d,2ifrom the local states of the im-purity. The identity decomposition in the reduced space of impurity local states is given by Xd,00+Xd,σσ+Xd,σσ =I,
whereσ=−σ, and the threeXd,aaare the projectors into the corresponding states|d,ai. The occupation numbers on the impuritynd,a=<Xd,aa>satisfy the “completeness” relation
nd,0+nd,σ+nd,σ=1. The tunneling HamiltonianHT is
HT =
∑
α=L,R
∑
k,σ³
VαXd†,0σck,α,σ+H.c.
´
(3)
+
∑
k,k′,σ ³
W c†L,k,σcR,k′,σ+H.c. ´
.
The tunneling amplitudeW is responsible for the direct trans-mission between the two leads, andVαfor the tunneling
be-tween the QD and the leadα.
For simplicity, we assume symmetric junctions (i.e. VL=
VR=V) and identical leads. The direct tunneling matrix ele-mentW =|W|exp(iη), while the hopping matrix elementsVα
can be kept as positive real numbers without loss of general-ity. Theηstands for the phase difference between the reso-nant and the non resoreso-nant component and here we assume that η=0,π[8].
Using the Friedel’s relation between the scattering matrix and the local Green’s functions (GF) [4, 8] one can write the transmission amplitude of the electrons with energyE from the left to the right lead as
tLR(E) = iexp(iη)|tb|+iexp(iη)Γe f fG˜QD(E) (4)
[|rb|cos(η)−i(|tb|+sin(η)],
where|tb|=2x/(1+x2)withx=πρcW is the amplitude of the direct transmission, with ρc being the conduction den-sity of states of the leads and |rb| is obtained by the rela-tion |tb|2+|rb|2=1. G˜QD(E) =V2DσGf(E)G2c(E) is the local dressed GF, that describes a QD embedded between the two leads, withV being the hybridization, Dσis a
vari-ational X-boson parameter, Gf(E)and Gc(E) are the GF’s of the QD and the conduction band, represented here by the leads. These GF’s are obtained by the X-boson approach [13, 14]. The effective hybridization parameter is obtained byΓe f f =Γ/(1+x2), withΓ=2πρcV2. In our approxima-tion we employ the local GF for the QD, obtained using the X-boson treatment for the impurity case [13, 14].
The limit of unitary direct transmission(|tb| ∼1), was pre-viously investigated by us for a ballistic quantum wire coupled to a QD [13]. At finite temperatures, we consider the thermal average of the transmission amplitude
tLR=
Z µ
−∂nf
∂E ¶
tLR(E)dE, (5)
wherenf is the Fermi-Dirac distribution function.
-10 -9 -8 -7 -6 -5 -4 -3 -2 -1 0 1 2 3
-Ef/Γeff
0.0 0.2 0.4 0.6 0.8 1.0
|tLR
|
T=10-3Γeff
T=0.02Γeff
T=0.5Γeff
|t
b|=10
-6
FIG. 2: Magnitude of the transmission amplitude|tLR|forη=0 and |tb|=10−6vs.−Ef/Γe f f, for different temperatures.
III. RESULTS AND DISCUSSION
To simplify the calculations we represent the leads by a square conduction band of half-width D and we employ in the numerical calculations the following parameters set: D=100∆with∆=πV2/2D=1, |t
b|=10−6 (figures 1-2),
|tb|=0.2 (figures 3-6) andη=0 in all the figures.
Brazilian Journal of Physics, vol. 36, no. 3B, September, 2006 927
-10 -9 -8 -7 -6 -5 -4 -3 -2 -1 0 1 2 3
-Ef/Γeff
0.0 0.1 0.2 0.3 0.4 0.5 0.6
∆γ/π
T=10-3Γeff
T=0.02Γeff
T=0.5Γeff
|t
b|=10
-6
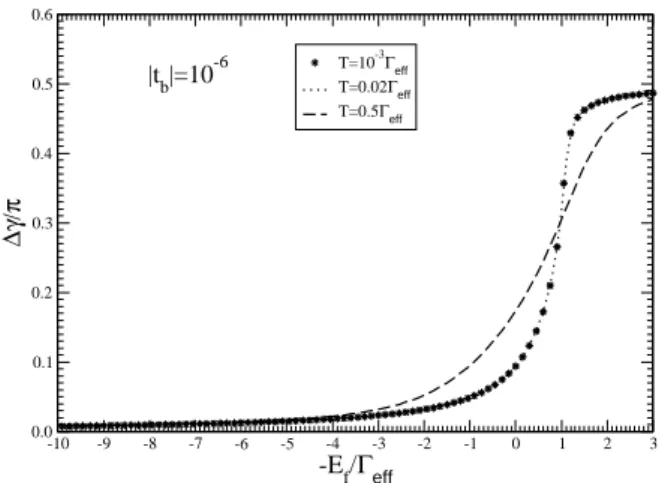
FIG. 3: The phase shift∆γforη=0 and|tb|=10−6vs.−Ef/Γe f f, for different temperatures.
the temperature increases, the Kondo effect vanishes and the maximum decreases.
In Fig. 3 we present the phase shift∆γ/πvs.−Ef/Γe f f, for different temperatures and the same parameter set of Fig. 2. The results are consistent with the expectedπ/2 phase change in the Kondo limit.
-10 -9 -8 -7 -6 -5 -4 -3 -2 -1 0 1 2 3
-Ef/Γeff
0.0 0.1 0.2 0.3 0.4 0.5 0.6 0.7 0.8 0.9 1.0 1.1
|tLR
|
T=0.02Γeff
T=0.5Γeff
T=10-3Γeff
|t
b|=0.2
FIG. 4: The magnitude of the transmission amplitude |tLR| vs. −Ef/Γe f f, for different temperatures.
In Fig. 4 we present the magnitude of the transmission am-plitude|tLR|, for the same parameter set of Fig. 2, but now em-ploying|tb|=0.2 (finite transmission probability for the direct channel). Comparing the figures 2 and 4 we can see that the transmission|tLR|presents little variation in both figures what agrees with the results presented in reference [8] but in Fig. 5 we present the corresponding phase shift∆γ/πvs.−Ef/Γe f f and we obtain a unusually large plateau of the phase evolution at aroundπ. As we work in the strong Coulomb correlation limitU→∞when the QD total occupation number is closest to its maximum valuenQD=1, we describe the phase shift in the Coulomb blockade valley regime. Our results show that in this situation the phase shift∆γ/πfollows the Coulomb block-ade regime presented in a recent experimental report [1, 2],
-4 -3 -2 -1 0 1 2 3
-Ef/Γeff
0.0 0.1 0.2 0.3 0.4 0.5 0.6 0.7 0.8 0.9 1.0 1.1
∆γ/π
T=10-3Γeff
T=0.02Γeff
T=0.5Γeff
|t
b|=0.2
FIG. 5: The phase shift∆γvs.−Ef/Γe f f, for different temperatures.
0.001 0.01 0.1 1 10
T/Γeff
0.0 0.1 0.2 0.3 0.4 0.5 0.6 0.7 0.8 0.9 1.0
|tLR
|
Ef=-Γeff
Ef=-0.5Γeff
Ef=0.0Γeff
Ef=0.5Γeff
Ef=Γeff
|tb|=0.2
FIG. 6: The magnitude of the transmission amplitude |tLR| vs.
T/Γe f f, for different regimes of the QD.
and in a theoretical work [8].
In Fig. 6 we show the magnitude of the transmission am-plitude|tLR|vs. temperatureT/Γe f f, for different values of
Ef, associated with different regimes of the QD; empty dot, intermediate valence and Kondo. Our results agree qualita-tively with those expected for an embedded QD [5, 18]. In Fig. 7 we present the phase shift∆γvs. theEf level energy in the QD. ForEf<0;Ef =−0.5Γe f f andEf =−Γe f f, (Kondo regime) the∆γ/πmagnitude is closer to 0.5, at low temper-atures, which agrees with the results for the phase shift of the conventional impurity Kondo problem. At temperatures greater than theTK, for all the cases the phase shift is closest to the value 0.8, which agrees with our result for the Coulomb blockade regime.
IV. CONCLUSIONS
928 R. Franco et al.
0.001 0.01 0.1 1 10
T/Γeff
0.0 0.1 0.2 0.3 0.4 0.5 0.6 0.7 0.8 0.9
∆γ
/
π
Ef=-Γeff
Ef=-0.5Γeff
Ef=0.0Γeff
Ef=0.5Γeff
Ef=Γeff
|t
b|=0.2
FIG. 7: The phase shift of the transmission amplitude∆γvs.T/Γe f f, for different regimes of the QD.
way, producing plateaus of∆γnearπ, as function of the QD energyEf. These results agree with the experimental report of Y. Ji et.al. [1, 2] in the transition from the Kondo to Coulomb blockade regime.
Acknowledgments
We acknowledge the financial support of the Colombia National University, DINAIN-project:20601003550 and DIB-project:803954, CNPq(Brazilian National Research Council) and FAPERJ (Rio de Janeiro State Research Foundation), from the grant “Primeiros projetos”.
[1] Y. Ji, M. Heiblum, D. Sprinzak, D. Mahalu, and H. Shtrikman, Science290, 779 (2000).
[2] Y. Ji, M. Heiblum, and D. Shtrikman, Phys. Rev. Lett. 88, 076601 (2002).
[3] W. G. Van der Wiel, S. De Franceschi, T. Fujisawa, J. M. Elz-erman, S. Tarucha, and L. P. Kouwenhoven, Science289, 2105 (2000).
[4] D. C. Langreth, Phys. Rev.150, 516 (1966).
[5] U. Gerland, J. von Delft, T. A. Costi, and Y. Oreg. Phys. Rev. Lett.84, 3710 (2000).
[6] P. G. Silvestrov and Y. Imry. Phys. Rev. Lett.90, 106602 (2003). [7] C. H. Lewenkopf and H. A. Weidenm¨uller. Phys. Rev. B71,
121309(R) (2005).
[8] K. Kang, Mahn-Soo Choi, and Seongjae Lee, Phys. Rev. B71, 045330 (2005).
[9] H. Xu and W. Sheng Phys. Rev. B57, 11903 (1998). [10] P. S. Deo, Solid State Comm.107, 69 (1998).
[11] C. M. Ryu and S. Y. Cho, Phys. Rev. B58, 3572 (1998). [12] B. R. Bulka and P. Stefa´nski, Phys. Rev. Lett.86, 5128 (2001). [13] R. Franco, M. S. Figueira, and E. V. Anda, Phys. Rev. B67,
155301 (2003).
[14] R Franco, M. S. Figueira, and M. E. Foglio, Phys. Rev. B66, 045112 (2002).
[15] Yigal Meir, Ned S. Wingreen, and Patrick A. Lee, Phys. Rev. Lett.70, 2601 (1993).84, 3710 (2000).
[16] J. Hubbard, Proc. R. Soc. London, Ser. A 77, 237 (1964). [17] P. Coleman, Phys. Rev. B29,3035 (1984); Phys. Rev. B.35,
5072 (1987).