Pion-Pion and Pion-Proton Correlations - New Results from CERES
∗Dariusz Anto´nczyk and Dariusz Mi´skowiec for the CERES Collaboration Gesellschaft f¨ur Schwerionenforschung mbH, Planckstr. 1, 64289 Darmstadt, Germany
Received on 17 January, 2007
Results of a new two-particle correlation analysis of central Pb+Au collision data at 158 GeV per nucleon are presented. The emphasis is put on pion-proton correlations and on the dependence of the two-pion correlation radii on the azimuthal emission angle with respect to the reaction plane.
Keywords: HBT; Interferometry; Two-particle; Non-identical; Reaction plane
I. EXPERIMENT AND DATA ANALYSIS
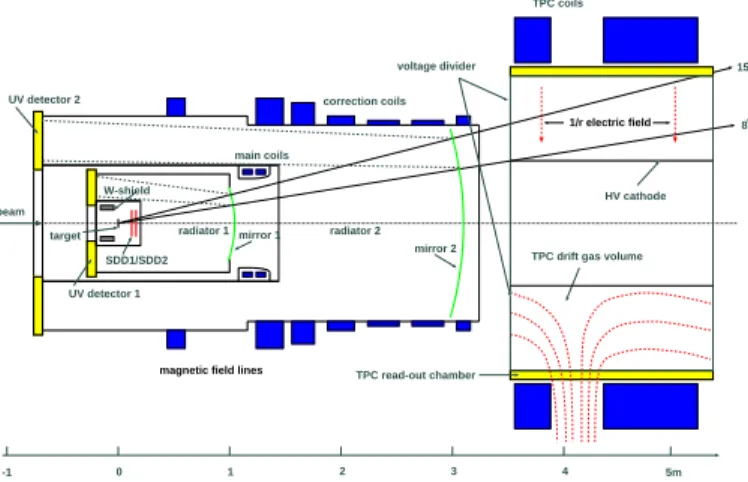
CERES is a dilepton experiment at the CERN SPS, known for its observation of enhanced production of low mass e+e− pairs in collisions between heavy nuclei [1]. The upgrade of CERES in 1997-1998 by a radial Time Projection Chamber (TPC) allowed to improve the momentum resolution and the particle identification capability while retaining the cylindri-cal symmetry (Fig. 1). The TPC also opened the possibility of measuring hadrons. The upgraded experiment has been de-scribed in detail elsewhere [2].
The measurement of central Pb+Au collisions at the maxi-mum SPS energy of 158 GeV per nucleon in the fall of 2000 was the first run of the fully upgraded CERES and at the same time the last run of this experiment. About 30 million Pb+Au collision events at 158 GeV per nucleon were collected, most of them with centrality within the top 7% of the geometrical cross sectionσG= 6.94 b. Small samples of the 20% and the
minimum bias collisions, as well as a short run at 80 AGeV,
beam UV detector 2
UV detector 1 W-shield
target SDD1/SDD2
radiator 1 mirror 1 main coils
correction coils
radiator 2 mirror 2
8o
15o
TPC drift gas volume
TPC read-out chamber
TPC coils
-1 0 1 2 3 4 5m
magnetic field lines
1/r electric field voltage divider
HV cathode
FIG. 1: ( Color online) Upgraded CERES setup in 2000. The appa-ratus has a cylindrical symmetry. The beam enters from the left. The silicon detectors (SDD) give tracking and vertex reconstruction, and the Ring Imaging Cherenkov detectors (RICH) electron identifica-tion. The results presented here are mostly based on the momentum (and energy loss) measurements performed with the Time Projection Chamber (TPC).
∗Based on the Ph.D. thesis work of Dariusz Anto´nczyk, Technical University
Darmstadt, 2006
were recorded in addition. The first two-particle correlation analysis performed on a subset of these data resulted, among others, in an improved procedure to account for the Coulomb interaction [3] and a new postulate of a universal freeze-out criterion [4]. The current analysis features a better momen-tum resolution
∆p
p =2%⊕1%·p/(GeV/c), (1) a better understanding of the two-track resolution, and was performed on the full data set. Then(pt,y) distribution of the analyzed pairs is shown in Fig. 2.
π π
y 0.5 1 1.5 2 2.5 3 (GeV/c)π
π
p
0 0.2 0.4 0.6 0.8 1 1.2 1.4 1.6 1.8 2
0 500 1000 1500 2000 2500 3000 3 10
×
+ p
-π
y 0.5 1 1.5 2 2.5 3 (GeV/c)+
p
-π
p
0 0.5 1 1.5 2 2.5 3 3.5 4
0 100 200 300 400 500 600 3 10
×
FIG. 2: (Color online) Distributions of the analyzed two-pion (top)
(mrad)
φ ∆
-100 0 100
(mrad)
θ
∆
-40 -20 0 20 40
tru/mix
0.98 1 1.02
(mrad)
φ ∆
-100 0 100
(mrad)
θ
∆
-40 -20 0 20 40
tru/mix
0.98 1 1.02
FIG. 3: (Color online) Track reconstruction efficiency in the case of the magnetic field bringing the tracks apart from (left) or closer to (right) each other. The two topologies were dubbed “sailor” and “cowboy”, respectively, and required different two-track separation
cuts∆φ: 38-45 mr for sailor and 90-140 mr for cowboy, depending
on the transverse momentum. TheΘseparation cut was 8-9 mr.
The two-track resolution cuts applied to the true pairs and to the pairs from event mixing were different for the two pos-sible track pair topologies (Fig. 3). It should be noted that the required two-track cuts depended somewhat on the qual-ity cuts applied to single tracks: the higher number of hits required for single tracks, the more pairs were lost because of the finite two-track resolution. The two-pion analysis was performed in the longitudinally co-moving frame (LCMS) de-fined by the vanishing z-component of the pair momentum. The momentum difference in this frame,q=p2-p1, was
de-composed into the “out”, “side”, and “long” components fol-lowing the Bertsch-Pratt convention, withqoutpointing along
the pair transverse momentum andqlongalong the beam. The
non-identical correlations were analyzed in the pair c.m.s., the frame in which the pair momentum is zero. The two compo-nents there,qandq⊥, were defined such thatqwas along the pair transverse momentum, i.e.qwas equal toqoutif the
latter is calculated in the pair c.m.s.
II. TWO-PION CORRELATIONS
Theπ−π−andπ+π+correlation functions, defined as the three-dimensional distributions of pion pairs from the same eventn(q), normalized to the analogous distributions of pairs constructed from different events (event mixing), were fitted by
C2(q) =N·
(1−λ) +λ·Fc(qinv)
1+exp
− 3
∑
i,j=1
R2i jqiqj
.
(2)
The normalization factorNis needed because the number of pairs from event mixing is arbitrary. The correlation strength
λ<1 reflects the tails of the source distribution caused by the pions from long-lived resonances, the finiteq-resolution, and the contamination of the pion sample by other particle species. The R2i j fit parameters, with the indicesi,j being{out, side, long}, are related to the size of the source emitting pions of given momentum [5] and will be called here HBT radii. The Fc(qinv)factor,qinv=
−(pµ2−pµ1)2, accounts for the mutual
Coulomb interaction between the pions and was calculated by
averaging the nonrelativistic Coulomb wave function squared over a realistic source size. The Coulomb factor was attenu-ated byλsimilarly as the rest of the correlation function peak; the importance of this approach was demonstrated in [3]. The fits were performed by the minimum negative loglikelihood method with the Poissonian number of true pairs and were done separately for each pair (pt,y) bin. The HBT radii ob-tained from the fit were corrected for the finite momentum resolution. The correction was determined by Monte Carlo and was rather insignificant forRsideandRlong; forRoutit gets
as large as≈20% for the highest bin of the pair pt. The ob-tained HBT radii show a strong pt dependence (Fig. 4). The RsideandRlongradii were fitted with [6, 7]
Rside(pt) =
R2G 1+mtη2f/T
(3)
Rlong(pt) = τf
T mt
K2(mt/T)
K1(mt/T)
(4)
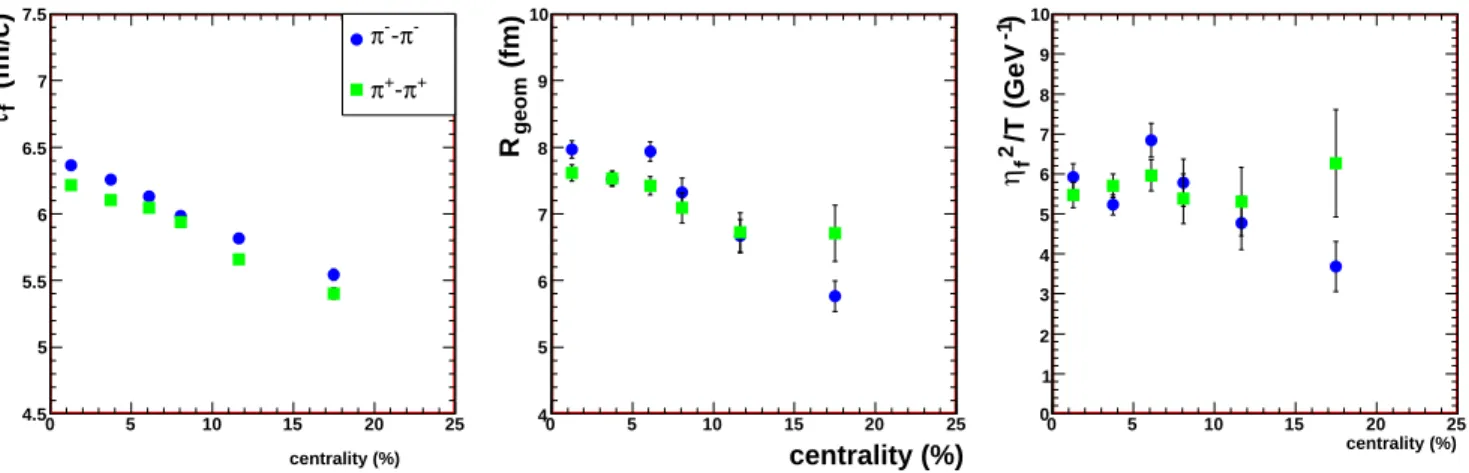
with the freeze-out temperatureT fixed to be 120 MeV. The results of the fit are shown in Fig. 5. The obtained expansion timeτof 5.5-6.5 fm, geometrical source sizeRGof 6-8 fm, and transverse expansion rapidityηf of 0.7-0.8, in reasonable agreement with the results of the previous analysis of a subset of data [3], indicate a long-living, longitudinally and transver-sally expanding pion source.
.
out
R Rside
p r e l i m i n a r y long
R
-π
-π
+
π
-+
π Fit
geom
R Sinyukov Fit
0 0.2 0.4 0.6 0.8 0 0.2 0.4 0.6 0.8 0 0.2 0.4 0.6 0.8 1.0
(GeV/c)
k k (GeV/c) k (GeV/c)
1 2 3 4 5 6 7 8 9
Radii (fm)
out
R Rside
p r e l i m i n a r y long
R
-π
-π
+
π
-+
π Fit
geom
R Sinyukov Fit
0 0.2 0.4 0.6 0.8 0 0.2 0.4 0.6 0.8 0 0.2 0.4 0.6 0.8 1.0
(GeV/c)
k k (GeV/c) k (GeV/c)
1 2 3 4 5 6 7 8 9
Radii (fm)
FIG. 4: (Color online) Transverse momentum dependence of the
source radii obtained from theπ−π−andπ+π+correlation analysis.
The top and the bottom panels show the most and the least central
bins (0-2.5% and 15-35% ofσG), respectively. Thek⊥ shown in
centrality (%) 0 5 10 15 20 25
(fm/c)
f
τ
4.5 5 5.5 6 6.5 7 7.5
-π
-π
+ π
-+ π
centrality (%)
0 5 10 15 20 25
(fm)
geom
R
4 5 6 7 8 9 10
centrality (%) 0 5 10 15 20 25
)
-1
(GeV
/T
f
2
η
0 1 2 3 4 5 6 7 8 9 10
FIG. 5: (Color online) Centrality dependence of the pion source parameters obtained from fits (3) and (4). The data are preliminary and come from central Pb+Au collisions at 158 GeV per nucleon.
III. AZIMUTHAL ANGLE DEPENDENT HBT
A fireball created in a collision with a finite impact parame-ter is elongated in the direction perpendicular to the reaction plane. In the course of expansion, with the pressure gradient larger in-plane than out-of-plane, the initial asymmetry should get reduced or even reversed. A dependence of the two-pion correlations on the pair emission angle with respect to the re-action plane would be a signature of the source eccentricity at the decoupling time. The azimuthal angle of the reaction plane was estimated by the preferred direction of the particle emission aka elliptic flow. The particles were weighted with their transverse momentum:
QX2 =
∑
i
ptcos(2φi) (5) QY2 =
∑
i
ptsin(2φi). (6)
The raw distributionn(QX2,QY2)is shown in Fig. 6. The reac-tion plane angle was calculated (moduloπ) from the calibrated Q2components via
ΦRP=
1 2arctan
QY
2
QX
2
. (7)
The resolution of the so determined reaction plane angle, es-timated via the subevevent method, was 31-38o.
With the event plane known (within the resolution) event-by-event the pion pairs can be sorted into 8 bins covering (−π/2,π/2)according to their azimuthal angle with respect to the reaction plane Φ∗=Φ
pair−ΨRP. During event
mix-ing it was required that the two events had a similar reaction plane angleΨRP. The eight correlation functions were fitted
as described in Section II, and the resultingRout,Rside,Rlong,
and the cross-terms are plotted versusΦ∗. The squared source radii were then fitted with
R2i =R2i,0+2R2i,2cos(2Φ∗), (8)
withidenoting{out,side,long}. While theRi,0’s obtained
co-incide with the results of the standard HBT analysis presented in Section II, the second Fourier componentsRi,2’s represent
the eccentricity of the observed pion source. The normalized second Fourier component ofRsideis shown in Fig. 7. As far
as the limited centrality range allows to judge the measured Rsideanisotropy is consistent with zero, in contrast to the
out-of-plane elongated pion source observed both at the AGS [8] and at RHIC [9]. The source eccentricity, thus, seems to be joining the exclusive club of heavy ion observables which be-have non-monotonically with the collision energy, the other members being the flow and the strangeness-to-entropy ratio.
2, TPC X
Q -0.2 -0.15 -0.1 -0.05 -0 0.05 0.1 0.15 0.2
2, TPC
Y
Q
-0.2 -0.15 -0.1 -0.05 -0 0.05 0.1 0.15 0.2
FIG. 6: (Color online) The raw distribution of the(QX
2,QY2)vector
centrality in percent
0 20 40 60 80
2 side,0
/R
2 side,2
4 R
-0.2 -0.1 0 0.1 0.2 0.3 0.4
0.5 p r e l i m i n a r y 0.6
FIG. 7: (Color online) Azimuthal source eccentricity, represented by
the normalized second Fourier component ofRside(Φ∗), vs.
central-ity. The CERES result (black full dots) is much closer to zero than the analogous measurement at the AGS (open red squares) and RHIC (open blue triangles).
IV. PION-PROTON CORRELATIONS
For the top central 7% of the geometrical cross section the high event statistics allows to perform the proton-pion corre-lation analysis. The shape of non-identical particle correcorre-lation functionsC(q)reflects the shape of the relative source distrib-utionsS(rµ2−r1µ). Particularly, a difference between the aver-age freeze-out position or time of two particle species reveals itself as an asymmetry of the correlation function at smallq [10]. A two-dimensionalπ−p correlation functionC(q,q⊥) and its sliceC(q) for q⊥<50 MeV/c are shown in Fig. 8. The peak at lowqcomes from the attractive Coulomb inter-action. The peak asymmetry indicates that the proton source is located at a larger radius than the pion source, or that pro-tons are emitted earlier than pions. The asymmetry can be conveniently parametrized by fitting a Lorentz curve, which happens to match the shape, separately to the left and to the right half of the peak, and taking the ratio of the two widths:
C2(q) =
N·
1+ a
(q/σ−)2+1
, q<0 N·
1+ a
(q/σ+)2+1
, q>0
(9)
whereNis a normalization factor andais the peak amplitude. The asymmetry is then defined as the ratio between the two widths
A
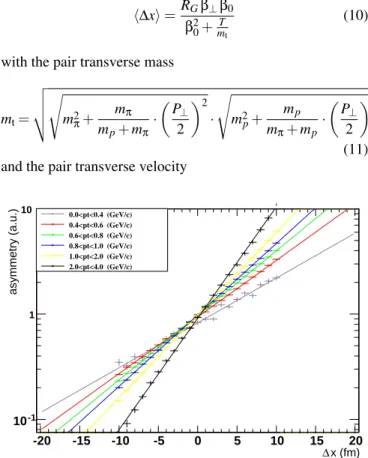
=σ−/σ+.The asymmetry was translated to a spatial displacement be-tween the proton and pion sources using a Monte Carlo pair generator with realistic source sizes and the Coulomb wave function squared as a weighting factor for each pair. The lation between the two quantities is shown in Fig. 9. The re-sulting displacement ∆xas a function of the transverse pair
FIG. 8: (Color online) Two-dimensionalπ−p correlation function
C(q,q⊥) (left) and its sliceC(q) forq⊥<50 MeV/c (right). The
peak asymmetry in the right hand plot indicates that the proton source is located at a larger radius than the pion source, or that protons are emitted earlier than pions. The asymmetry can be parametrized using Eq. (9).
momentum is shown in the right panel of Fig. 10. In the left panel the raw asymmetry
A
is shown. The asymmetry and thedisplacement derived from it vanish in the limit of small pair pt as is expected for symmetry reasons. The displacement is rather similar to the spatial displacement seen in UrQMD v.1.3 [11] (green line). The red and blue lines represent a simulta-neous fit toRside(pt) and∆x(pt) using, respectively, Eq.(3) and the formula derived in [12]:
∆x=RGβ⊥β0
β2
0+mTt
(10)
with the pair transverse mass
mt=
m2
π+
mπ
mp+mπ
·
P
⊥ 2
2 ·
m2
p+
mp mπ+mp
·
P
⊥ 2
2 ,
(11) and the pair transverse velocity
-20 -15 -10 -5 0 5 10 15 20
-1
10
1
10 0.0<pt<0.4 (GeV/c) 0.4<pt<0.6 (GeV/c) 0.6<pt<0.8 (GeV/c) 0.8<pt<1.0 (GeV/c) 1.0<pt<2.0 (GeV/c) 2.0<pt<4.0 (GeV/c)
x (fm)
∆
asymmetry (a.u.)
0 1 2 3 4 0 1 2 3 4 (GeV/c)
P P (GeV/c)
0 0 0
1 1 1
2 2 2
3 3 3 4
asymmetry
asymmetry
asymmetry
-2 -2 -2
0 0 0
2 2 2
4 4 4
6 6 6
8 8 8 10
x (fm
)
∆
x (fm)
∆
x (fm)
∆
p r e l i m i n a r y
FIG. 10: (Color online) Left:π+-proton (top) andπ−-proton (center) correlation peak asymmetry, defined as the ratio between the two
half-widths in Eq. (9), vs. the pair transverse momentum. The asymmetry is larger than one which indicates that protons on average freeze-out
at a larger radius (or earlier time) than pions. No asymmetry is visible in theπ+π−correlations (bottom panel). For symmetry reasons all
peak asymmetries must vanish at small pt’s. Right: the source displacement deduced from the asymmetry. The green lines represents the
displacements extracted from UrQMD forpt’s between 0 and 2 GeV/c. The long lines show the fit described in text. The data are preliminary
and come from central Pb+Au collisions at 158 GeV per nucleon.
β⊥= 1
1+mπ+mp
P⊥
2
. (12)
The relation between the rapidityηf and the velocity β0of
transverse flow, which occur in theRsideand∆xfit formulas,
respectively, is
ηf =
1 2ln
1+β0
1−β0
. (13)
The fit yields aβ0of 0.65-0.70 and aRGof about 7.5 fm. The fit is dominated by theRsidedata with their small error bars
but it reproduces the∆xvalues quite well. This indicates that the finite displacement between the sources of pions and pro-tons has a similar origin as theptdependence ofRside, namely
the transverse flow. Other, possibly more interesting, contri-butions to it cannot be addressed with the present statistics of the data.
V. BLAST-WAVE PARAMETRIZATION
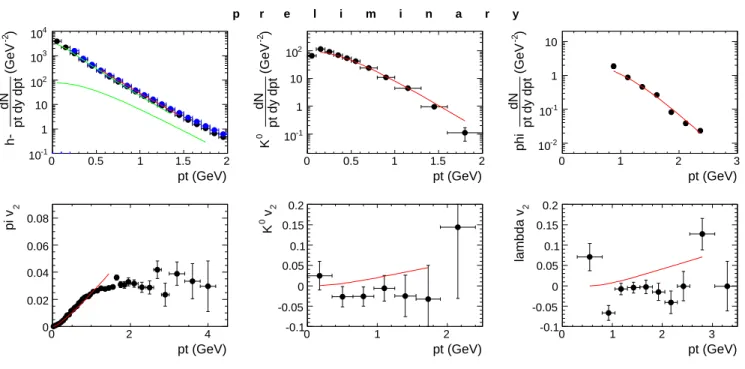
While it is notoriously difficult to describe many observ-ables of heavy ion collisions within the same theoretical ap-proach, in recent years simple hydrodynamics-inpired para-metrizations turn out to be quite successful in this aspect. The blast-wave model of [13], with its 8 parameters adjusted ac-cordingly, nicely reproduces the transverse momentum spec-tra, the elliptic flow, and the two-particle correlations of CERES, including the emission angle dependence (or, rather, the lack of it). The transverse spectra and the elliptic flow co-efficients from the top 7% ofσG for several hadron species
pt (GeV)
0 0.5 1 1.5 2
)
-2
(GeV
pt dy dpt
dN
h--1
10 1 10
2
10
3
10 10
pt (GeV)
0 0.5 1 1.5 2
)
-2
(GeV
pt dy dpt
dN
0
K
-1
10 1 10
2
10
pt (GeV)
0 1 2 3
)
-2
(GeV
pt dy dpt
dN
phi -2
10
-1
10 1 10
pt (GeV)
0 2 4
2
pi v
0 0.02 0.04 0.06 0.08
pt (GeV)
0 1 2
2
v
0
K
-0.1 -0.05 0 0.05 0.1 0.15 0.2
pt (GeV)
0 1 2 3
2
lambda v
-0.1 -0.05 0 0.05 0.1 0.15 0.2
FIG. 11: (Color online) Transverse momentum spectra of negatively charged particles, K0, andφ-meson (top) and elliptic flow coefficient for
pions, K0, andΛ(bottom), compared to the blast-wave model (red line). The two green lines in the top left plot represent negative pions and
kaons, the sum of the two being the red line to be compared to the data. The data are preliminary and come from central Pb+Au collisions at 158 GeV per nucleon.The black and blue points represent the negative and positive pions, respectively.
temperatureT=100 MeV and the sharpness of the emission volumea=0.01 (sharp). The other six parameters, adjusted to the data by the simplex method, include the transverse flow rapidityρof 0.88 and 0.85 in-plane and out-of-plane, respec-tively; the source radius (Rx,Ry) of (11.26, 11.42) fm; the emission time (i.e. the duration of the expansion)τof 7.4 fm, and the duration of emission ∆τ=1.55 fm/c. The nearly-circular sourceRx≈Rywas enforced by the smallness of the second Fourier component of the HBT radii (bottom part of Fig. 12).
VI. SUMMARY
In summary, the new high-statistics CERES hadron data allow for state of the art analysis of two-particle correlation data. The pion source anisotropy, accessible via the depen-dence of the two-pion HBT radii on the emission angle with respect to the reaction plane, is unexpectedly small compared to the analogous results obtained at lower and higher
ener-gies. The pion-proton correlations indicate that the proton source is located at a larger radius than the pion source, or that protons are emitted earlier than pions. The amount of the displacement, and its functional dependence on the trans-verse momentum of the two involved particles, corroborate the transverse expansion picture deduced from the behavior of theRsideHBT radius. Finally, the blast-wave
parametriza-tion is able to describe simultaneously the transverse spectra and the elliptic flow coefficients of several hadron species, and the two-particle correlations.
This work was supported by the German BMBF, the U.S. DoE, the Israeli Science Foundation, and the MINERVA foun-dation. The data analysis was performed by D. Anto´nczyk as a part of his Ph.D. thesis work. The author (DM) thanks the workshop organizers for the invitation and for the good and inspiring atmosphere of the meeting.
[1] G. Agakichiev et al. (CERES), Phys. Rev. Lett.75, 1272 (1995)
and Eur. Phys. J. C41, 475 (2005).
[2] D. Miskowiec, Nucl.Phys. A 774, 43 (2006); A. Marin,
J. Phys. G30, S709 (2004); Nucl. Instr. Meth., in preparation.
[3] D. Adamova et al., Nucl. Phys. A714, 124 (2003).
[4] D. Adamova et al., Phys. Rev. Lett.90, 022301 (2003).
[5] M. A. Lisa, S. Pratt, R. Soltz, and U.Wiedemann, Ann. Rev.
Nucl. Part. Sci.55, 357 (2005).
[6] S. Chapman, J. R. Nix, and U. Heinz, Phys. Rev. C52, 2694
(1995); T. Cs¨org˝o and B.L¨orstad, Phys. Rev. C54, 1390 (1996);
R. Scheibl and U. Heinz, Phys. Rev. C59, 1585 (1999).
[7] A. N. Makhlin and Yu. M. Sinyukov, Z. Phys. C39, 69 (1988);
S. V. Akkelin and Yu. M. Sinyukov, Phys. Lett. B 356, 525
pt (GeV)
0 0.2 0.4 0.6 0.8
2 out
R
0 10 20 30 40 50
pt (GeV)
0 0.2 0.4 0.6 0.8
2 side
R
0 10 20 30 40 50
pt (GeV)
0 0.2 0.4 0.6 0.8
2 long
R
0 10 20 30 40 50 60 70 80
pair pt (GeV)
0 1 2
(fm)
〉
pion out
R
〈
-〉
prot out
R
〈
-5 0 5 10 15
pt (GeV)
0 0.2 0.4 0.6 0.8
2 outside
R
-8 -6 -4 -2 0 2 4 6 8
pt (GeV)
0 0.2 0.4 0.6 0.8
2 outlong
R
-15 -10 -5 0 5 10 15
pt (GeV)
0 0.2 0.4 0.6 0.8
2 sidelong
R
-8 -6 -4 -2 0 2 4 6 8
pt (GeV)
0 0.2 0.4 0.6 0.8
2 out,2
R
-8 -6 -4 -2 0 2 4 6 8
pt (GeV)
0 0.2 0.4 0.6 0.8
2 side,2
R
-8 -6 -4 -2 0 2 4 6 8
pt (GeV)
0 0.2 0.4 0.6 0.8
2 long,2
R
-8 -6 -4 -2 0 2 4 6 8
pt (GeV)
0 0.2 0.4 0.6 0.8
2 outside,2
R
-8 -6 -4 -2 0 2 4 6 8
p r e l i m i n a r y
FIG. 12: (Color online) CERES HBT radii squared and the pion-proton displacement (top), HBT cross-terms (middle), and the second Fourier components of the HBT radii vs. emission angle with respect to the reaction plane (bottom), compared to the blast-wave model calculations (red line). The data are preliminary and come from central Pb+Au collisions at 158 GeV per nucleon.The black and blue points represent the negative and positive pions, respectively.
(1995); U. A. Wiedemann, P. Scotto, and U. Heinz, Phys. Rev.
C53, 918 (1996).
[8] M. A. Lisa et al., Phys. Lett. B496, 1 (2000).
[9] J. Adams et al., Phys. Rev. C72, 014904 (2005).
[10] R. Lednicky, V. L. Lyuboshitz, B. Erazmus, and D. Nouais,
Phys. Lett. B373, 30 (1996).
[11] S. A. Bass et al., Prog. Part. Nucl. Phys.41, 225 (1998); M.
Bleicher et al., J. Phys. G: Nucl. Part. Phys.25, 1859 (1999).
[12] S. V. Akkelin and Yu. M. Sinyukov, Z. Phys. C72, 501 (1996);
R. Lednicky, Phys. Atom. Nucl.67, 72 (2004).