702 Brazilian Journal of Physics, vol. 37, no. 2C, June, 2007
Evidence for Non-Gaussian Tail in 3-Dimensional Pion Emission Source at SPS
P. Chung1and P. Danielewicz2 for The NA49 Collaboration 1 Dept of Chemistry, SUNY Stony Brook, Stony Brook, NY 11794, USA
2National Superconducting Cyclotron Laboratory and Department of Physics and Astronomy,
Michigan State University, East Lansing, MI 48824-1321, USA
Received on 2 November, 2006; Revised version on 29 March, 2007; Third version on 12 April, 2007
The NA49 experiment at CERN SPS has acquired a huge data set of Pb+Pb events over a broad range of energy and centrality during the last several years. This high statistics data set, coupled with a state-of-the-art analysis technique, allows for the first model-independent extraction and energy scan of 3D emission sources for pion pairs at SPS energies. These 3D pion emission sources provide new insights into the nature of a long-range source previously reported by PHENIX at RHIC. Preliminary results indicate that the pion source function is essentially Gaussian from 20 AGeV to 80 AGeV but it displays significant non-Gaussian tails at 158 AGeV.
Keywords: Correlation; Interferometry; Intensity interferometry; Cartesian harmonics; Anisotropic correlation
I. INTRODUCTION
A deconfined phase of nuclear matter is expected to be formed at the high energy densities created in relativistic heavy ion collisions [1]. It is widely believed that important signatures of such a phase are reflected in the space-time ex-tent and shape of particle emission source functions.
Recently, 1-Dimensional source imaging techniques [2,3] have revealed a non-trivial long range structure in the two-pion emission source at RHIC [4,5]. The origins of this ture are still unclear. The presence/absence of such a struc-ture in the pion emission sources in heavy ion collisions at intermediate SPS energies could yield important information which could help resolve the structure’s origins. The NA49 Collaboration has carried out Pb+Pb collisions over a wide range of bombarding energies at the CERN SPS during the last decade [6]. Such a rich data set provides a unique oppor-tunity to search for this long range structure at the SPS and study its evolution with beam energy with a view to unravel-ing its nature.
In this paper, preliminary 3D emission source images for pions produced in central Pb+Pb collisions over the incident energy range 20 to 158 AGeV are presented. The results are discussed in the context of a Gaussian shape assumption.
II. EXPERIMENTAL SETUP AND DATA ANALYSIS
The data presented here were taken by the NA49 Collab-oration during the years 1996-2002. The incident beams of 20, 80, 158 AGeV were provided by the CERN SPS accel-erator. The NA49 Large Acceptance Hadron Detector [7] achieves large acceptance precision tracking (δp/p2≈(0.3− 7).10−4(GeV/c)−1[7]) and particle identification using time
projection chambers. Charged particles are detected by the tracks left in the TPC and identified by the energy deposited in the TPC gas. Mid-rapidity particle identification is further enhanced by a time-of-flight wall (resolution 60 ps). Event centrality is determined by a forward calorimeter which mea-sures the energy of spectator matter.
3D correlation functions, C(q), were obtained as the ratio of
pair to uncorrelated reference distributions in relative momen-tumqforπ−π−pairs. Here,q=(p1−p2)
2 is half of the relative
momentum between the two particles in the Pair Center-of-Mass System (PCMS) frame. The pair distribution was ob-tained using pairs of particles from the same event and the un-correlated distribution was obtained by pairing particles from different events.
Track merging and splitting effects were removed by ap-propriate cuts on both the pair and uncorrelated distributions. The pair cuts require the two particles in each pair to be sep-arated by at least 2.2 cm over 50 pad rows in the main vertex TPC. A 20% increase in this minimum separation results in the correlation data points fluctuating within the statistical er-rors. Hence, the systematic uncertainty associated with the pair cuts is deemed smaller than the statistical uncertainty.
The effects of track momentum resolution were assessed by jittering the momentum of the tracks in the data by the maxi-mum resolution,δp/p2≈7.10−4(GeV/c)−1[7]. The
result-ing re-computed 3D correlation function incorporates twice the effect of the momentum resolution and was found to be identical to the raw un-smeared correlation function for in-cident beam energies up to 80 AGeV. This is not surprising, considering that the mean momentum of the low pT tracks
used is 1.2 GeV/c, resulting in a momentum resolution of
δp/p≈(1.2 x 7.10−4) =0.1%. Such a small momentum res-olution has no observable effect on the correlation function.
At 158 AGeV, the above smearing procedure results in the correlation peak in the region q<10 MeV to be slightly smeared. This tends to reduce the imaged source intensity at large radii. Hence, the preliminary results presented here would be a lower limit of the actual source function.
In the cartesian harmonic decomposition technique [8, 9], the 3D correlation function is expressed as
f C(q)−1=R(q) =
∑
l α1∑
...αlRlα1...αl(q)A
l
α1...αl(Ωq) (1)
wherel=0,1,2, . . .,αi=x,yorz,Alα1...αl(Ωq)are cartesian harmonic basis elements (Ωq is solid angle inq space) and Rlα1...αl(q)are cartesian correlation moments given by
Rlα1...αl(q) =(2l+1)!!
l!
dΩ q 4π A
l
P. Chung et al. 703
The coordinate axes are oriented so that zis parallel to the beam (long) direction, xpoints in the direction of the total momentum of the pair in the LCMS frame (out) andyis per-pendicular to the other two axes (side).
The correlation moments, for each orderl, are calculated from the measured 3D correlation function using Eq. (2). Each independent correlation moment is then imaged using the 1D Source Imaging code of Brown and Danielewicz [2, 3] to obtain the corresponding source moment for each orderl. Thereafter, the total source function is calculated by combin-ing the source moments for eachlas in Eq. (3)
S(r) =
∑
l α1∑
...αlSlα1...αl(r)Alα1...αl(Ωr) (3)
III. RESULTS
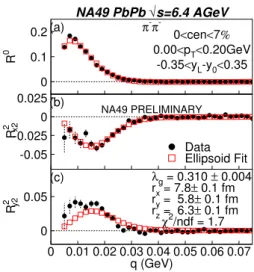
Figure 1 shows thel=0 (R0) andl=2 (R2xxandR2yy)
mo-ments for mid-rapidity (|yL−y0|<0.35, whereyL is
parti-cle laboratory rapidity andy0is CM rapidity), lowpT (0.0<
pT <0.2 GeV/c)π−π− pairs from 20 AGeV central (7%)
Pb+Pb collisions as a function of the relative momentum q in the PCMS frame. Higher order moments are either zero or negligible. The Lorentz transformation ofqfrom the labora-tory frame to the PCMS is done by a Lorentz transformation to the pair Locally Co-Moving System frame (LCMS) along the beam direction followed by a transformation to the PCMS along the direction of transverse momentum of the pair.
NA49 PbPb √s=6.4 AGeV
q (GeV)
R
0
R
2 x2
R
2 y2
π-π
-0<cen<7%
0.00<pT<0.20GeV -0.35<yL-y0<0.35 (a)
(b)
(c)
NA49 PRELIMINARY
Data Ellipsoid Fit
λg = 0.310 ± 0.004 rx = 7.8± 0.1 fm ry = 5.8± 0.1 fm
rz = 6.3± 0.1 fm
χ2
/ndf = 1.7 0
0.1 0.2
-0.05 -0.025 0 0.025
0 0.05
0 0.01 0.02 0.03 0.04 0.05 0.06 0.07
FIG. 1: (a)l=0 andl=2 ((b) and (c)) moments for mid-rapidity low pT π−π− pairs from 20 AGeV central Pb+Pb collisions as a function q. Data are shown as solid circles while the squares repre-sent the result of a simultaneous fit of the moments with an ellipsoid shape.
The data points are shown in solid circles and the open squares represent the result of a simultaneous fit to the inde-pendent moments with a ellipsoid shape (3D Gaussian). The fit parameters are shown in the bottom panel. The extracted
NA49 PbPb √s=±17.3 AGeV
q (GeV)
R
0
R
2 x2
R
2 y2
π-π
-0<cen<7% 0.00<pT<0.20GeV
-0.35<yL-y0<0.35
(a)
(b)
(c)
NA49 PRELIMINARY
Data Ellipsoid Fit
λg = 0.255 ± 0.002 rx = 6.62± 0.02 fm ry = 5.06± 0.02 fm
rz = 6.71± 0.03 fm
χ2
/ndf = 14 0
0.1 0.2
-0.05 -0.025 0 0.025
0 0.05
0 0.01 0.02 0.03 0.04 0.05 0.06 0.07
FIG. 2: Same as Fig.1 but for 158 AGeV Pb+Pb collisions.
data moments are fairly well represented by the Gaussian shape.
Figure 2 shows the corresponding moments forπ−π−pairs from 158 AGeV Pb+Pb collisions. In this case, the fit result shows that the data moments are not adequately described by the Gaussian assumption: R0andR2y2exhibit significant dis-crepancies between the data and the fit moments.
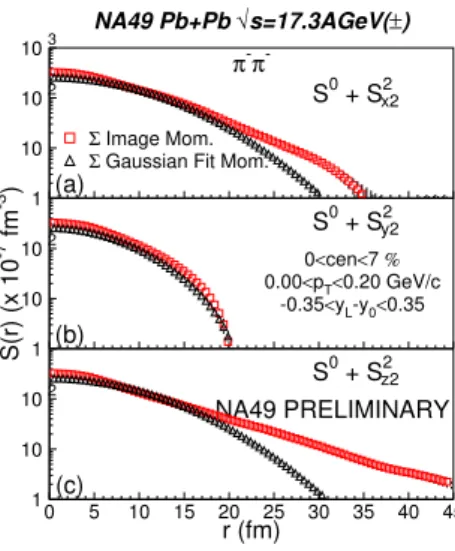
For the lowpTpairs considered, the only significant source
moments are found for multipolaritiesl=0 and 2. Hence, the total source functions in thex,yandzdirections are sim-ply the sum of the 1D sourceS0and the correspondingl=2 momentS2ii where i =x,yorz. Fig. 3(a)-(c) shows the total
NA49 Pb+Pb √s=6.4AGeV
r (fm)
S(r) (x 10
-7 fm -3 )
π-π
-S0 + S x22
S0 + S y22
S0 + S z22
(a)
(b)
(c)
NA49 PRELIMINARY
Σ Image Mom. Σ Gaussian Fit Mom.
0<cen<7 % 0.00<pT<0.20 GeV/c
-0.35<yL-y0<0.35 1
10 102 103
1 10 102
1 10 102
0 5 10 15 20 25 30 35 40 45
FIG. 3: Total source function in (a)x(out) (b)y(side) (c)z(long) direction for low pT mid-rapidityπ−π− pairs from central Pb+Pb collisions at√s=6.4 AGeV (Incident beam energy = 20 AGeV). Squares represent source image while triangles represent Gaussian assumption fit function result.
source function for mid-rapidity, lowpT pion pairs from
704 Brazilian Journal of Physics, vol. 37, no. 2C, June, 2007
function. The source image and the Gaussian fit agree reason-ably well in all 3 directions.
NA49 Pb+Pb √s=12.4AGeV
r (fm)
S(r) (x 10
-7 fm -3 )
π-π
-S0 + S x22
S0 + S y22
S0 + S z22
(a)
(b)
(c)
NA49 PRELIMINARY
Σ Image Mom. Σ Gaussian Fit Mom.
0<cen<7 % 0.00<pT<0.20 GeV/c
-0.35<yL-y0<0.35 1
10 102 103
1 10 102
1 10 102
0 5 10 15 20 25 30 35 40 45
FIG. 4: Same as Fig.3 but for√s=12.4 AGeV (Beam energy = 80 AGeV).
NA49 Pb+Pb √s=17.3AGeV(±)
r (fm)
S(r) (x 10
-7 fm -3 )
π-π
-S0 + S x22
S0 + S y22
S0 + S z22
(a)
(b)
(c)
NA49 PRELIMINARY
Σ Image Mom. Σ Gaussian Fit Mom.
0<cen<7 % 0.00<pT<0.20 GeV/c
-0.35<yL-y0<0.35 1
10 102 103
1 10 102
1 10 102
0 5 10 15 20 25 30 35 40 45
FIG. 5: Same as Fig.3 but for√s=17.3 AGeV (Beam energy = 158 AGeV). Result is average over runs with +ve and -ve magnetic field.
The same conclusion is reached from Fig. 4(a)-(c) for low pT pion pairs from central Pb+Pb collisions at 80 AGeV
(√s=12.4 AGeV) respectively.
However, at 158 AGeV incident energy (√s=17.3 AGeV), Fig. 5(a),(c) show that there are significant deviations of the source image from the Gaussian fit in thexandzdirections re-spectively: the source image seems to exhibit a non-Gaussian tail which extends beyond the range of the Gaussian fit for r>17 fm in the out and long directions.
IV. DISCUSSION
The evolution of the pion source image with increasing beam energy indicates that the source function is essentally Gaussian from 20 AGeV to 80 AGeV but it displays very prominent non-Gaussian tails at 158 AGeV in the out and long directions. Hence, the long range structure, first ob-served at RHIC (√s=200 AGeV) [5], is already mani-fest at much lower energies at the SPS. This points to the expectation that there are new physics processes which set in between 80 AGeV (√s=12.4 AGeV) and 158 AGeV (√s=17.3 AGeV) which result in the non-Gaussian tails in this energy regime.
Could the non-Gaussian tails observed at 158 AGeV be due to resonance decays such as theωmeson ? Although a quanti-tative issue, the resonance population does not change signifi-cantly from√s=12.4 AGeV to√s=17.3 AGeV. Hence, it is unlikely that resonance decays could account for the observed non-Gaussian tail at 158 AGeV.
V. CONCLUSIONS
The NA49 Collaboration has performed the first extrac-tion of emission source funcextrac-tions for mid-rapidity, low pT
pions produced in central Pb+Pb collisions over the beam en-ergy range 20-158 AGeV at SPS. Preliminary results indicate that the source functions are essentially Gaussian from 20 to 80 AGeV. However, at 158 AGeV the pion source function displays non-Gaussian tails in the out and long directions. It is unlikely that these non-Gaussian tails originate from sec-ondary pions produced in resonance decays.
[1] Quark Matter 2005 Proceedings of the 18th International Con-ference on Ultra-Relativistic Nucleus-Nucleus Collisions, Bu-dapest, Hungary, Aug. 4-9, 2005, Nucl. Phys. A774(2006). [2] D.A. Brown and P. Danielewicz, Phys. Lett. B398, 252 (1997). [3] D.A. Brown and P. Danielewicz, Phys. Rev. C57, 2474 (1998). [4] P. Chunget al., Nucl. Phys. A749, 275c (2005).
[5] S.S. Adleret al.(PHENIX Collaboration), Phys. Rev. Lett.,98, 132301 (2007).
[6] C. Alt et al. (NA49 Collaboration), CERN-SPSC-2005-041,
CERN-SPSC-P-264-ADD-12, Nov 2005.
[7] S. Afanasievet al., Nucl. Instrum. Meth. A430, 210 (1999). [8] P. Danielewicz and S. Pratt, Phys. Lett. B618, 60 (2005). [9] P. Chunget al., XXXV International Symposium on