Recent Femtoscopy Results from NA49: Evidence for a Non-Gaussian Tail in the 3-Dimensional
Two-Pion Emission Source at SPS
P. Chung1 and P. Danielewicz2 for The NA49 Collaboration 1 Dept of Chemistry, SUNY Stony Brook, Stony Brook, NY 11794, USA
2National Superconducting Cyclotron Laboratory and Department of Physics and Astronomy, Michigan State University, East Lansing, MI 48824-1321, USA
The NA49 experiment at CERN SPS has acquired a huge data set of Pb+Pb events over a broad range of energy and centrality during the last several years. This high statistics data set, coupled with a state-of-the-art analysis technique, allows for the first model-independent extraction and energy scan of 3D emission sources for pion pairs at SPS energies. These 3D two-pion emission sources provide new insights into the nature of a long-range source previously reported by PHENIX at RHIC. The new results indicate that the two-pion source function is essentially Gaussian from 20 AGeV to 80 AGeV but it displays significant non-Gaussian tails at 158 AGeV.
Keywords: Correlation; Interferometry; Intensity interferometry; Cartesian harmonics; Correlation anisotropy
I. INTRODUCTION
A deconfined phase of nuclear matter is expected to be formed at the high energy densities created in relativistic heavy ion collisions [1]. It is widely believed that important signatures of such a phase are reflected in the space-time ex-tent and shape of particle emission source functions.
Recently, 1-Dimensional source imaging techniques [2–4] have revealed a non-trivial long range structure in the two-pion emission source at RHIC [5, 6]. The origins of this ture are still unclear. The presence/absence of such a struc-ture in the pion emission sources in heavy ion collisions at intermediate SPS energies could yield important information which could help resolve the structure’s origins. The NA49 Collaboration has carried out Pb+Pb collisions over a wide range of bombarding energies at the CERN SPS during the last decade [7]. Such a rich data set provides a unique oppor-tunity to search for this long range structure at the SPS and study its evolution with beam energy, and hopefully, unravel its nature.
In this paper, the 3-Dimensional emission source images for pions produced in central Pb+Pb collisions over the incident energy range 20 to 158 AGeV are presented. The results are discussed in the context of a Gaussian shape assumption.
II. EXPERIMENTAL SETUP
The data presented here were taken by the NA49 Collab-oration during the years 1996-2002. The incident beams of 20, 40, 80, 158 AGeV were provided by the CERN SPS accelerator. The NA49 Large Acceptance Hadron Detector [8] achieves large acceptance precision tracking (δp/p2≈
(0.3−7).10−4 (GeV/c)−1) and particle identification using
time projection chambers (TPC’s). Charged particles are de-tected by the tracks left in the TPC’s and identified by the energy deposited in the TPC gas. Mid-rapidity particle identi-fication is further enhanced by a time-of-flight wall (resolution 60 ps). Event centrality is determined by a forward calorime-ter which measures the energy of spectator matcalorime-ter.
III. DATA ANALYSIS
3D correlation functions, C(q), were obtained as the ratio of pair to uncorrelated reference distributions in relative momen-tumqforπ−π−pairs. Here,q=(p1−p2)
2 is half of the relative
momentum between the two particles in the Pair Center-of-Mass System (PCMS) frame. The pair distribution was ob-tained using pairs of particles from the same event and the un-correlated distribution was obtained by pairing particles from different events. The Lorentz transformation ofq from the laboratory frame to the PCMS is done by a Lorentz transfor-mation to the pair Locally Co-Moving System (LCMS) frame along the beam direction followed by a Lorentz transforma-tion to the PCMS along the directransforma-tion of the transverse mo-mentum of the pair.
Track merging and splitting effects were removed by ap-propriate cuts on both the pair and uncorrelated distributions. The pair cuts require the two particles in each pair to be sep-arated by at least 2.2 cm over 50 pad rows in the main vertex TPC. A 20% increase in this minimum separation results in the correlation data points fluctuating within the statistical er-rors. Hence, the systematic uncertainty associated with the pair cuts is deemed smaller than the statistical uncertainty.
The effects of track momentum resolution were assessed by jittering the momentum of the tracks in the data by the maxi-mum momentum resolution,δp/p2≈7.10−4(GeV/c)−1, and
re-computing the 3D correlation function. The resulting cor-relation function incorporates twice the effect of the momen-tum resolution and was found to be identical to the raw un-smeared correlation function. This is not surprising, con-sidering that the mean momentum of the tracks used in this analysis is 1.2 GeV/c, resulting in a momentum resolution of
δp/p≈0.1%. Such a small momentum resolution has no ob-servable effect on the correlation function.
fields were combined in order to enhance statistics.
A. Moment Calculation
In the cartesian harmonic decomposition technique [9, 10], the 3D correlation function is expressed as
C(q)−1=R(q) =
∑
l
∑
α1...αl
Rlα
1...αl(q)A
l
α1...αl(Ωq) (1)
wherel=0,1,2, . . .,αi=x,yorz,Alα
1...αl(Ωq)are cartesian
harmonic basis elements (Ωq is solid angle in q space) and Rlα
1...αl(q)are cartesian correlation moments given by
Rlα1...αl(q) =
(2l+1)!! l!
dΩ q
4π A
l
α1...αl(Ωq)R(q) (2)
The coordinate axes are oriented so that z is parallel to the beam (long) direction, x points in the outward (out) direction of the total momentum of the pair in the LCMS frame and y is perpendicular to the other two axes (side direction).
The correlation moments, for each order l, can be calcu-lated from the measured 3D correlation function using equa-tion (2). Alternatively, equaequa-tion (1) can be truncated so as to include all non-vanishing moments and expressed in terms of independent moments only. Up to orderl=4, there are 6 in-dependent moments: R0,R2x2,R2y2,R4x4,R4y4andR4x2y2where R2x2 is shorthand forR2xx etc. The independent moments can then be extracted as a function ofqby fitting the truncated se-ries to the experimental 3D correlation function with the ments as the parameters of the fit. In this analysis, the mo-ments are computed up to order l=4: higher order momo-ments are either zero or negligible.
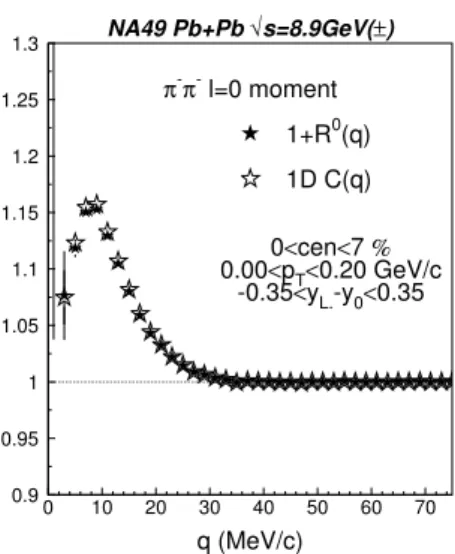
Fig. 1 shows a comparison between the 1D correlation func-tion,C(q), and thel=0 momentR0(q)+1 for mid-rapidity (|yL−y0|<0.35, whereyLis the particle laboratory rapidity
andy0is the CM rapidity), low pT (0.0<pT <0.2 GeV/c)
π−π−pairs from 20 AGeV central (7%) Pb+Pb collisions as a function of the relative momentumq in the PCMS frame. The 1D correlation function is in good agreement with the l=0 momentR0(q)+1 , as expected in the absence of any
sig-nificant angular acceptance issues, and attests to the reliabil-ity of the moment calculation technique used in this analysis. Similarly good agreement is found for 40, 80 and 158 AGeV Pb+Pb collisions as shown in Figs. 2, 3 and 4 respectively.
B. Moment Fitting
In order to extract the source function from the 3D correla-tion funccorrela-tion, it is possible to fit the latter directly with an as-sumed shape for the source function. Since the 3D correlation function is represented by the cartesian moments in the carte-sian harmonic decomposition, this amounts to fitting the six independent moments with a trial source function. The sim-plest source function is the 3D Gaussian, frequently termed ellipsoid, shape.
NA49 Pb+Pb √s=6.4GeV
q (MeV/c)
π-π
l=0 moment
1+R0(q)
1D C(q)
0<cen<7%
0.00<pT<0.20 GeV/c
-0.35<yL-y0<0.35
0.9 0.95 1 1.05 1.1 1.15 1.2 1.25 1.3
0 10 20 30 40 50 60 70
FIG. 1: 1D correlation function C(q) (open stars) andl=0 moment R0(q) +1 (solid stars) for lowpTmid-rapidityπ−π−pairs from
cen-tral Pb+Pb collisions at√s=6.4 AGeV (incident beam energy of 20 AGeV).
NA49 Pb+Pb √s=8.9GeV(±)
q (MeV/c)
π-π
l=0 moment
1+R0(q)
1D C(q)
0<cen<7%
0.00<pT<0.20 GeV/c
-0.35<yL.-y0<0.35
0.9 0.95 1 1.05 1.1 1.15 1.2 1.25 1.3
0 10 20 30 40 50 60 70
FIG. 2: Same as Fig. 1 but for√s=8.9 AGeV (incident beam energy of 40 AGeV). The result is averaged over runs with +ve and -ve magnetic field.
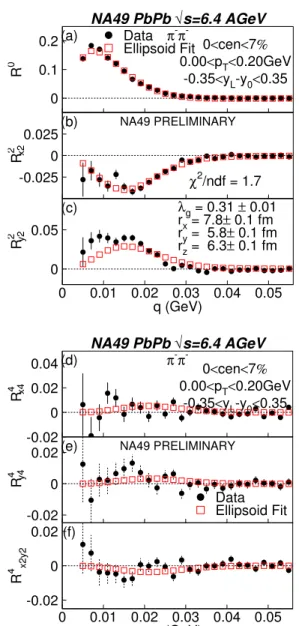
Fig. 5 shows the six independent moments for mid-rapidity (|yL−y0|<0.35, lowpT (0.0<pT <0.2 GeV/c)π−π−pairs
from 20 AGeV central (7%) Pb+Pb collisions as a function of the relative momentumqin the PCMS frame. The data points are shown in solid circles and the open squares represent the result of a simultaneous fit to the independent moments with an ellipsoid shape. The fit parameters are shown in panel (c). The data moments are fairly well represented by the Gaussian shape except for some deviation inR2y2.
NA49 Pb+Pb √s=12.4GeV
q (MeV/c)
π-π
l=0 moment
1+R0(q)
1D C(q)
0<cen<7%
0.0<pT<0.20 GeV/c
-0.35<yL-y0<0.35
0.9 0.95 1 1.05 1.1 1.15 1.2 1.25 1.3
0 10 20 30 40 50 60 70
FIG. 3: Same as Fig. 1 but for√s=12.4 AGeV (incident beam energy of 80 AGeV).
NA49 Pb+Pb √s=17.3GeV(±)
q (MeV/c)
π
-π
l=0 moment
1+R0(q)
1D C(q)
0<cen<7%
0.00<pT<0.20 GeV/c
-0.35<yL.-y0<0.35
0.9 0.95 1 1.05 1.1 1.15 1.2 1.25 1.3
0 10 20 30 40 50 60 70
FIG. 4: Same as Fig. 1 but for√s=17.3 AGeV (incident beam energy of 160 AGeV). Result is average over runs with +ve and -ve magnetic field.
pairs from 40 AGeV and 80 AGeV Pb+Pb collisions respec-tively. In both cases, the moments display the same pattern as for 20 AGeV and the ellipsoid fit describes most of the mo-ments except in theq<20MeV region inR2
y2.
Fig. 8 shows the corresponding moments for π−π−pairs from 158 AGeV Pb+Pb collisions. In this case, the fit result shows that the data moments are not adequately described by the Gaussian assumption: R0,R2y2andR4y4exhibit significant discrepancies between the data and the fit moments.
NA49 PbPb √s=6.4 AGeV
q (GeV)
R
0
R
2 x2
R
2 y2
π-π
-0<cen<7%
0.00<pT<0.20GeV -0.35<yL-y0<0.35 (a)
(b)
(c)
NA49 PRELIMINARY Data
Ellipsoid Fit
λg = 0.31 ± 0.01 rx = 7.8± 0.1 fm ry = 5.8± 0.1 fm rz = 6.3± 0.1 fm
χ2
/ndf = 1.7 0
0.1 0.2
-0.025 0 0.025
0 0.05
0 0.01 0.02 0.03 0.04 0.05
NA49 PbPb √s=6.4 AGeV
q (GeV)
R
4 x4
R
4 y4
R
4 x2y2
π -π
-0<cen<7% 0.00<pT<0.20GeV
-0.35<yL-y0<0.35 (d)
(e)
(f)
NA49 PRELIMINARY
Data Ellipsoid Fit -0.02
0 0.02 0.04
-0.02 0 0.02
-0.02 0 0.02
0 0.01 0.02 0.03 0.04 0.05
FIG. 5: (Color online) (a)l=0,l=2 ((b) and (c)) andl=4 ((d), (e) and (f)) moments for mid-rapidity lowpTπ−π−pairs from 20 AGeV
central Pb+Pb collisions as a function q. Data are shown as solid circles while the squares represent the result of a simultaneous fit of the moments with an ellipsoidal shape.
C. Moment Imaging
Fig. 8 shows that the two-pion source function at 158 AGeV exhibits appreciable non-Gaussian characteristics. The shape of the source can be accessed through the Source Imaging technique developed by Brown and Danielewicz [2–4].
The two-particle 1D correlation and source function are re-lated through the Koonin-Pratt [11] equation:
C(q)−1=4π
drr2K0(q,r)S(r). (3)
numer-NA49 PbPb √s=8.9 AGeV(±)
q (GeV)
R
0
R
2 x2
R
2 y2
π -π
-0<cen<7% 0.00<pT<0.20GeV
-0.35<yL-y0<0.35 (a)
(b)
(c)
NA49 PRELIMINARY Data
Ellipsoid Fit
λg = 0.28 ± 0.01 rx = 7.6± 0.1 fm ry = 5.7± 0.1 fm rz = 7.0± 0.1 fm
χ2
/ndf = 2.3 0
0.1 0.2
-0.025 0 0.025
0 0.05
0 0.01 0.02 0.03 0.04 0.05
NA49 PbPb √s=8.9 AGeV(±)
q (GeV)
R
4 x4
R
4 y4
R
4 x2y2
π -π
-0<cen<7% 0.00<pT<0.20GeV
-0.35<yL-y0<0.35 (d)
(e)
(f)
NA49 PRELIMINARY
Data Ellipsoid Fit -0.02
0 0.02 0.04
-0.02 0 0.02
-0.02 0 0.02
0 0.01 0.02 0.03 0.04 0.05
FIG. 6: (Color online) Same as Fig. 5 but for 40 AGeV Pb+Pb colli-sions.
ically to obtain the 1D source function S(r) using the tech-niques in Ref. [2–4]. Here, the imaged source functionS(r) gives the probability of emitting a pair of particles a distance rapart in the PCMS frame.
In order to access the 3D source function S(r), both the 3D correlation function C(q) and source function S(r) are ex-panded in a series of the cartesian harmonic basis with cor-relation moments Rlα
1...αl(q)and source moments S
l
α1...αl(q)
respectively. Substitution into the 3D Koonin-Pratt equation C(q)−1=
drK(q,r)S(r) (4) results [9] in a relationship, equation (5), between the cor-relation moments Rlα
1...αl(q)and source moments S
l
α1...αl(q)
which is similar to the 1D Koonin-Pratt equation:
NA49 PbPb √s=12.4 AGeV
q (GeV)
R
0
R
2 x2
R
2 y2
π-π
-0<cen<7%
0.00<pT<0.20GeV
-0.35<yL-y0<0.35
(a)
(b)
(c)
NA49 PRELIMINARY
Data Ellipsoid Fit
λg = 0.30 ± 0.01
rx = 7.2± 0.1 fm
ry = 5.8± 0.1 fm
rz = 7.4± 0.1 fm
χ2
/ndf = 2.1 0
0.1 0.2
-0.025 0 0.025
0 0.05
0 0.01 0.02 0.03 0.04 0.05
NA49 PbPb √s=12.4 AGeV
q (GeV)
R
4 x4
R
4 y4
R
4 x2y2
π-π
-0<cen<7%
0.00<pT<0.20GeV
-0.35<yL-y0<0.35
(d)
(e)
(f)
NA49 PRELIMINARY
Data Ellipsoid Fit -0.02
0 0.02 0.04
-0.02 0 0.02
-0.02 0 0.02
0 0.01 0.02 0.03 0.04 0.05
FIG. 7: (Color online) Same as Fig. 5 but for 80 AGeV Pb+Pb colli-sions.
Rlα
1...αl(q) =4π
drr2Kl(q,r)Sαl1...αl(q), (5)
but now pertains to moments describing different ranks of the angular anisotropyl. Since the mathematical structure of Eq.5 is the same as that of 3, the same 1D Imaging technique can be used to invert each correlation momentRlα
1...αl(q)to extract
the corresponding source momentSlα1...αl(q). Thereafter, the
total 3D source function is calculated by combining the source moments for eachlas in equation (6)
S(r) =
∑
l
∑
α1...αlSlα
1...αl(r)A l
NA49 PbPb √s=17.3 AGeV(±)
q (GeV)
R
0
R
2 x2
R
2 y2
π -π
-0<cen<7% 0.00<pT<0.20GeV
-0.35<yL-y0<0.35 (a)
(b)
(c)
NA49 PRELIMINARY Data
Ellipsoid Fit
λg = 0.255 ± 0.002 rx = 6.62± 0.02 fm ry = 5.06± 0.02 fm rz = 6.71± 0.03 fm
χ2
/ndf = 14 0
0.1 0.2
-0.025 0 0.025
0 0.05
0 0.01 0.02 0.03 0.04 0.05
NA49 PbPb √s=17.3 AGeV(±)
q (GeV)
R
4 x4
R
4 y4
R
4 x2y2
π -π
-0<cen<7% 0.00<pT<0.20GeV
-0.35<yL-y0<0.35 (d)
(e)
(f)
NA49 PRELIMINARY
Data Ellipsoid Fit -0.02
0 0.02 0.04
-0.02 0 0.02
-0.02 0 0.02
0 0.01 0.02 0.03 0.04 0.05
FIG. 8: (Color online) Same as Fig. 5 but for 158 AGeV Pb+Pb collisions.
Bottom panel of Fig. 9 shows the imaged l=0 moment S0 for the input l=0 moment C0(q) =R0(q) +1 for mid-rapidity low pT π−π− pairs from 20 AGeV central Pb+Pb
collisions. The source image looks essentially Gaussian-like. Inserting the extracted image into the 1D Koonin-Pratt equa-tion (3) yields the restored moment shown in open squares in the top panel. The good agreement between the input and re-stored correlation moments serves as a consistency check of the imaging procedure.
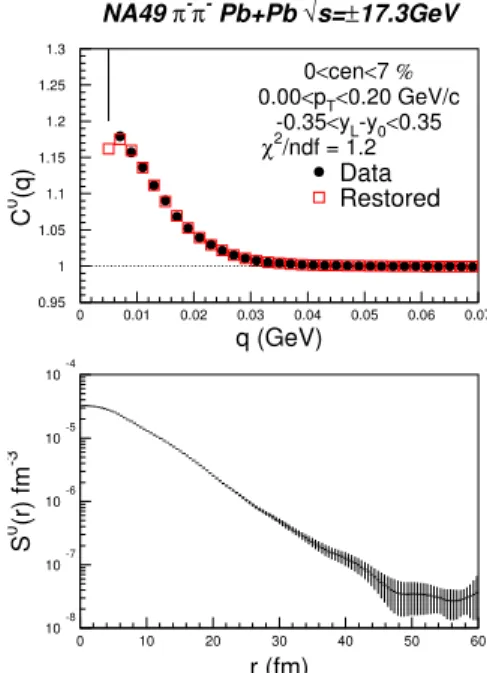
Fig. 10 shows the corresponding extraction of the l =0 source moment for pions from 158 AGeV central Pb+Pb col-lisions. In contrast to the 20 AGeV case, theS0moment at 158 AGeV displays an exponential-like tail which extends be-yond the Gaussian-like tail at 20 AGeV. The difference inS0
NA49π
-π
Pb+Pb √s=6.4GeV
r (fm) q (GeV)
S
0 (r) fm
-3
C
0 (q)
Data Restored 0<cen<7% 0.00<pT<0.20 GeV/c
-0.35<yL-y0<0.35 χ2
/ndf = 2.7
0.95 1 1.05 1.1 1.15 1.2 1.25 1.3
0 0.01 0.02 0.03 0.04 0.05 0.06 0.07
10
-8
10-7 10-6 10-5 10-4
0 10 20 30 40 50 60
FIG. 9: (Color online) l=0 momentC0(q) =R0(q) +1 (solid circles) and imaged source moment S0(r)for mid-rapidity low pT π−π−
pairs from 20 AGeV central Pb+Pb collisions. Open squares in the top panel represent the correlation moment restored from the imaged source momentS0(r).
NA49π-π- Pb+Pb √s=±17.3GeV
r (fm) q (GeV)
S
0 (r) fm
-3
C
0 (q)
Data Restored 0<cen<7% 0.00<pT<0.20 GeV/c
-0.35<yL-y0<0.35 χ2/ndf = 1.2
0.95 1 1.05 1.1 1.15 1.2 1.25 1.3
0 0.01 0.02 0.03 0.04 0.05 0.06 0.07
10-8 10-7 10-6 10-5 10-4
0 10 20 30 40 50 60
FIG. 10: (Color online) Same as Fig. 9 but for 158 AGeV central Pb+Pb collisions.
NA49π
-π
Pb+Pb √s=6.4GeV
r (fm) q (GeV)
S
2 (r) fmxx
-3
C
2 (q)xx
Data Restored 0<cen<7% 0.00<pT<0.20 GeV/c
-0.35<yL-y0<0.35
χ2
/ndf = 1.1
-0.1 -0.08 -0.06 -0.04 -0.02 0 0.02 0.04 0.06 0.08 0.1
0 0.01 0.02 0.03 0.04 0.05 0.06 0.07
-0.5 -0.4 -0.3 -0.2 -0.1 0 0.1 0.2 0.3 0.4 0.5 x 10⁻⁵
0 10 20 30 40 50 60
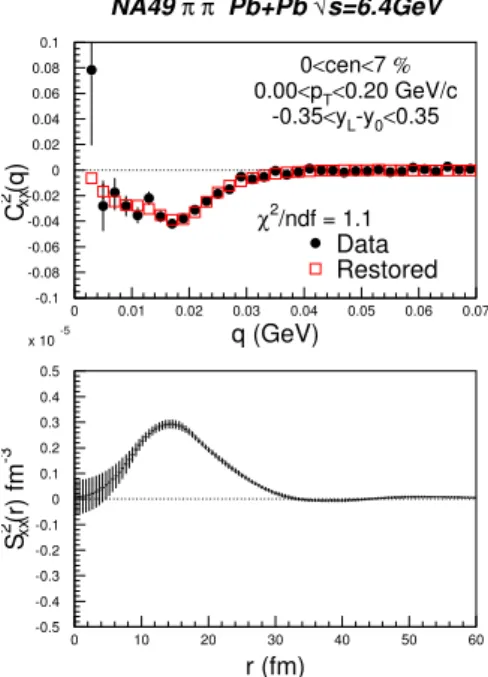
FIG. 11: (Color online) l=2 momentCxx2(q) =R2xx(q)(solid circles)
and the imaged source momentS2xx(r)for mid-rapidity lowpTπ−π−
pairs from 20 AGeV central Pb+Pb collisions. Open squares in the top panel represent the correlation moment restored from the imaged source momentSxx2(r).
NA49π
-π
Pb+Pb √s=±17.3GeV
r (fm) q (GeV)
S
2 (r) fmxx
-3
C
2 (q)xx
Data Restored 0<cen<7% 0.00<pT<0.20 GeV/c
-0.35<yL-y0<0.35
χ2/ndf = 2.6
-0.1 -0.08 -0.06 -0.04 -0.02 0 0.02 0.04 0.06 0.08 0.1
0 0.01 0.02 0.03 0.04 0.05 0.06 0.07
-0.5 -0.4 -0.3 -0.2 -0.1 0 0.1 0.2 0.3 0.4 0.5 x 10⁻⁵
0 10 20 30 40 50 60
FIG. 12: (Color online) Same as Fig. 11 but for 158 AGeV central Pb+Pb collisions.
function. Consequently, the source function is broader inx compared to the angle-averaged source function, hence the positive contribution ofSxx2 toS0.
The opposite effect takes place in theydirection as shown by Figs. 13 and 14. The positive contribution to thel=2 correlation momentR2yy results from a negative contribution
of the l=2 source momentS2yy. The positive contribution of R2yy causes the overall correlation function to be broader in theydirection compared to the angle-average correlation function. Consequently, the source function is narrower in ycompared to the angle-average source function, hence the negative contribution ofS2yytoS0.
NA49π-π- Pb+Pb √s=6.4GeV
r (fm) q (GeV)
S
2 (r) fmyy
-3
C
2 (q)yy
Data Restored 0<cen<7% 0.00<pT<0.20 GeV/c
-0.35<yL-y0<0.35
χ2
/ndf = 1.1
-0.1 -0.075 -0.05 -0.025 0 0.025 0.05 0.075 0.1 0.125 0.15
0 0.01 0.02 0.03 0.04 0.05 0.06 0.07
-0.5 -0.4 -0.3 -0.2 -0.1 0 0.1 0.2 0.3 0.4 0.5 x 10⁻⁵
0 10 20 30 40 50 60
FIG. 13: (Color online) l=2 momentCyy2(q) =R2yy(q)(solid circles) and the imaged source momentS2yy(r)for mid-rapidity lowpTπ−π−
pairs from 20 AGeV central Pb+Pb collisions. Open squares in the top panel represent the correlation moment restored from the imaged source momentS2yy(r).
IV. RESULTS
For the lowpT pairs considered, the only significant source
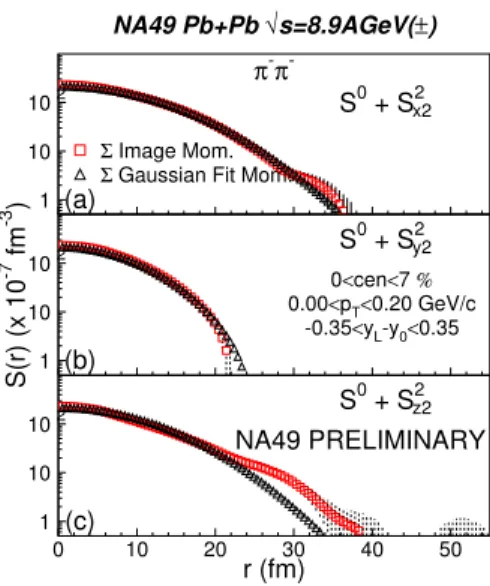
moments are found for multipolaritiesl=0 and 2. Hence, the net source functions in the x,y and z directions are simply given by the sum of the 1D sourceS0 and the corresponding l=2 momentsS2iiwhere i= x, y or z. Fig. 15 shows the total source function for mid-rapidity, lowpT pion pairs from
cen-tral Pb+Pb collisions at 20 AGeV (i.e√s=6.4 AGeV). The source image is shown by squares while the triangles repre-sent the ellipsoid (3D Gaussian) shape fit to the 3D correlation function. The source image and the Gaussian fit display good agreement in the x and y directions while the source image in the z direction exhibits a non-Gaussian tail forr>20 fm.
The same conclusion is reached from Figs. 16 and 17 for lowpT pion pairs from central Pb+Pb collisions at 40 AGeV
NA49π
-π
Pb+Pb √s=±17.3GeV
r (fm) q (GeV)
S
2 (r) fmyy
-3
C
2 (q)yy
Data Restored 0<cen<7% 0.00<pT<0.20 GeV/c
-0.35<yL-y0<0.35 χ2/ndf = 2.3
-0.1 -0.075 -0.05 -0.025 0 0.025 0.05 0.075 0.1 0.125 0.15
0 0.01 0.02 0.03 0.04 0.05 0.06 0.07
-0.5 -0.4 -0.3 -0.2 -0.1 0 0.1 0.2 0.3 0.4 0.5 x 10⁻⁵
0 10 20 30 40 50 60
FIG. 14: (Color online) Same as Fig. 13 but for 158 AGeV central Pb+Pb collisions.
NA49 Pb+Pb √s=6.4AGeV
r (fm)
S(r) (x 10
-7 fm
-3 )
π-π
-S0 + S x22
S0 + S y22
S0 + S z22
(a)
(b)
(c)
NA49 PRELIMINARY Σ Image Mom.
Σ Gaussian Fit Mom.
0<cen<7%
0.00<pT<0.20 GeV/c -0.35<yL-y0<0.35 1
10 102
1 10 102
1 10 102
0 10 20 30 40 50
FIG. 15: (Color online) Total source function in (a) x (out) (b) y (side) (c) z (long) direction for lowpTmid-rapidityπ−π−pairs from
central Pb+Pb collisions at√s=6.4 AGeV (incident beam energy of 20 AGeV). Squares represent the source image while triangles represent the Gaussian assumption fit function result.
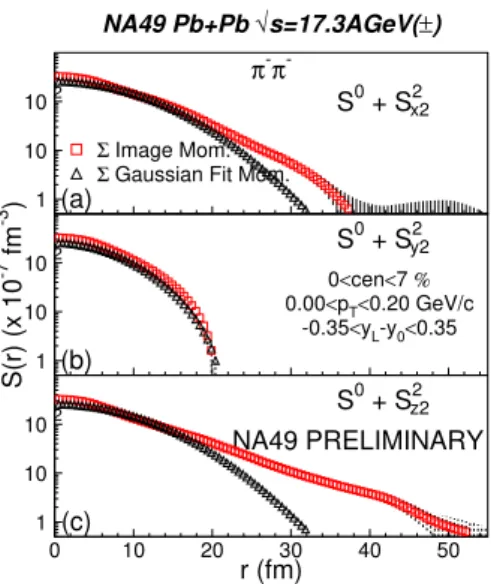
However, at 158 AGeV incident energy (√s=17.3 AGeV), Fig. 18 panels (a) and (c) show that there are significant devi-ations of the source image from the Gaussian fit in the x and z directions respectively: the source image seems to exhibit a non-Gaussian tail which extends beyond the range of the Gaussian fit forr>17 fm in the out and long directions.
NA49 Pb+Pb √s=8.9AGeV(±)
r (fm)
S(r) (x 10
-7 fm -3 )
π-π
-S0 + S x22
S0 + S y22
S0 + S z22
(a)
(b)
(c)
NA49 PRELIMINARY Σ Image Mom.
Σ Gaussian Fit Mom.
0<cen<7%
0.00<pT<0.20 GeV/c -0.35<yL-y0<0.35 1
10 102
1 10 102
1 10 102
0 10 20 30 40 50
FIG. 16: (Color online) Same as Fig. 15 but for √s=8.9 AGeV (incident beam energy of 40 AGeV). The result is the average over runs with +ve and -ve magnetic field.
NA49 Pb+Pb √s=12.4AGeV
r (fm)
S(r) (x 10
-7 fm -3 )
π-π
-S0 + S x22
S0 + S y22
S0 + S z22
(a)
(b)
(c)
NA49 PRELIMINARY Σ Image Mom.
Σ Gaussian Fit Mom.
0<cen<7%
0.00<pT<0.20 GeV/c -0.35<yL-y0<0.35 1
10 102
1 10 102
1 10 102
0 10 20 30 40 50
FIG. 17: (Color online) Same as Fig. 15 but for√s=12.4 AGeV (incident beam energy of 80 AGeV).
V. DISCUSSION
NA49 Pb+Pb √s=17.3AGeV(±)
r (fm)
S(r) (x 10
-7 fm
-3 )
π-π
-S0 + S x22
S0 + S y22
S0 + S z22
(a)
(b)
(c)
NA49 PRELIMINARY Σ Image Mom.
Σ Gaussian Fit Mom.
0<cen<7%
0.00<pT<0.20 GeV/c -0.35<yL-y0<0.35 1
10 102
1 10 102
1 10 102
0 10 20 30 40 50
FIG. 18: (Color online) Same as Fig. 15 but for√s=17.3 AGeV (incident beam energy of 158 AGeV). The result is the average over runs with +ve and -ve magnetic field.
(√s=200 AGeV) [6], is already manifest at much lower en-ergies at the SPS. This points to the expectation that there are new physics processes which set in between 80 AGeV (√s=12.4 AGeV) and 158 AGeV (√s=17.3 AGeV) which result in the non-Gaussian tails in this energy regime.
Could the non-Gaussian tails observed at 158 AGeV be due to resonance decays such as theωmeson ? However, the gen-eral finding is that the resonance population does not change significantly from √s=12.4 AGeV to √s=17.3 AGeV. Hence, it is unlikely that resonance decays could account for the observed non-Gaussian tail at 158 AGeV.
VI. CONCLUSIONS
The NA49 Collaboration has performed the first extrac-tion of emission source funcextrac-tions for mid-rapidity, low pT
pions produced in central Pb+Pb collisions over the beam en-ergy range 20-158 AGeV at SPS. The source functions are essentially Gaussian and change little from 20 to 80 AGeV. At 158 AGeV, the two-pion source function displays non-Gaussian tails in the out and long directions. It is unlikely that these non-Gaussian tails originate from secondary pions produced in resonance decays.
[1] Quark Matter 2005 Proceedings of the 18th International Con-ference on Ultra-Relativistic Nucleus-Nucleus Collisions, Bu-dapest, Hungary, August 4-9, 2005, Nucl. Phys. A774(2006). [2] D.A. Brown and P. Danielewicz, Phys. Lett. B398, 252 (1997). [3] D.A. Brown and P. Danielewicz, Phys. Rev. C57, 2474 (1998). [4] D.A. Brown and P. Danielewicz, Phys. Rev. C64, 14902 (2001). [5] P. Chung et al, Nucl. Phys. A749, 275c (2005).
[6] S.S. Adler et al.(PHENIX Collaboration), nucl-ex/0605032. [7] C. Alt et al.(NA49 Collaboration), CERN-SPSC-2005-041,
CERN-SPSC-P-264-ADD-12, Nov 2005.
[8] S. Afanasiev et al., Nucl. Instrum. Meth. A430, 210 (1999). [9] P. Danielewicz and S. Pratt, Phys. Lett. B618, 60 (2005). [10] P. Chung et al, XXXV International Symposium on
Multipar-ticle Dynamics, Kromeriz, Czech Republic, 9-15 August 2005, and Workshop on Particle Correlations and Femtoscopy, 15-17 August 2005, p. 499 (2006).