Article
Printed in Brazil - ©2013 Sociedade Brasileira de Química0103 - 5053 $6.00+0.00
A
*e-mail: [email protected]
Application of Box-Behnken Design to the Study of Fatty Acids and
Antioxidant Activity from Enriched White Bread
Swami A. Maruyama,a Sylvio V. Palombini,a Thiago Claus,a Fabiana Carbonera,a
Paula F. Montanher,a Nilson E. de Souza,b Jesuí V. Visentainer,a
Sandra T. M. Gomesa and Makoto Matsushita*,a
aDepartment of Chemistry, State University of Maringa,
Av. Colombo, 5790, 87020-900 Maringá-PR, Brazil
bDepartment of Food Technology, Federal University of Technology - Paraná,
Rua dos Pioneiros, 3131, 86036-370 Londrina-PR, Brazil
Este estudo avaliou a composição centesimal de ácidos graxos e a atividade antioxidante total de pães utilizando um design Box-Behnken composto de quinze experimentos e três fatores. Os pães estudados tiveram parte do seu tempo de cozimento alterado, assim como parte da sua farinha de trigo substituída por sementes de chia e folhas de cenoura. Os resultados de capacidade antioxidante de cada experimento foram superiores aos obtidos para um pão controle (495,33 µmol TEAC g–1
para ensaio DPPH e 413,85 µmol TEAC g–1 para ensaio FRAP), mostrando níveis de aumento
de até 97 e 102% para os ensaios DPPH e FRAP, respectivamente. Os pães modificados também mostraram aumentos de até 216,69 e 18,88% na quantidade de ácido alfa-linolênico e na razão PUFA:SFA, respectivamente, em relação ao mesmo pão controle (este com 34,03 mg g–1 de ácido
alfa-linolênico e razão de 2,86), bem como máxima redução de 70,01% na razão omega-3:omega-6 (15,59 para o pão controle).
This work determined the proximate/fatty acid composition and the antioxidant activity of breads using a Box-Behnken design composed of fifteen experiments and three factors. The studied breads had altered baking times and the wheat flour was partially substituted by chia seeds and carrot leaves. Total antioxidant capacity results were superior to those obtained from control bread (495.33 µmol TEAC g–1 for DPPH assays and 413.85 µmol TEAC g–1 for FRAP assays), showing
increased levels of 97 and 102% for DPPH and FRAP assays, respectively. The addition of chia seeds and carrot leaves led to maximal alpha-linolenic acid increase of 216.69% and maximum PUFA:SFA ratio increase of 18.88% in relation to control bread (this with alpha-linolenic acid amount of 34.03 mg g–1 total lipid and a 2.86 ratio value), as well as a maximum omega-3:omega-6
ratio reduction of 70.01% (15.59 ratio value for control bread).
Keywords: bread, Box-Behnken design, fatty acids, antioxidants, response surface
Introduction
Bread is a food that forms part of the daily meals of many people worldwide, in Brazil its per capita consumption is 27 kg per year. Such popularity is attributed to its excellent flavor, low cost and high availability in bakeries. The bread market is undergoing a great expansion and there is a demand for new recipes and ingredients.1 Bakery products
are also an ideal matrix to add chemical compounds,
which act in the prevention of nutrition-related diseases.2,3
Among such compounds, those with an antioxidant mode of action and polyunsaturated fatty acids (PUFA) have received great attention lately.
In general, an antioxidant compound is any substance present in low concentrations when compared to an oxidizable substrate and effectively delays or inhibits its oxidation.4 Currently, there is a great concern about the
damage caused by oxidative stress, which can affect DNA leading to carcinogenic effects.5 As a result, the importance
PUFA, especially from the omega-3 (n-3) group, are extensively featured in the scientific literature because they can lead to beneficial omega-3:omega-6 (n-6) ratios. An optimal n-6:n-3 ratio intake has been shown to prevent a series of human diseases such as coronary heart disease, cardiovascular disease, rheumatoid arthritis, depression, postpartum depression, cancers, diabetes and anti-inflammatory action.6,7
The incorporation of these compounds into bread alters its chemical composition substantially. To properly quantify such changes, a number of factors must be studied. However, this increase in the number of factors under study necessitates a significant number of experiments. To avoid this, the use of an alternative experimental design, such as the Box-Behnken design (BBD), could reduce the number of required experiments. BBD is a three-level fractional-factorial design consisting of three interlocked 22 factorial
designs and a center point.8
By comparing the BBD with other response surface designs, like central composite and three-level full factorial design, it was demonstrated that BBD is slightly more efficient than the central composite design and much more efficient than the three-level full factorial designs. Another advantage of the BBD is that it does not contain points in which all factors are simultaneously at their highest or lowest levels. So, these designs are useful for the avoidance of experiments performed under extreme conditions, for which unsatisfactory results might occur.8,9
BBD has been applied in the optimization of several chemical and physical processes.9,10 However, it has not
been used to investigate how much the baking time and addition of foods rich in PUFAs and antioxidants change the chemical composition of bread. This work determined the proximate/fatty acid compositions and antioxidant activity of breads using a BBD design composed of fifteen experiments and three factors. The breads had part of their baking time changed, and the wheat flour was partially substituted by chia seeds and carrot leaves. Chia seeds
(Salvia hispanica L.) were chosen for this work due to their
remarkable n-3 fatty acid composition,11 and carrot leaves
(Daucus carota L.) were selected because they possess
antioxidant compounds, like carotenoids and phenolics compounds.12 Other statistical tools such as response surface
methodology and analysis of variance were also employed.
Experimental
Sampling
Carrot leaves were acquired from retail stores, washed, sterilized with 200 ppm sodium hypochlorite solution for
15 min, and then dried in a laboratory oven (QUIMIS, Maringá, Brazil) with air circulation at 60 °C for 7 h. After this process, the dehydrated leaves were milled, passed through a 14 mesh (1.19 mm) sieve and stored at –18 °C under vacuum for later use. Chia seeds were also acquired from retail stores and underwent the same milling, sieving and storing processes as the dried carrot leaves.
Bread production
A traditional white bread recipe was used,13 but parts
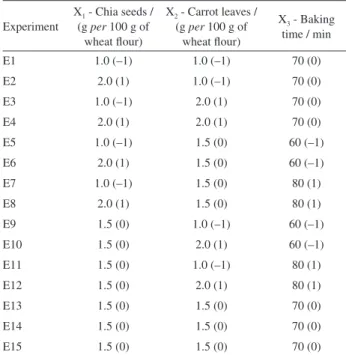
of the original wheat flour were substituted by different quantities of chia seeds and carrot leaves. The baking time was also investigated. A BBD design, generated by the Design-Expert 7.1 software (Stat-Ease Inc., USA) and composed of fifteen experiments, was employed to investigate the influence of these three factors (amount of chia seeds, carrot leaves and baking time) on total antioxidant capacity (TAC) and proximate/fatty acid compositions of bread. The parameters of the experiments can be observed in Table 1.
Maximum and minimum levels were chosen by carrying out preliminary screening tests and according to economic aspects. The experiments were performed in a bread machine (Britânia brand, model Multi Pane) to make the enriched breads. A control bread, baked for 60 min (as specified in the original recipe)13 and without
the addition of chia seeds or carrot leaves, was also
Table 1. Box-Behnken design layout with coded levels and actual values of variables
Experiment
X1 - Chia seeds /
(g per 100 g of wheat flour)
X2 - Carrot leaves /
(g per 100 g of wheat flour)
X3 - Baking
time / min
E1 1.0 (–1) 1.0 (–1) 70 (0)
E2 2.0 (1) 1.0 (–1) 70 (0)
E3 1.0 (–1) 2.0 (1) 70 (0)
E4 2.0 (1) 2.0 (1) 70 (0)
E5 1.0 (–1) 1.5 (0) 60 (–1)
E6 2.0 (1) 1.5 (0) 60 (–1)
E7 1.0 (–1) 1.5 (0) 80 (1)
E8 2.0 (1) 1.5 (0) 80 (1)
E9 1.5 (0) 1.0 (–1) 60 (–1)
E10 1.5 (0) 2.0 (1) 60 (–1)
E11 1.5 (0) 1.0 (–1) 80 (1)
E12 1.5 (0) 2.0 (1) 80 (1)
E13 1.5 (0) 1.5 (0) 70 (0)
E14 1.5 (0) 1.5 (0) 70 (0)
produced to determine the incorporation efficiency of the ingredients under investigation in this food matrix. After the stipulated baking time, breads were allowed to cool to room temperature, then milled and stored at –18 °C under vacuum for later analysis.
Chemical analysis
All analyses were accomplished in three replicates. Total lipids (TL) in the bread samples were determined according to Bligh and Dyer.14 The moisture content was
determined using AOAC Official Method 930.15, ash content using AOAC Official Method 942.05 and crude protein (CP) was measured following AOAC Official Method 960.52,15 using a factor of 5.70 to convert the
percentage of nitrogen into protein percentage.
Fatty acid composition
Fatty acid methyl esters (FAME) were prepared by total lipid methylation following Hartman and Lago.16
The methyl esters were separated by gas chromatography in a Varian 3380 (USA) gas chromatograph fitted with a flame ionization detector (FID) and a fused-silica capillary column (100 m × 0.25 mm id., 0.25 µm cyanopropyl CP-7420 select FAME). The injector and detector temperatures were 200 and 240 °C, respectively. The column temperature was maintained at 185 °C for 8 min, followed by a heating rate of 4 °C min–1 until 235 °C, which
was maintained for 0.5 min. The ultra-pure gas flows were 1.2 mL min–1 carrier gas (hydrogen), 30 mL min–1 make-up
gas (nitrogen), 350 mL min–1 synthetic air and 35 mL min–1
hydrogen flame gas, split injection ratio of 1:80.
To identify fatty acids, retention times were compared to those of standard methyl esters (Sigma, USA). Quantification of fatty acids was performed using tricosanoic acid methyl ester (Sigma, USA) as an internal standard, according to Joseph and Ackman.17 Peak areas
were determined using the software Star 5.0 (Varian, USA).
Antioxidant capacity analysis
For TAC analysis, all previously ground samples were passed through an 80 mesh (0.177 mm) sieve to avoid the influence of different particle sizes in Quencher procedures.18 Solutions were prepared according to
Serpen et al.19 The stock solution of
2,2-diphenyl-1-picrylhydrazyl (DPPH) was obtained by dissolving 40 mg of DPPH in 200 mL of an ethanol/water mixture (50:50, v:v). The absorbance value of 0.75-0.80 was set by diluting the stock solution in approximately 800 mL of a
water/ethanol (50:50, v:v) mixture. The FRAP solution was prepared as described by Benzie and Strain,20 diluting an
aqueous solution of 10 mmol L–1 2,4,6-tripyridyl-s-triazine
(TPTZ) and 20 mmol L–1 ferric chloride in 300 mmol L–1
sodium acetate buffer (pH 3.6) at a ratio of 1:1:10 (v:v:v). 10 mg of each ground sample were weighed and placed into a centrifuge tube. For the DPPH and FRAP assays, 10 mL of the respective working solutions were added to start the reactions. All tubes were shaken for 1 h, centrifuged at 9200 g for 5 min, and then the absorbance of the supernatants were measured at 525 nm (for DPPH assay) and 593 nm (for FRAP assay).19
6-Hydroxy-2,5,7,8-tetramethylchroman-2-carboxylic acid (Trolox) was used as a standard reference to convert the inhibition capability of each sample to the trolox equivalent antioxidant capacity (TEAC), as described by Serpen et al.19
Statistical analysis
All analyses were carried out in triplicate. The experimental results were analyzed through a response surface methodology generated by the Design-Expert 7.1 software (Stat-Ease Inc., USA). Model fit quality was evaluated by variance analysis (ANOVA) and determination coefficients. The basic model equation used to fit the data was:
Y = β0 + β1X1 + β2X2 + β3X3 + β12X1X2 + β13X1X3 +
β23X2X3 + β11X12 + β22X22 + β33X32 (1)
where Y is the desired response, X1, X2 and X3 are
independent variables representing chia, carrot leaves and baking time, respectively. β0 is a constant, β1, β2 and β3
are the coefficients translating the linear weight of X1,
X2 and X3, respectively. β12, β13 and β23 are the coefficients
translating the interactions between the variables, and β11,
β22 and β33 are the coefficients translating the quadratic
influence of X1, X2 and X3.
Results and Discussion
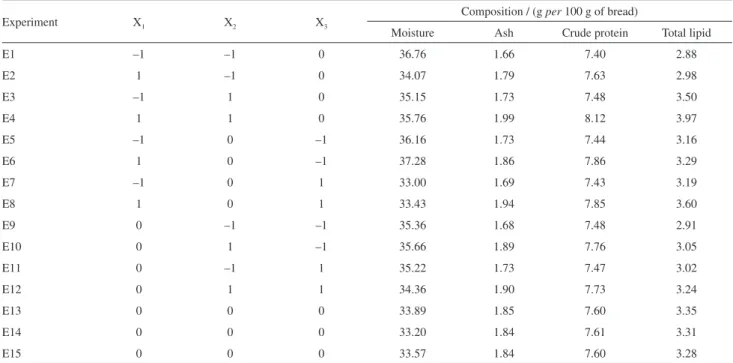
Chemical analysis
E8 gave the lowest. It was observed that the increase in TL in the breads was proportional to the percentages of added chia seeds and carrot leaves. In relation to moisture, every experiment showed lower values regarding the obtained ones for control bread (38.02%), along with a difficulty in establishing a relation between results and X1, X2 and X3
factors.
Total moisture values, which were measured at 105 °C, are not only related to water content, but with volatile compounds as well.15 With an increase in the baking time,
more of these compounds are expelled from the system due to evaporation, theoretically leading to concentration increases of other nutrients in the media.21 However,
during the early stages of the Maillard reactions occurring during bread baking, water is formed due to condensation of aldoses and amino compounds. More water is formed along with furfural of Schiff bases in the intermediate stages due to dehydration of 1-amino-1-deoxy-2-ketose which was originated by the Amadori rearrangement. These compounds are further consumed to form more amino compounds and melanoidins (high molecular weight brown compounds).22 All these reactions occur at the same
time during baking because melanoidins are formed with more frequency at bread crust, while at the center of it, the early and intermetidate stages of Maillard reaction are still occurring. Thus, the combination of all these factors together makes it difficult to predict how much the moisture varies. The same difficulty in prediction is observed for TL, probably because oxidized triacylglycerols can either
remain unmodified or undergo a degradation reaction, increasing the amount of volatile oxidation compounds.23
An increase in the percentages of chia seeds and carrot leaves added to the bread led to a direct increase in the contents of ash and CP. Baking time did not have a high influence on the responses since the same amount of inorganic compounds (ash) was present in the bread for different baking time. The same logic can be used to explain the trend observed for the values of CP: as a bread bakes, its proteins undergo cross-linking and Maillard reactions, producing other compounds with lower solubility in water.24
However, the Kjeldahl method only quantifies the total nitrogen from a sample, regardless of the molecule the nitrogen is bound to.
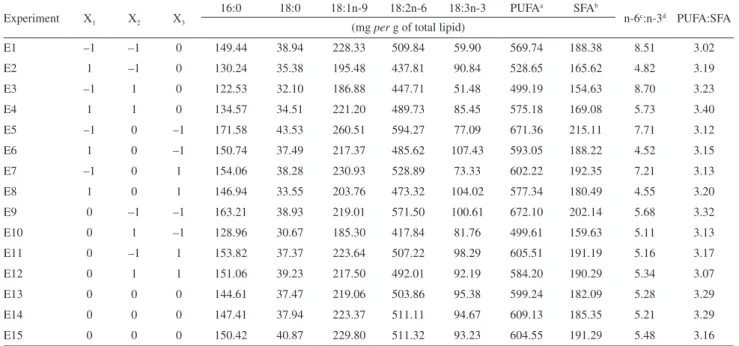
Fatty acid composition
Table 3 shows the fatty acid quantification from each experiment. The addition of chia seeds and carrot leaves led to maximal alpha-linolenic acid (18:3n-3) increase of 216.69% and maximum PUFA:SFA ratio increase of 18.88% in relation to control bread (which showed an alpha-linolenic acid amount of 34.03 mg g–1 TL and a
2.86 ratio value), as well as a maximum n-6:n-3 ratio reduction of 70.01% (15.59 ratio value for control bread). In most cases, decreases in linoleic (18:2n-6) and oleic (18:1n-9) acids were also observed in relation to control bread (which showed maximal linoleic and oleic acid values of 530.98 and 237.44 mg g–1 TL, respectively, for
Table 2. Proximate composition of experiments
Experiment X1 X2 X3
Composition / (g per 100 g of bread)
Moisture Ash Crude protein Total lipid
E1 –1 –1 0 36.76 1.66 7.40 2.88
E2 1 –1 0 34.07 1.79 7.63 2.98
E3 –1 1 0 35.15 1.73 7.48 3.50
E4 1 1 0 35.76 1.99 8.12 3.97
E5 –1 0 –1 36.16 1.73 7.44 3.16
E6 1 0 –1 37.28 1.86 7.86 3.29
E7 –1 0 1 33.00 1.69 7.43 3.19
E8 1 0 1 33.43 1.94 7.85 3.60
E9 0 –1 –1 35.36 1.68 7.48 2.91
E10 0 1 –1 35.66 1.89 7.76 3.05
E11 0 –1 1 35.22 1.73 7.47 3.02
E12 0 1 1 34.36 1.90 7.73 3.24
E13 0 0 0 33.89 1.85 7.60 3.35
E14 0 0 0 33.20 1.84 7.61 3.31
control bread). According to Perini et al.,25 linoleic and
α-linolenic fatty acids are strictly essential because they are not produced by human de novo synthesis and must be provided by an adequate diet. The ingestion of 18:1n-9, instead of saturated fatty acids (SFA), helps to reduce the low density lipoprotein levels in blood and, therefore, cardiovascular diseases occur with a lower probability.26
To indicate whether a particular food is healthy, the UK Health Department recommends that the value of the
PUFA:SFA ratio must be above 0.45.27 The PUFA:SFA
ratios of all the bread examined in this study were within these recommended values. Simopoulos28 found that the
optimal n-6:n-3 fatty acid ratio for human ingestion varies from 1 to 2. This conclusion was based on other medical research, which evaluated the relationship of the ingestion of essential fatty acids to the healing rate of patients with chronic diseases. Based on these findings, we observed that the breads with high percentages of chia seeds were the closest to the ideal ratio as stipulated above.
The chemical and physical changes that might occur to a lipid depend on its composition and treatment conditions. If the amount of oxygen in media is scarce, thermolytic reactions will occur. For SFAs, acrolein, oxopropyl esters, diacylglycerols and other compounds originating from non-oxidative decomposition are formed at 180 °C under low oxygen conditions. Unsaturated fatty acids might be dimerized or polymerized via Diels-Alder-type reactions.29 However, whilst kneading the dough during
the bread making process, a considerable amount of air is
incorporated into the system, thus it is unclear how much thermolytic reactions might affect the SFA concentrations.
In the presence of oxygen, aldehydes are formed as the major oxidative products of fatty acid oxidation. SFAs and their esters possess greater stability than their unsaturated counterparts. However, at a temperature of 150 °C or higher, they undergo oxidation, producing a series of carboxylic acids, n-alkanes, lactones and alkenes.29
Thus, as mentioned in the chemical analysis section, part of the oxidized triacylglycerols can suffer degradation reactions leading to volatile compounds that can escape to the atmosphere. But such oxidation can be avoided to a certain degree by substances with antioxidant activity, like Maillard reaction products (MRPs) and phenolic compounds.30 All of these possibilities make it difficult
to predict how the fatty acid composition of breads might change with simultaneous changes of X1, X2 and X3 factors.
Antioxidant capacity analysis
Table 4 shows the results of the TAC assays from each experiment. The experiments that showed the greatest TAC values through the DPPH assay were E3, E4 and E12. In the FRAP assay, the E3, E4 and E10 experiments showed the highest TAC values. It can be seen, that all these experiments were the ones with the maximum percentage of carrot leaves added. The lowest TAC values from the DPPH and FRAP assays were detected for the experiment E9, which was performed with the lowest quantity of carrot
Table 3. Fatty acid quantification and the n-6:n-3 and PUFA:SFA ratios
Experiment X1 X2 X3
16:0 18:0 18:1n-9 18:2n-6 18:3n-3 PUFAa SFAb
n-6c:n-3d PUFA:SFA
(mg per g of total lipid)
E1 –1 –1 0 149.44 38.94 228.33 509.84 59.90 569.74 188.38 8.51 3.02
E2 1 –1 0 130.24 35.38 195.48 437.81 90.84 528.65 165.62 4.82 3.19
E3 –1 1 0 122.53 32.10 186.88 447.71 51.48 499.19 154.63 8.70 3.23
E4 1 1 0 134.57 34.51 221.20 489.73 85.45 575.18 169.08 5.73 3.40
E5 –1 0 –1 171.58 43.53 260.51 594.27 77.09 671.36 215.11 7.71 3.12
E6 1 0 –1 150.74 37.49 217.37 485.62 107.43 593.05 188.22 4.52 3.15
E7 –1 0 1 154.06 38.28 230.93 528.89 73.33 602.22 192.35 7.21 3.13
E8 1 0 1 146.94 33.55 203.76 473.32 104.02 577.34 180.49 4.55 3.20
E9 0 –1 –1 163.21 38.93 219.01 571.50 100.61 672.10 202.14 5.68 3.32
E10 0 1 –1 128.96 30.67 185.30 417.84 81.76 499.61 159.63 5.11 3.13
E11 0 –1 1 153.82 37.37 223.64 507.22 98.29 605.51 191.19 5.16 3.17
E12 0 1 1 151.06 39.23 217.50 492.01 92.19 584.20 190.29 5.34 3.07
E13 0 0 0 144.61 37.47 219.06 503.86 95.38 599.24 182.09 5.28 3.29
E14 0 0 0 147.41 37.94 223.37 511.11 94.67 609.13 185.35 5.21 3.29
E15 0 0 0 150.42 40.87 229.80 511.32 93.23 604.55 191.29 5.48 3.16
leaves. These results show that there exists a possible positive relationship between an increase percentage of carrot leaves and TAC of bread.
The same trend is not observed after increasing the amount of chia seeds in bread, which did not result in a great change in the final TAC data when compared to carrot leaves. Nevertheless, the TAC results of every experiment were superior to those obtained from the control bread (495.33 µmol TEAC g–1 for the DPPH assay and
413.85 µmol TEAC g–1 for the FRAP assay), showing an
increase in levels of up to 97 and 102% from the DPPH and FRAP assays, respectively. These results showed that the simultaneous incorporation of chia seeds and carrot leaves positively changed the TAC levels of bread.
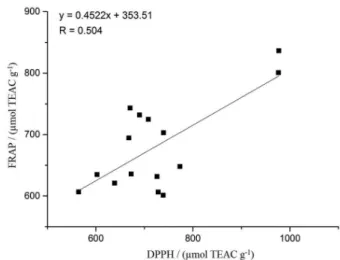
DPPH and FRAP assays (Figure 1) showed a relatively low correlation (r = 0.504). Despite these methods possessing the same reaction mechanism (electron transference), they are influenced by pH and the solvent of the reaction media.31
In this study, even with the direct procedure (Quencher) which is performed without extraction steps, there is still solvent in the reaction media, required for solubilization of the radicals used in every assay. In the DPPH method, a 50:50 (v:v) mixture of ethanol and water is responsible for the radical solubilization, whilst in the FRAP procedure radicals are solubilized in water. Furthermore, in the FRAP assay, pH is controlled at 3.6, unlike the DPPH assay. Some or all of these factors may have been responsible for the low correlation values obtained between the assays.
As can be observed, it was difficult to establish a pattern with simultaneous variation of the X1, X2 and X3 factors.
Although carotenoids from carrot leaves are very heat stable even after prolonged heat treatments, the phenolic compounds from the leaves can be consumed as reactants in Maillard reactions. But polyphenols with an intermediate-oxidation state can scavenge radicals with greater efficiency than the non-oxidized ones, as they can donate a hydrogen atom from the aromatic hydroxyl group to a free radical and/or support an unpaired electron through delocalization around the π-electron system with more ease. It should be noted that during the baking process, MRPs with pro-oxidant activity are formed in the early stages of the Maillard reaction prior to the Amadori rearrangement. However, as the reaction advances and food-browning becomes more intense, melanoidins with antioxidant activity are formed. The rate of formation of all these compounds depends on the intensity and/or duration of heat treatment.30
A series of events that might occur during the mixing process of the food matrices is redox reaction between natural antioxidant compounds and lipid oxidation products. They have almost unpredictable consequences on overall antioxidant properties and stability of food. Besides, MRPs can also help in prevention of lipid oxidation.30 Thus,
the simultaneous effects which happen between antioxidant compounds, MRPs and lipids were probably the reason why a defined trend regarding simultaneous modification of X1, X2 and X3 factors was not achieved.
ANOVA and response surface methodology
Further chemometric analyses of the results were hampered, probably due to the high chemical complexity of this food matrix (bread). However, this was not the case for ash, CP, n-3 and n-6:n-3 data. Thus, these four
Table 4. Results of antioxidant capacity by DPPH and FRAP assays
Experiment X1 X2 X3
Antioxidant capacity / (µmol TEAC g–1)
DPPH FRAP
E1 –1 –1 0 728.34 606.30
E2 1 –1 0 689.93 731.88
E3 –1 1 0 976.98 836.43
E4 1 1 0 976.25 800.80
E5 –1 0 –1 738.77 601.36
E6 1 0 –1 726.09 631.51
E7 –1 0 1 708.04 724.85
E8 1 0 1 739.46 703.10
E9 0 –1 –1 564.51 606.64
E10 0 1 –1 670.53 743.21
E11 0 –1 1 667.87 694.45
E12 0 1 1 773.04 648.04
E13 0 0 0 638.72 620.97
E14 0 0 0 602.32 634.93
E15 0 0 0 672.56 635.61
responses were analyzed by ANOVA and response surface methodology. Multiple regression analysis was employed on the data and between the models which were suggested by the software (linear, two factor interaction (2FI), quadratic and cubic). The quadratic model was selected as the most suitable, because it has a high significance order and it is not aliased.32 The adjusted models which
were obtained for ash, CP, n-3 fatty acids and n-6:n-3 ratios, as well as their ANOVA parameters, are listed in Table 5. ANOVA showed that the lack of fit obtained for the models was insignificant, meaning they were suitable for the evaluation of response surfaces.
The coefficient of determination (R2) is the proportion
of variation, in a determined response, which is attributed to the model instead of random errors. A well-adjusted model
must not possess an R2 value lower than 0.80. When R2 is
close to 1, this means that the empirical model is suitable for the obtained data.32
Table 6 shows that the R2 values for the response
variables were greater than 0.80, indicating the good quality of the obtained models. R2 values ranged from 0.9852 to
0.995. Adding a variable to the model will always increase the R2 value, independently of its statistic significance,
however. Thus, a high R2 value does not mean that, in every
case, the model to which it corresponds is suitable. Thus, it is better to use an adjusted R2 (adj-R2) of over 0.90 to
evaluate adequacy of a model. The obtained adj-R2 values
were above 0.95 for every response. This is very important since a high adj-R2 value means that insignificant terms
were not included in the model.32
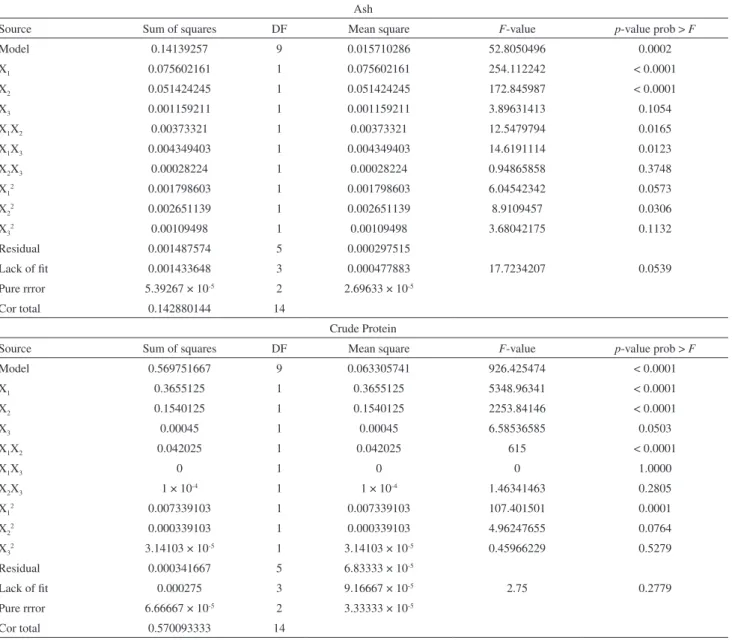
Table 5. ANOVA and quadratic models for the obtained responses
Ash
Source Sum of squares DF Mean square F-value p-value prob > F
Model 0.14139257 9 0.015710286 52.8050496 0.0002
X1 0.075602161 1 0.075602161 254.112242 < 0.0001
X2 0.051424245 1 0.051424245 172.845987 < 0.0001
X3 0.001159211 1 0.001159211 3.89631413 0.1054
X1X2 0.00373321 1 0.00373321 12.5479794 0.0165
X1X3 0.004349403 1 0.004349403 14.6191114 0.0123
X2X3 0.00028224 1 0.00028224 0.94865858 0.3748
X12 0.001798603 1 0.001798603 6.04542342 0.0573
X22 0.002651139 1 0.002651139 8.9109457 0.0306
X32 0.00109498 1 0.00109498 3.68042175 0.1132
Residual 0.001487574 5 0.000297515
Lack of fit 0.001433648 3 0.000477883 17.7234207 0.0539
Pure rrror 5.39267 × 10⁻⁵ 2 2.69633 × 10⁻⁵
Cor total 0.142880144 14
Crude Protein
Source Sum of squares DF Mean square F-value p-value prob > F
Model 0.569751667 9 0.063305741 926.425474 < 0.0001
X1 0.3655125 1 0.3655125 5348.96341 < 0.0001
X2 0.1540125 1 0.1540125 2253.84146 < 0.0001
X3 0.00045 1 0.00045 6.58536585 0.0503
X1X2 0.042025 1 0.042025 615 < 0.0001
X1X3 0 1 0 0 1.0000
X2X3 1 × 10⁻⁴ 1 1 × 10⁻⁴ 1.46341463 0.2805
X12 0.007339103 1 0.007339103 107.401501 0.0001
X22 0.000339103 1 0.000339103 4.96247655 0.0764
X32 3.14103 × 10⁻⁵ 1 3.14103 × 10⁻⁵ 0.45966229 0.5279
Residual 0.000341667 5 6.83333 × 10⁻⁵
Lack of fit 0.000275 3 9.16667 × 10⁻⁵ 2.75 0.2779
Pure rrror 6.66667 × 10⁻⁵ 2 3.33333 × 10⁻⁵
Table 6. Parameters for the obtained quadratic models
Ash Crude protein n-3 n-6:n-3
Mean 1.81 8.37 87.05 5.93
Standard deviation 0.017 8.440 × 10⁻³ 3.13 0.28
R2 0.9896 0.9995 0.9862 0.9852
Adjusted R2 0.9708 0.9985 0.9612 0.9585
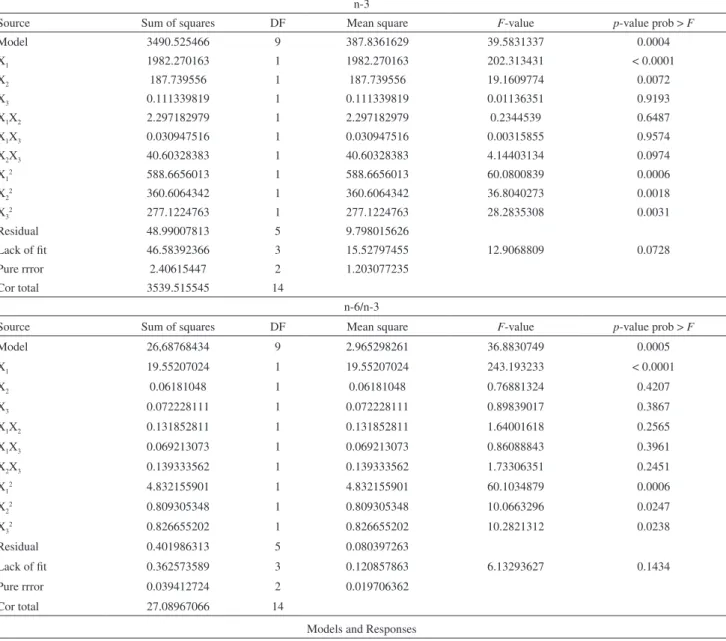
Coefficient of variation / % 0.95 0.10 3.60 4.78 n-3
Source Sum of squares DF Mean square F-value p-value prob > F
Model 3490.525466 9 387.8361629 39.5831337 0.0004
X1 1982.270163 1 1982.270163 202.313431 < 0.0001
X2 187.739556 1 187.739556 19.1609774 0.0072
X3 0.111339819 1 0.111339819 0.01136351 0.9193
X1X2 2.297182979 1 2.297182979 0.2344539 0.6487
X1X3 0.030947516 1 0.030947516 0.00315855 0.9574
X2X3 40.60328383 1 40.60328383 4.14403134 0.0974
X12 588.6656013 1 588.6656013 60.0800839 0.0006
X22 360.6064342 1 360.6064342 36.8040273 0.0018
X32 277.1224763 1 277.1224763 28.2835308 0.0031
Residual 48.99007813 5 9.798015626
Lack of fit 46.58392366 3 15.52797455 12.9068809 0.0728
Pure rrror 2.40615447 2 1.203077235
Cor total 3539.515545 14
n-6/n-3
Source Sum of squares DF Mean square F-value p-value prob > F
Model 26,68768434 9 2.965298261 36.8830749 0.0005
X1 19.55207024 1 19.55207024 243.193233 < 0.0001
X2 0.06181048 1 0.06181048 0.76881324 0.4207
X3 0.072228111 1 0.072228111 0.89839017 0.3867
X1X2 0.131852811 1 0.131852811 1.64001618 0.2565
X1X3 0.069213073 1 0.069213073 0.86088843 0.3961
X2X3 0.139333562 1 0.139333562 1.73306351 0.2451
X12 4.832155901 1 4.832155901 60.1034879 0.0006
X22 0.809305348 1 0.809305348 10.0663296 0.0247
X32 0.826655202 1 0.826655202 10.2821312 0.0238
Residual 0.401986313 5 0.080397263
Lack of fit 0.362573589 3 0.120857863 6.13293627 0.1434
Pure rrror 0.039412724 2 0.019706362
Cor total 27.08967066 14
Models and Responses
Ash = 1.84257 + 0.097212X1 + 0.080175X2 + 0.012038X3 + 0.030550X1X2 + 0.032975X1X3 – 8.40000E–3X2X3 – 0.022071X12 – 0.026796X22 – 0.017221X32
Crude protein = 7.60333 + 0.21375X1 + 0.13875X2 – 7.50000E–3X3 + 0.10250X1X2.– 2.60209E–4X1X3.– 5.00000E–3X2X3 + 0.044583X12 + 0.0095833X22
– 2.91667E–3X 32
n-3 = 94.43027 + 15.74115X1 – 4.84432X2 + 0.11797X3 + 0.75782X1X2 + 0.087960X1X3 + 3.18604X2X3 – 12.62657X12 – 9.88252X22 + 8.66337X32
n-6/n-3 = 5.32715 – 1.56333X1 + 0.087899X2 – 0.095018X3 + 0.18156X1X2 + 0.13154X1X3 + 0.18664X2X3 + 1.14399X12 + 0.46817X22 – 0.47317 X32 aDF: degrees of freedom.
Table 5. continuation
The coefficient of variation (CV) describes the extension of data dispersion. As a general rule, CV must not be above 10%. None of the CV values obtained in this work exceeded this limit, representing a good precision and reliability in the experiments which were conducted.32
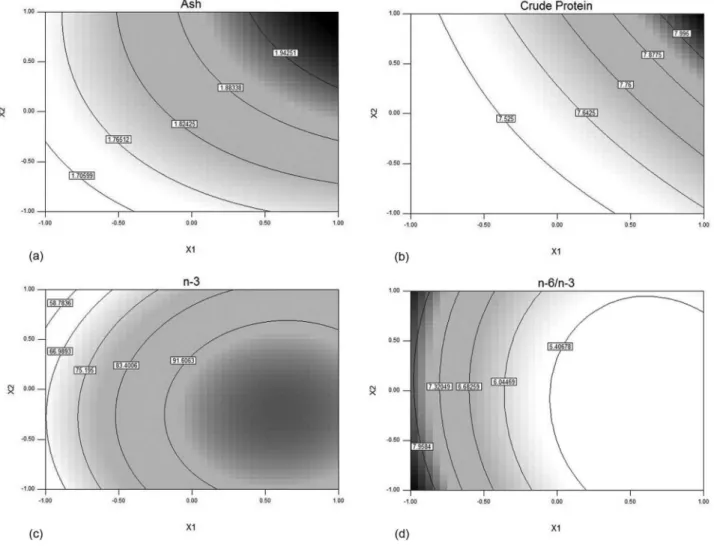
Figure 2 shows the response surface graphs for X1 and X2
Figure 2. Contour charts showing the effects of the variables to the values of (a) ash, (b) crude protein, (c) n-3 and (d) n-6:n-3.
From the n-3 response surface, it is clear that X1 (chia seeds)
was the factor which greatly affected total concentration of this fatty acid, while for the n-6:n-3 ratio, the best values were obtained with the highest X1 percentage. It is important to
note that, unlike for the other responses, n-6:n-3 ratio values must be as low as possible.
Conclusions
The BBD, allied with FRAP, DPPH and GC-FID methods, confirmed that, despite the deleterious effects of a high temperature baking process, there was a considerable incorporation of n-3 fatty acids and antioxidant compounds into a recipe of traditional white bread. However, probably due to a series of physicochemical phenomena which occurred simultaneously, defined trends regarding simultaneous modification of X1, X2 and X3 factors were
not achieved for the majority of responses, except for ash, CP, n-3 and n-6:n-3 data. Further chemometric analysis showed that the devised empirical models were suitable for
the obtained data, for the evaluation of response surface and that chia seeds had a greater influence on responses than carrot leaves.
Acknowledgments
The authors would like to thank CAPES for financial support.
References
1. Esteller, M. S.; Yoshimoto, R. M. O.; Amaral, R. L.; Lannes, S. C. S.; Food Sci. Technol. 2004, 24, 602.
2. Day, L.; Seymour, R. B.; Pitts, K. F.; Konczak, I.; Lundin, L.;
Trends Food Sci. Technol. 2009, 20, 388.
3. Rocha, L. S.; Santiago, R. A. C.; Food Sci. Technol. 2009, 29, 820.
4. Sies, H.; Stahl, W.; Am. J. Clin. Nutr. 1995, 62, 1315. 5. Klaunig, J. E.; Wang, Z.; Pu, X.; Zhou, S.; Toxicol. Appl.
6. Navarro, R. D.; Navarro, F. K. S. P.; Ribeiro Filho, O. P.; Ferreira, W. M.; Pereira, M. M.; Seixas Filho, J. T.; Food Chem.
2012, 134, 215.
7. Visentainer, J. V.; Souza, N. E.; Matsushita, M.; Hayashi, C.; Franco, M. R. B.; Food Chem. 2005, 90, 557.
8. Ferreira, S. L.; Bruns, R. E.; Ferreira, H. S.; Matos, G. D.; David, J. M.; Brandao, G. C.; da Silva, E. G.; Portugal, L. A.; dos Reis, P. S.; Souza, A. S.; dos Santos, W. N.; Anal. Chim. Acta. 2007, 597, 179.
9. Khajvand, T.; Chaichi, M. J.; Nazari, O.; Golchoubian, H.;
J. Lumin. 2011, 131, 838.
10. Tekindal, M. A.; Bayrak, H.; Ozkaya, B.; Genc, Y.; Turk. J. Field Crops 2012, 17, 115.
11. Uribe, J. A. R.; Perez, J. I. N.; Kauil, H. C.; Rubio, G. R.; Alcocer, C. G.; J. Supercrit. Fluids. 2011, 56, 174.
12. Almeida-Muradian, L. B.; Popp, V.; Farias, M. P.; Food Sci. Technol. 1997, 17, 120.
13. http://www.britania.com.br/arquivos/britaniashop/ manuais/9064301000.pdf, accessed in April 2013.
14. Bligh, E. G.; Dyer, W. J.; Can. J. Biochem. Physiol. 1959, 37, 911.
15. AOAC; Official Methods of Analysis, 15th ed., Association of
Official Analytical Chemists: Arlington, 1990. 16. Hartman, L.; Lago, R. C. A.; Lab. Pract. 1973, 22, 475. 17. Joseph, J. D.; Ackman, R. G.; J. AOAC Int. 1992, 75, 488. 18. Gökmen, V.; Serpen, A.; Fogliano, V.; Trends Food Sci. Technol.
2009, 20, 278.
19. Serpen, A.; Gokmen, V.; Fogliano, V.; Meat Sci. 2012, 90, 60. 20. Benzie, I. F. F.; Strain, J. J.; Anal. Biochem. 1996, 239, 70.
21. Türkkan, A. U.; Cakli, S.; Kilinc, B.; Food Bioprod. Process.
2008, 86, 163.
22. Purlis, E.; J. Food Eng. 2010, 99, 239.
23. Caponio, F.; Summo, C.; Pasqualone, A.; Bilancia, M. T.;
J. Cereal Sci. 2008, 48, 407. 24. Singh, H.; Food Chem. 2005, 90, 247.
25. Perini, J. A. L.; Stevanato, F. B.; Sargi, S. C.; Visentainer, J. E. L.; Dalalio, M. M. O.; Matsushita, M.; Souza, N. E.; Visentainer, J. V.; Braz. J. Nutr. 2010, 23, 1075.
26. Elmadfa, I.; Kornsteiner, M.; Ann. Nutr. Metab. 2009, 55, 56. 27. Department of Health; Nutritional Aspects of Cardiovascular
Disease. Report of the Cardiovascular Review Group of the
Committee on Medical Aspects of Food Policy _ Report on
Health and Social Objects, vol. 46; Her Majesty’s Stationery Office (HMSO): London, UK, 1994.
28. Simopoulos, A. P.; Mol. Neurobiol. 2011, 44, 203. 29. Nawar, W. W.; J. Chem. Educ. 1984, 61, 299.
30. Nicoli, M. C.; Anese, M.; Parpinel, M.; Trends Food Sci. Technol. 1999, 10, 94.
31. Apak, R.; Güçlü, K.; Demirata, B.; Özyürek, M.; Çelik, S. E.; Bektasoglu, B.; Berker, K. I.; Özyurt, D.; Molecules 2007, 12, 1496.
32. Neto, B. B.; Scarminio, I. S.; Bruns, R. E.; Como Fazer
Experimentos: Pesquisa e Desenvolvimento na Ciência e na
Indústria; Editora da Unicamp: Campinas, Brasil, 2001.
Submitted: April 25, 2013