INTRODUCTION
In the industrial processing of ceramic bodies such as loor and wall tiles, due to the sensitivity to raw materials and/ or processing changes and the simplicity of their laboratory determination, the bending modulus of rupture, linear iring shrinkage and water absorption are frequently used as quality and process control parameter in the development and manufacture stages [1, 2]. Under constant processing conditions, these properties are basically determined by the
mixture of raw materials and can, therefore, be modeled using the optimization methodology speciic to the design of mixture experiments. Such procedure is common practice in the chemical industry [3-5] and is becoming popular in the ield of glasses and ceramics [6-8]. It has proven, in all cases reported, to lead to greater eficiency and conidence in the results obtained, and to be less demanding in time, both material and human resources.
The design of mixture experiments conigures a special case in response surface methodologies using mathematical Abstract
In the production of wall and loor ceramic tiles, mixtures of raw materials from several origins with different physical and chemical characteristics are used. Those changes of raw materials alter the quality of the inished product, what implicates in the constant reformulation in the composition of the ceramic mass through try and error, consuming time and materials. This conigures the ideal circumstance to apply the techniques of experiments design, often used in many areas to model properties of such ceramic bodies. In the present study, 21 formulations of six raw materials, namely talc, quartz, calcareous, phyllite, dolomite and clay were selected and used as control factors in the experiments design. Those formulations were processed under conditions similar to those used in the ceramics industry: powder preparation (wet grinding, drying, granulation and drying), green body preparation (pressing and drying), iring (at 1180 ºC) and characterization. With the experimental results, regression models were calculated, relating bending strength, linear iring shrinkage and water absorption. After statistical analysis and veriication experiments, the signiicance and validity of the models were conirmed, and one technique for optimization of ceramic bodies was developed: a mathematical expressions denominated loss of quality function. The regression models and the developed technique of the loss quality can then be used for the best combination of those six raw materials to produce a ceramic body with speciied properties.
Keywords: mixture experiments, statistical analysis, mixtures optimization, experimental design.
Resumo
Na produção de revestimentos cerâmicos para parede e piso, são usadas misturas com matérias-primas de diversas regiões com características físicas e químicas diferentes. Essas mudanças de matérias-primas alteram as qualidades do produto inal, o que implica em constante reformulação na composição de massas cerâmicas através de tentativas e erros, consumindo tempo e material. Isso conigura a circunstância ideal para aplicar as técnicas de projeto de experimentos, freqüentemente usadas em outras áreas para modelar as propriedades mecânicas de corpos cerâmicos. No presente estudo, 21 formulações foram desenvolvidas a partir de seis matérias-primas utilizadas como fator de controle no projeto de experimento: talco, quartzo, calcário, ilito, dolomita e argila. Essas misturas foram processadas em condições semelhantes aquelas usadas na indústria cerâmica: preparação da massa (moagem a úmido, secagem, granulação) preparação do corpo verde (prensagem e secagem) aquecimento (a 1180 ºC) e caracterização. Com os resultados experimentais foram calculados os modelos de regressão relacionando resistência à lexão, retração linear e absorção de água. Depois da análise estatística e veriicação dos experimentos, o nível de signiicância e validades dos modelos foram conirmados, e uma técnica para otimização dos corpos cerâmicos foi desenvolvida, com expressões matemáticas denominadas função perda de qualidade.Os modelos de regressão e a técnica desenvolvida de perda de qualidade podem então ser usados para a melhor combinação daquelas seis matérias-primas para produzir um corpo cerâmico com propriedades especíicas.
Palavras-chave:projeto de misturas, análise estatística, otimização de misturas, projeto de experimentos.
Technique for optimization of ceramic bodies using mixture design
(Técnica para otimização de corpos cerâmicos usando projeto de misturas)
J. Silveira, J. P. Leite
Department of Mechanical Engineering, Center of Technology, Federal University of Paraiba - UFPB, J. Pessoa, PB, Brazil
and statistical techniques, with important applications not only in new products design and development, but also in the improvement of the design of existing products. The basic assumption is that there is a given mixture property which depends solely on the fractions (xi, summing up to unity) of speciic components, or ingredients, of the mixture, and not on the amount of the mixture; thus, the changes in (or the response of) the property is entirely determined by the proportions of those components. To this aim, it is necessary, irst to select the appropriate mixtures from which the response surface might be calculated; having the response surface, a prediction of the property value can be obtained for any mixture, from the changes in the proportions of its components [9-11].
In a system with q independent variables (or components), there will be (q - 1) independent composition variables xi, and the geometric description of the factor space containing the q components consists of all points on or inside the boundaries (vertices, edges, faces…) of a regular (q-1) dimensional simplex.
For 6 components of the simplex lattice {6, 2}, the experiments numbers are [1, 2]:
N = (q + m – 1) ! ⁄ m! .( q – 1 ) ! (A) where: q=6 raw materials and m=2 second degree
The response (property) function f can be expressed in its canonical form as a low degree polynomial (typically, irst, second or third degree) [1, 2]:
q
Linear: f = ∑ βi xi (B) i =1
q q
Second degree: f = ∑ βi xi + ∑ ∑ βij xi xj (C) i =1 i< j
Special cubic :
q q q
f = ∑ βi xi + ∑ ∑ βij xi xj + ∑ ∑ ∑ βijk xi xjxk (D) i =1 i< j i< j< k
This polynomial equation has to be evaluated over a number N of points so that it can represent the response surface over the entire region and it is only natural that a regular array of uniformly spaced points (i.e. a lattice) is used. This lattice is referred to as a {q, m} simplex lattice, m being the spacing parameter in the lattice. Then, a laboratory study consisting of N experiments (N > q) has to be carried out and the values of the property on those selected N lattice points evaluated. Regression equations such as B to D are then itted to those experimental values and the model is considered valid only when the differences between the experimental and the calculated values (error) are uncorrelated and randomly distributed with a zero
mean value and a common variance. When some or all the compositions xi are restricted by either a lower bound and/or an upper bound (i.e. the component fraction is not allowed to vary from 0 to 1.0 only a sub-region of the original simplex is of interest), which is frequently the case, the concept of pseudo-component can be used to deine another simplex of new components (pseudo-components) present in the proportions xi and to which the {q, m} simplex lattice is applied. The fractions xi’ are irst calculated from the original xi { by xi’ = (xi − Li)/(1 – ∑Li ) }, where Li is the lower bound for the ith component and ∑Li is the sum of all the lower bounds, < 1 ) and, once the regression equation is obtained, they are reverted back to the original components, so that the mixture can be prepared and the property experimentally determined [1, 2].
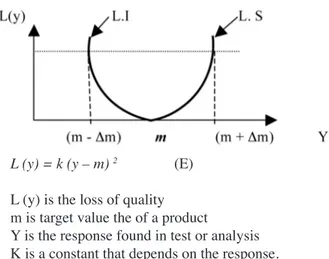
From the results of mixtures (planning matrix) and of the regression models, it is possible to select the best mixture using the technique of function loss developed by Taguchi [12, 13], reconciling conlicts of responses from types “larger is better” and “smaller is better”, seeking always responses for the closest target value m (desired quality). The loss function represents the loss of quality of a product, every time responses (properties) get farther from their value target. To express this function loss, Taguchi developed the quadratic form:
Fig. 1 represents this function. Note that as the quality of the product is away from the target value m, the loss of quality increases.
This work describes the use of the design of mixture experiments to calculate initially, a regression model relating bending strength, water absorption and linear iring shrinkage of ceramic bodies, with the proportions (wt.%) of talc, quartz, calcareous, phyllite, dolomite and clay present, under constant processing conditions (wet grinding, moisture content, compaction pressure, iring schedule). The resulting statistical analysis involves itting of mathematical equations to the experimental results.
An examined technique through the mathematical Figure 1: Graphical representation of the function loss of quality.
[Figura 1: Representação gráica da função perda de qualidade.] L (y) = k (y – m) 2 (E)
L (y) is the loss of quality m is target value the of a product
Y is the response found in test or analysis
expressions called loss function was developed to allow selecting the best mixture among several of planning matrix. That criterion takes in consideration the types of characteristics of wanted qualities, respecting the properties of the types “larger is better” and “smaller is better”, for instance: bending strength (larger is better) and water absorption (smaller is better).
EXPERIMENTAL PROCEDURE
The raw materials used as reference in a local industry were: 10 wt.% talc, 4 wt.% quartz, 3 wt.% calcareous, 14 wt.% phyllite, 5 wt.% dolomite and 64 wt.% clay.
A modiied {6, 2} simplex-lattice was used to deine the matrix planning of 21 elaborated masses for mixtures of these raw materials that should be investigated, according to the equation C.
The selected mixtures were wet processed, following the conventional wall and loor tile industrial procedure: wet grinding for 2 h in a rotating cylindrical ball mill type, with capacity for grinding of 5 kg, using porcelain spheres, drying, moisturizing (6 ± 0.5 wt.%, dry basis), granulation (200 mesh) and uniaxial pressing (50 MPa). For each mixture, six lat specimens (150 x 65 x 8 mm3) were produced, using 120 g
of material for each specimen. An automatic hydraulic press was used with capacity of 100 ton and applied a compaction pressure of 50 MPa. After compaction, the test specimens were oven dried type of rolls type of rolls at 110 ± 5 ºC until constant
weight, and cooled to ambient temperature. These processing conditions were the same ones adopted by the industry.
The mechanical strength of dried specimens was determined in three-point bending tests, using a test machine with 10 kN capacity.
The linear shrinkage was calculated from the change in length (measured with Mitutoyo callipers with a resolution of 0.05 mm), upon iring, of the lat test pieces.
Water absorption was determined via boiling in water for 2 h, in a digital scale, resolution 0.01g.
All these tests were conducted in accordance with the Brazilian standard ABNT 13818 [14], and for each mixture, the test result was taken as the average of the six specimens, affected by the corresponding standard deviation. Those values were then used to iteratively calculate the coeficients of a regression equation such as eqs. B and C, until a statistically relevant model and response surface was obtained, relating the mechanical strength, iring shrinkage and water absorption with the weight fractions of talc, quartz, calcareous, phyllite, dolomite and clay present in the mixtures.
RESULTS AND DISCUSSION
The simplex lattice mixture composition
The distinctive roles that talc, quartz, calcareous, phyllite, dolomite and clay play during ceramic processing were used to establish the lower bound limits of 8.0 wt.% of talc, 3.0
A: True formulation (wt.%) B: Pseudo-components
Raw à
material X1 X2 X3 X4 X5 X6 Total X1 X2 X3 X4 X5 X6 Total
M1 18 3 3 12 4 60 100 1 0 0 0 0 0 1
M2 8 13 3 12 4 60 100 0 1 0 0 0 0 1
M3 8 3 13 12 4 60 100 0 0 1 0 0 0 1
M4 8 3 3 22 4 60 100 0 0 0 1 0 0 1
M5 8 3 3 12 14 60 100 0 0 0 0 1 0 1
M6 8 3 3 12 4 70 100 0 0 0 0 0 1 1
M7 13 8 3 12 4 60 100 .5 .5 0 0 0 0 1
M8 13 3 8 12 4 60 100 .5 0 .5 0 0 0 1
M9 13 3 3 17 4 60 100 .5 0 0 .5 0 0 1
M10 13 3 3 12 9 60 100 .5 0 0 0 .5 0 1
M11 13 3 3 12 4 65 100 .5 0 0 0 0 .5 1
M12 8 8 8 12 4 60 100 0 .5 .5 0 0 0 1
M13 8 8 3 17 4 60 100 0 .5 0 .5 0 0 1
M14 8 8 3 12 9 60 100 0 .5 0 0 5 0 1
M15 8 8 3 12 4 65 100 0 5 0 0 0 5 1
M16 8 3 8 17 4 60 100 0 0 .5 .5 0 0 1
M17 8 3 8 12 9 60 100 0 0 .5 0 .5 0 1
M18 8 3 8 12 4 65 100 0 0 .5 0 0 .5 1
M19 8 3 3 17 9 60 100 0 0 0 .5 .5 0 1
M20 8 3 3 17 4 65 100 0 0 0 .5 0 .5 1
M21 8 3 3 12 9 65 100 0 0 0 0 .5 .5 1
RM 10 4 3 14 5 64 100 .2 .1 0 .2 .1 .4 1
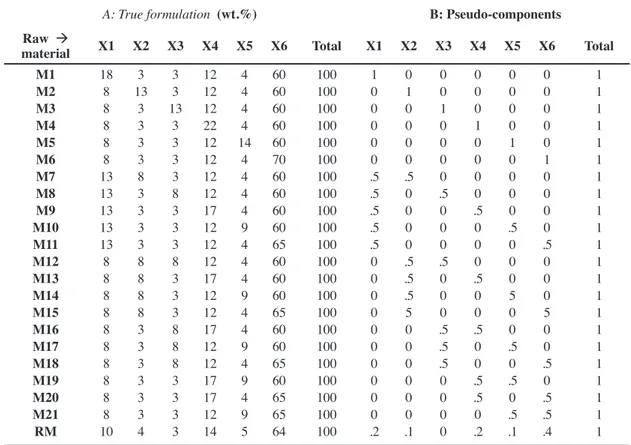
wt.% of quartz, 3.0 wt% of calcareous, 12.0 wt.% of phyllite, 4.0 wt.% of dolomite and 60.0 wt.% of clay. These lower limits were determined by evaluating also, the percentage used around of the mixture used in local industry for the production of tiles, here called RM reference mixture (Table I).
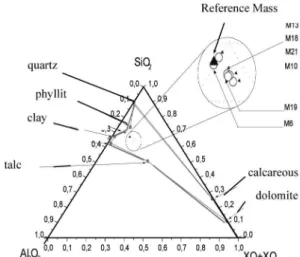
By considering the oxides that more inluence in the formulation of a ceramic are the alumina, silica, alkali and alkaline earth [13] according to the chemical composition of raw materials above, the ternary diagram of raw materials that make up the tiles may be represented by these oxides. These limits create a restricted composition area of pseudo-components (Fig. 1) on which a {6, 2} simplex lattice was set. It visualizes, therefore in igure, an area bounded by location of raw materials, and any point within this area can be used for the development of the project of experiment.
Table I shows the matrix planning with the 21 elaborated mixtures (Mi), independent components, and the reference mass RM, in terms of true formulations (A) and in pseudo components (B), where: X1: talc, X2: quartz, X3: calcareous, X4: phyllit, X5: dolomite, X6: clay.
Fig. 2 shows the ternary system SiO2 / Al2 O3 / XO+X2O. All mixtures of these raw materials must lie within the triangle they deine. Hence, only a part of the composition area will be used.
The models for responses
Table II shows the properties (response) obtained for the selected 21 mixtures.
Having a measured value for the response property at
Figure 2: The ternary system SiO2 / Al2 O3 / XO+X2O, showing the
raw materials area, the restricted pseudo-components.
[Figura 2: Sistema ternário SiO2 / Al2 O3 / XO+X2O, mostrando a área de matérias-primas, a restrição em pseudo-componentes.]
speciic coordinates, a regression equation can be sought for each property. Regression models were evaluated, eq. C: second degree polynomial, subjected to a signiicance level of 5%.
Table III shows the individual modeling of the response for the quadratic model, where the determination coeficients R2 evaluate if the equations obtained by regressions are
representative. The effects of the interactions between raw materials are noticed.
Those equations show, for instance, that the quartz associated to the calcareous reduces the linear shrinkage
Table II - Average values of the responses and corresponding standard deviations. [Tabela II - Valores médios das respostas e desvios padrão correspondentes).]
Mixture Linear shrinkage (%) Mechanical strength (Mpa) Water absorption(%)
M1 M2 M3 M4 M5 M6 M7 M8 M9 M10 M11 M12 M13 M14 M15 M16 M17 M18 M19 M20 M21 MR
3.22 ± 0.01 2.34 ± 0.09 0.97 ± 0.01 3.20 ± 0.18 1.39 ± 0.18 2.99 ± 0.14 2.87 ± 0.08 1.72 ± 0.03 3.20 ± 0.22 2.10 ± 0.10 3.15 ± 0.15 1.26 ± 0.05 2.37 ± 0.04 1.61 ± 0.08 2.84 ± 0.06 1.67 ± 0.12 1.65 ± 0.36 1.64 ± 0.07 1.78 ± 0.13 3.48 ± 0.18 2.37 ± 0.03 2.74 ± 0.08
15. 14 ± 1.5 14.49 ± 1.1 12.53± 0.4 16.0 ± 1.6 11.5 ± 0.7
16.1 ± 0.9 13.1 ± 0.9 15.1 ± 2.5 18.6 ± 2.0 16.1 ± 1.0 17.7 ± 1.1 9.4 ± 1.0 16.0 ± 1.5 13.9 ± 1.7 14.9 ± 1.2 16.2 ± 0.7 14.8 ± 0.7 17.0 ± 0.8 16.6 ± 0.4 18.9 ± 0.1 18.4 ± 0.8 17.2 ± 0.8
and the bending strength simultaneously (-1.92 X2X3 and -16.9X2X3). In the production line, the minimum of linear shrinkage (smaller is better) is important, but with the increase of the bending strength (larger is better). Having conlict is necessary, therefore, to ind a conciliatory solution. The simultaneous study that leads the optimization of the response of interest is needed and will be the following subject. Here, X1 is the talc fraction, X2 is the quartz fraction, X3 is the calcareous fraction, X4 is the phillit fraction, X5 is the dolomite fraction and X6 is the clay fraction (i.e. independent component fraction).
Variance analysis
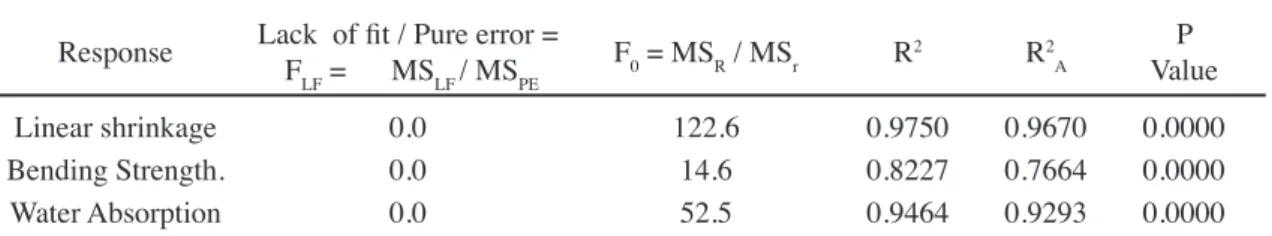
Table IV gives the various statistical properties of the regressions, using the nomenclature commonly found in the relevant texts [1, 2]. Using the P-value approach to hypothesis testing (i.e. P-value 5 signiicance level), this table shows that the second degree model is statistically signiicant for three responses, because P = 0.00000 < 0.05. The coeficients of multiple determinations R2 for the
responses linear shrinkage and water absorption are 0.97 and 0.94 respectively, meaning that the models present a
very small variability. The R2 for the response bending
strength is 0.83, meaning that the model present a small variability. Low values of FLF mean adjustment of the
model.
Optimization of the mixture ceramic - The function loss of quality
The concept of the loss of quality developed by Taguchi [12, 13] will be adapted to the present study to select the best mixture of the Table I, taking in consideration the best responses (linear shrinkage, bending strength, water absorption) and at the same time reconciling existing conlicts like: larger is better (example bending strength) and the smaller is better (example: linear shrinkage).
Fig. 3 compares two responses Y1, Y2, -(W) - inside the
range of LS = upper limit (which in this case is the worst response, because the target value is: the smaller is better), and LI = lower limit, response that would be ideal (smaller is better, i.e.; target value). YMR is the response of the ceramic bodies manufactured in a local industry, used as reference mixture in this work. It tries to ind an expression that represents the sum of the losses of found response.
Response (Yi) R2 quadratic model
Linear shrinkage.
(Y1) 0,97
Y1 =3.26X1 + 2.42X2 + 1.1X3 + 3.23 X4 + 1.48X5 + 3.07X6
– 1.79X1X3 –1.03X1X5 – 1.92X2 X3 –1.88X2 X4 – 1.42X2 X4 –
2.32X3X4 + 2.01X1 X3 X5 –1.87X3 X6 – 2.48X4 X5 + 1.16X4 X6.
Bending Strength.
(Y2) 0,76
Y2=14.7X1 +13.6X2 + 13.5X3 + 16.7X4 + 11.6X 5 + 16.5X6 +
14.2X1 X4 + 10.1X1X5 + 11.6X1X6 – 16.9X2 X 3 + 11.4X3X5 +
9.6X4 X5 + 9.6X4 X6 + 11.9X5 X 6.
Water Absorption
(Y3) 0,94
Y3=13.12X1 + 17.35X2 + 20.65X3 + 15.85X4 + 22.27X5 + 15.5X6
- – 5.15X1X2 –4.0X1X5 + 6.6X2X3 –3.9X2X4 – 13.65X 2X5 –
7.2X 2X6 – 10.75X4X5 – 5.20X4X6.
Table III - Regression models obtained for the responses Yi. [Tabela III - Modelos de regressão obtidos para as respostas Yi.]
Response Lack of it / Pure error = F
LF = MSLF / MSPE F0 = MSR / MSr R
2 R2
A ValueP
Linear shrinkage 0.0 122.6 0.9750 0.9670 0.0000
Bending Strength. 0.0 14.6 0.8227 0.7664 0.0000
Water Absorption 0.0 52.5 0.9464 0.9293 0.0000
aMS
LF: quadratic average of adjustment lack; MSPE: quadratic average of pure error; MSR: quadratic average of the model; MSr: quadratic average of the residues. R2: coeficient of multiple determinations. R2: adjusted R2.
[bMS
LF: Média quadrática de falta de ajuste; MSPE: Média quadrática de erro puro; MSR: Média quadrática do modelo; MSr: Média quadrática dos resíduos. R2: coeiciente de determinação múltipla. R2
A : ajustado R2.] Table IV - Statistical properties relevant for variance analysisa.
(Target =SL, the target is the superior limit)
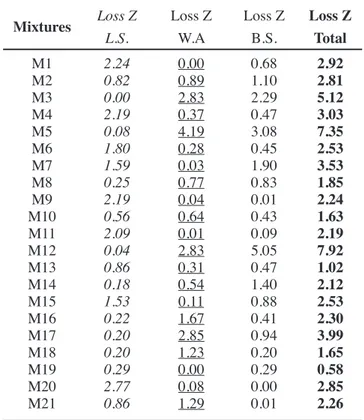
Table V shows the results of the loss of quality of the masses, using equations ( B ) and (C ).
L.S.: Linear Shrinkage W.A.: Water Absorption B.S.: Bending Strength.
Larger losses, in growing order:
M19 < M13 < M10 < M18..., (0,58) < (1,02) < (1,63) < (1,65) ……, M19 is the best mass (smaller loss = 0, 58).
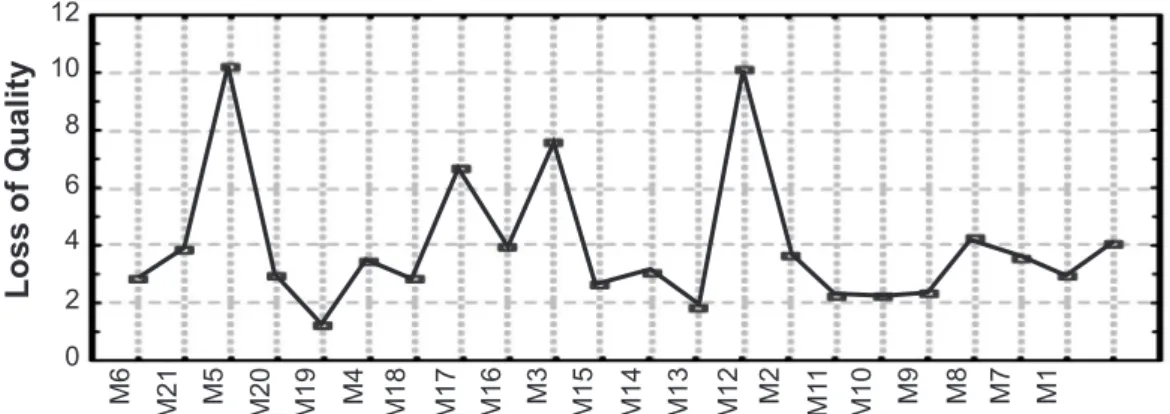
Fig. 5 shows the behavior of the masses in function to the quality losses.
The model of optimization of the loss of quality can be found in function of the independent variables Xi, because, Y=F(X) and Z=F(Y) à Z=F(X). The following expression represents the loss model Z(i) in function of the raw materials. In absolute terms, one can see that the dolomite is the raw material that most contributes with the loss of quality of the masses (10.16 X5), and the clay tends to minimize the quality losses (2,82 X6). In relative terms, phyllite and dolomite minimize the quality loss (–22.26X4X5):
Z(I) = 2.92X1 + 3.66X2 + 7.53X3 +3.41X4 + 10.16X5 + 2.82X6 + 1.08X1X2 – 3.9X1X3 – 3.54X1X4 – 17.44X1X5 – 2.72 X1X6 + 18.02X2X3 – 6.82X2X4 – 15.56X2X5 – 2.48X2X6 – 6.16X3X4 – 8.58X3X5 – 9.54X3X6 – 22.26X4X5 – 0.66X4X6.
Table VI shows comparative data among the best It is observed that Y1 > Y2, whose situation is more
favorable for Y2 (smaller is better), and (Y1 – IL) > (Y2 –IL), what implicates in a larger loss for Y1 (worst response).
Equation (B) represents the evolution in the calculation of quality losses for ceramic mixtures starting from the discussion done based on Fig. 3.
j
Ž(I) = ∑ [1 / (SL – IL)2 . [(Y
J – ILJ)2]] (B) j=1
For the cases of the type “larger is better” (example: bending strength), Fig. 4 shows the behavior of two responses (Y) showing that the smallest losses happen when the largest response is obtained.
It is observed that Y1 > Y2, whose situation is more
favorable for Y1(larger is better), and [SL - Y1] < [SL - Y2] implicates in a larger loss for Y2.
In a similar way to the development of equation C, the equation of the loss function in that situation (Fig. 4) is:
j
Ž(I) =∑ [1 / (SL – IL)2 . [(SL – Y
J)2]] (C) j=1
Mixtures Loss ZL.S. Loss ZW.A Loss ZB.S. Loss ZTotal
M1 2.24 0.00 0.68 2.92
M2 0.82 0.89 1.10 2.81
M3 0.00 2.83 2.29 5.12
M4 2.19 0.37 0.47 3.03
M5 0.08 4.19 3.08 7.35
M6 1.80 0.28 0.45 2.53
M7 1.59 0.03 1.90 3.53
M8 0.25 0.77 0.83 1.85
M9 2.19 0.04 0.01 2.24
M10 0.56 0.64 0.43 1.63
M11 2.09 0.01 0.09 2.19
M12 0.04 2.83 5.05 7.92
M13 0.86 0.31 0.47 1.02
M14 0.18 0.54 1.40 2.12
M15 1.53 0.11 0.88 2.53
M16 0.22 1.67 0.41 2.30
M17 0.20 2.85 0.94 3.99
M18 0.20 1.23 0.20 1.65
M19 0.29 0.00 0.29 0.58
M20 2.77 0.08 0.00 2.85
M21 0.86 1.29 0.01 2.26
Table V - Summary of the losses of quality of the mixtures.
[Tabela V - Resumo das perdas de qualidades das misturas.]
Figure 4: Behavior of the graph for response of the type “larger is better”.
[Figura 4: Comportamento do gráico para respostas do tipo “maior é melhor”.]
SL - target
YMR - reference Figure 3: Behavior for response of the type “smaller is better = target value”.
[Figura 3: Comportamento das respostas do tipo “menor é melhor = valor alvo”.]
IL = Inferior Limits = target: it is the value that would be ideal, (smaller is better)
SL = Superior Limits, it is the worst found response, (when smaller is better)
Figure 5: Behavior of the losses of quality of the mixtures.
[Figura 5: Comportamento das perdas de qualidade das misturas.]
mixture selected between those elaborated at the planning matrix, through the function loss (M19); and the mixture manufactured in the industry (RM).
The mixture M19 had presented a linear shrinkage around 50% smaller than the reference mixture RM, without major changes in the bending strength and water absorption. In terms of composition of the raw materials, that mass is characterized by a major percentile of phyllite and dolomite, compared with the reference mixture RM.
CONCLUSION
The design of mixture experiments enabled the calculation of regression models relating bending strength, linear iring shrinkage and water absorption with composition, which can then be used to select the best combination of six given raw materials (talc, quartz, calcareous, phyllit, dolomite and clay) to produce, under constant processing conditions, a ceramic body with speciied properties. Furthermore, the equations loss of quality, developed in this work, allow for the selection of the best mixture among the several ones that are part of the planning matrix, with optimized responses, reconciling conlicts of responses from types “larger is better” and “smaller is better”.
12 10 8
6 4
2 0
Lo
ss
o
f Q
ua
lity
M2
1
M5 M20 M19 M4 8M1 7M1 M16 M3 M15 4M1 M13 2M1 M2 M11 M10 M9 M8 M7 M1
M6
REFERENCES
[1] R. H. Myers, D. C. Montgomery, Response Surface Methodology: Process and Product Optimization Using Designed Experiments, John Wiley & Sons, New York, USA (2002).
[2] J. A. Cornell, Experiments with Mixtures: Designs, Models and the Analysis of Mixture Data, 3rd Ed., John
Wiley and Sons, New York, USA (2002).
[3] S. L. Correia, D. Hotza, A. M. Segadães, “Simultaneous optimization of linear iring shrinkage and water absorption of triaxial ceramic bodies using experiments design”, Ceram. Int. 30, 6 (2004) 917-922.
[4] L. B. Hare, Mixture designs applied to food formulation, Food Technol. 28 (1974) 50–62.
[5] S. L. Hung, T. C. Wen, A. Gopalan, “Application of statistical strategies to optimize the conductivity of electrosynthesized polypyrrole”, Mater. Lett. 55 (2002) 165-170.
[6] S. L. Correia, K. A. S. Curto, D. Hotza, A. M. Segadães, “Using statistical techniques to model the lexural strength of dried triaxial ceramic bodies”, J. Eur. Ceram. Soc. 24, 9 (2004) 2813-2818.
[7] L. A. Chick, G. Piepel, “Statistically designed optimization of a glass composition”, J. Am. Ceram. Table VI - Comparison of the best mixture M19, in relation to the reference mixture RM.
[Tabela VI - Comparação da melhor mistura M19 em relação à mistura de referência RM.]
A : Formulation (%wt) B: codiied Levels L. S B.S W.A.
% kgf
cm2 %
Mixture
↓ X1 X2 X3 X4 X5 X6 X1 X2 X3 X4 X5 X6
RM 10 4 3 14 5 64 0.2 0.1 0.0 0.2 0.1 0.4 2.7 172 14.7
M19 8 3 3 17 9 60 0 0 0 0.5 0.5 0 1.8 166 16.4
Soc. 67 (1984) 763-768.
[8] L. M. Schabbach, A. P. N. Oliveira, M. C. Fredel, D. Hotza, “Seven-component lead-free frit formulation”, Am. Ceram. Soc. Bull. 82 (2003) 47-50.
[9] S. L. Correia, A. P. N. Novaes, D. Hotza, A. M. Segadães “Properties of triaxial porcelain bodies: interpretation of statistical modeling”, J. Am. Ceram. Soc. 89, 11 (2006) 3356-3365.
[10] S. L. Correia, D. Hotza, A. M. Segadães, “Effect of raw materials on linear shrinkage”, Am. Ceram. Soc. Bull. 83, 8 (2004) 9101-9108.
[11] S. L. Correia, D. Hotza, A. M. Segadães, “Application of mathematical and statistical strategies to optimize
ceramic bodies: effects of raw materials on the technological properties”, Ceram. Forum Int. 82, 1-2 (2005) E39-E43. [12] F. M. Neto, “Taguchi and Quality Improvement. A critical reading”, Ed. UFSC, Florianópolis, SC, Brazil (1997).
[13] S. W. Ali, Statistical Process Control for Total Quality, vol. 13, John Hopkins APL Technical Digest (1992). [14] ABNT - Brazilian Association for Technical Standards, NBR 13818, Annex C: Ceramic Tiles-Speciications and Test Methods (1997) 14-16 (in Portuguese: Placas Cerâmicas para Revestimento, Especiicação e Métodos de Ensaios).
Ano LVI - Vol 56, 340, OUT/NOV/DEZ 2010 - ISSN-0366-6913 Adaptação de um equipamento para ensaios de desgaste de materiais cerâmicos
(Experimental setup for wear testing of ceramic materials)
R. F. de L. Lorenzi, C. A. Perottoni, J. E. Zorzi ... 315
Aplicação da ferramenta SWOT para avaliação das técnicas de dano ao choque térmico em materiais refratários
(SWOT as a tool to evaluate the thermal shock damage technique of refractory materials)
L. R. G. Gonçalves, G. B. Cintra, B. H. Teider, J. B. Gallo, V. C. Pandolfelli ... 320
Agentes ligantes e seus efeitos em concretos refratários alumina-magnésia
(Binders and their effects on alumina-magnesia refratory castables)
M. A. L. Braulio, D. H. Milanez, E. Y. Sako, L. R. M. Bittencourt, V. C. Pandolfelli ... 325
Efeitos do carbono na evolução de segundas-fases e na densiicação do nitreto de alumínio com Y2O3
(Effects of carbon on second-phase evolution and densiication of aluminum nitride with Y2O3)
A. L. Molisani, H. Goldenstein, H. N. Yoshimura ... 331
Síntese de zeólita tipo NaA a partir de caulim para obtenção de zeólita 5A através de troca iônica
(Synthesis of NaA zeolites from kaolin for obtaining 5A zeolites through ion exchange)
C. R. Melo, H. G. Riella ... 340
Technique for optimization of ceramic bodies using mixture design
(Técnica para otimização de corpos cerâmicos usando projeto de misturas)
J. Silveira, J. P. Leite ... 347
O uso de técnica eletroquímica para a descontaminação de estruturas cerâmicas vítreas porosas
(The use of electrochemical technique for porous vitreous ceramic structure decontamination)
O. B. G. Assis, E. R. Silva ... 355
Caracterização dos argilominerais usados em matéria-prima cerâmica, da formação Rio do Rasto, Bacia do Paraná, no município de Turvo, SC
(Characterization of clay minerals used in the ceramic industry, from Rio do Rasto formation, Paraná basin, exploitation in Turvo, SC, Brazil)
J. A. Costa, A. S. Mexias, M. E. B. Gomes ... 360
Mulitização em refratários utilizando diferentes fontes precursoras - revisão
(Refractories mullitization with different sources of reactants - review)
M. V. M. Magliano, V. C. Pandolfelli ... 368
Avaliação da estabilidade térmica de sais quaternários de amônio para uso em argilas organofílicas nacionais - Parte I
(Evaluation of thermal stability of quaternary ammonium salts for use in national organoclays - Part I)
R. Barbosa, D. D. Souza,E. M. Araújo, T. J. A. Mélo ... 376
Uso de novos materiais para o capeamento pulpar (hidroxiapatita - HAp e fosfato tricálcico - β-TCP)
(The use of new materials for pulp capping (hydroxyapatite – HAp and tricalcium phosphate - β-TCP))
C. S. Delino, C. Ribeiro, G. F. Vieira, A. H. A. Bressiani, M. L. Turbino ... 381
Fabricação de blocos cerâmicos de vedação pela incorporação com lodo de lavanderia industrial (Production of ceramic sealing blocks with incorporation of sludge from industrial laundry)
L. C. S. Herek, R. Bergamasco, C. R. G. Tavares ... 389
Efeito da modiicação da composição química na sinterização e microestrutura de porcelanas de ossos bovinos
(Effect of chemical composition modiication on sinterability and microstructure of bone china)
D. Gouvêa, S. Hirakata, H. Kahn ... 393
Incorporação de cinza de lenha, lodo de estação de tratamento de água e cinza de casca de arroz em massa cerâmica. Utilização da técnica de planejamento
(Grog incorporation in ceramic mass to manufacture of bricks. A study of the physical-mechanical properties)
E. N. M de Medeiros, R. M. Sposto, G. de A. Neves, R. R. Menezes ... 399
Compósito cimentício reforçado com ibras de carbono para recuperação de monumentos históricos
(Cementicious composites made with steatite residue reinforced with carbon iber)
T. H. Panzera, K. Strecker, J. S. Miranda, F. C. Paiva, P. H. R. Borges ... 405
The effect of microsilica and refractory cement content on the properties of andalusite based Low Cement Castables used in aluminum casthouse
(O efeito do teor de microsílica e de cimento refratário nas propriedades de LCCs usados em moldagem de alumínio)