*e-mail: [email protected]
Porosity Dependence of Elastic Constants in Aluminum Nitride Ceramics
Humberto Naoyuki Yoshimuraa*, André Luiz Molisania, Nilson Eiji Naritaa, Paulo Francisco Cesarb, Hélio Goldensteinb
a
Instituto de Pesquisas Tecnológicas do Estado de São Paulo, Av. Prof. Almeida Prado, 532,
05508-901 São Paulo - SP, Brazil
b
Universidade de São Paulo, Av. Prof. Mello Moraes, 2463, 05508-900, São Paulo - SP, Brazil
Received: August 22, 2006; Revised: March 28, 2007
Aluminum nitride is a relatively new engineering ceramic and its mechanical properties have not been extensively studied. In this work, the effects of porosity (~0 to 38%) on sonic velocities, Poisson’s ratio, and elastic moduli of partially sintered AlN, both pure and with additives, were investigated. The elastic constants, determined by the ultrasonic pulse-echo method, were significantly influenced by the porosity, but not by the different types of additives used (2 wt. (%) of CaCO3, CaO, and Y2O3). All elastic constants evaluated decreased with increasing porosity, but the rates of decrease were higher for elastic moduli compared do sonic velocities and Poisson’s ratio. The results were analyzed in the light of stress concentration and loading bearing area models proposed in the literature.
Keywords: aluminum nitride, porous material, elastic behavior, sintering
1. Introduction
Aluminum nitride (AlN) ceramic is a potential candidate material for microelectronic substrates because of its high thermal conductiv-ity. Good mechanical properties also make it a potential candidate for use as a structural material for use in heat sinks, ballistic armors, and other applications1,2. AlN can be pressureless sintered with the aid of
additives, such as Y2O3 and CaO, which react with the alumina layer on the surface of the AlN particles, forming aluminates that promote densification by liquid-phase sintering3-5. Although there are many
works related to the sintering behavior and thermal conductivity of AlN ceramics, there are few works concerning to the mechanical behavior of these materials.
The effect of porosity on mechanical properties of ceramic ma-terials has been studied since 1950. Understanding this relationship is important because these materials are mainly produced by powder technology routes and usually have a fraction of involuntary residual porosity, a characteristic which degrades mechanical properties. Moreover, the production of new and reliable porous materials for catalytic supports and filters6 depends on the optimization of
mechani-cal properties. Even though many models have been proposed in the literature to predict the effect of porosity on mechanical properties, the reasons for this phenomenon are not completely clear. Therefore, it is important to fit the different models to the experimental data so that their predictability can be verified.
The models can be classified in two groups: models based on geometry (or loading bearing area); and models based on micro-mechanisms of stress concentration around the pores7,8. Some of
these models are shown in Table 1. Equations 1 to 8 represent the empirical or semi-analytical models based on the loading area. The interpretation of the fits is based on the geometry of pores or solid particles. Some models based on the “effective” area fraction of load-ing, namely minimum solid area (MSA)7,14, have been proposed with
different geometries of pores and solid particles. Equations 9 to 15 (Table 1) represent the analytical models based on stress concentra-tion. Equations 9 to 12 and 15 are proposed for limited concentrations of spherical pores and Equations 13 and 14 for limited concentration
of aligned cylindrical pores, with the direction of loading parallel or perpendicular to the direction of the cylindrical pore axis, respectively. Detailed descriptions of the models can be found elsewhere8-13. There
are other models, such as the numerical model proposed by Chao and Huang, which predicts the elastic moduli of foamed (cellular) materials, taking into account the effect of pore aspect ratio using an Eshelby tensor15.
The effect of porosity on elastic constants has been extensively studied for many oxide ceramics8-14,16,17 and some covalent
ceram-ics8,14,18, but there are few works on AlN. In this work, pure and
doped AlN ceramics with pore content ranging from 0 to ~40% were prepared by sintering in order to evaluate the effect of porosity on the elastic constants of these materials.
2. Experimental
AlN powder (H.C. Stark, Germany, Grade C, 1.06 µm, 1.63 wt. (%) O), reagent grade CaCO3 (Anidrol, Brazil, 5.6 µm), cal-cined CaO powder (5.3 µm), and Y2O3 powder (H.C. Stark, Grade C, 0.7 µm) were used as raw materials. Pure AlN and mixtures of AlN with 2 wt. (%) of each additive were ball milled in a plastic jar for 24 hours, using isopropyl alcohol to avoid oxygen contamination. Following the addition of a binder (2% polyethylene glycol), the mixtures were dried in a rotoevaporator. The powders were uniaxially pressed at 10 MPa in a 15 mm diameter cylindrical die and then CIPed at 150 MPa in order to form disk-shaped green specimens with a thickness of 5 mm. Three specimens were prepared for each test condition. Green specimens were sintered in a tungsten heated furnace (Nems, NM-15, Japan) at 1600, 1700, and 1750 °C for 7 to 480 minutes under a flowing high purity nitrogen gas. During the heating stage, samples were held at 500 °C for 0.5 hours to burn out the binder. The heating and cooling rates were 10 and 30 °C/minutes, respectively.
from the ratio of measured density and theoretical density, which was calculated by rule of mixture assuming the densities of AlN, CaO, and Y2O3 to be 3.261, 3.315, and 5.015 g.cm-3, respectively19.
Microstructural analysis was performed in a scanning electron micro-scope (SEM, Jeol, Japan, JSM 6300) coupled with energy dispersive spectroscopy (EDS, Noram, USA).
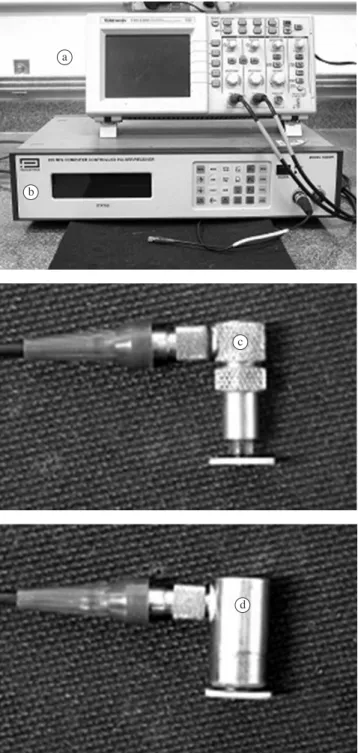
Elastic constants were determined by the ultrasonic pulse-echo method (Figure 1) using a 200 MHz ultrasonic pulser-receiver (Pana-metrics, USA, 5900 PR), 20 MHz longitudinal and shear transducers with a delay material, and a coupling paste (Panametrics) applied between the sample and transducer13. The time of flight of ultrasonic
pulse was measured with an oscilloscope (Tektronix, China, TDS 1002) and the thickness of the sample was measured with a digital micrometer (Mitutoyo, Brazil). Sonic velocities were calculated as two times the thickness divided by the time of flight, since in the pulse-echo method, only one transducer (longitudinal or shear mode) is used to emit and to capture the back-reflected wave. The Poisson’s ratio (ν), Young’s (E), shear (G), and bulk (K) modulus were calculated applying the measured bulk density (ρ), longitudinal velocity (VL), and shear velocity (VT) in the following equations20:
.
0 5 2
V V
V V
2 2
2 2
L T
L T
$ $
o=
-- (16)
3 4
E
V V
V V V
2 2
2 2 4
L T
T L T
$ $ $ $
t
=
-d n (17)
G = ρ.VT2 (18)
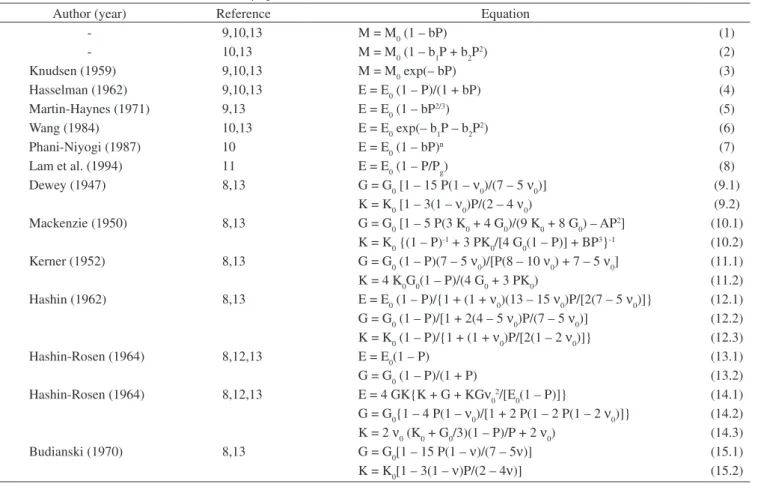
Table 1. Semi-analytical (1 to 8) and analytical (9 to 15) equations for elastic constants as a function of volume fraction porosity P8-13. M is an elastic property and E, G, K, and ν are Young’s, shear, and bulk modulus, and Poisson’s ratio, respectively. The subscripts 0 and g indicate the property of the material without
pore and green body, respectively. The values of b, b1, b2, and n of Equations 1 to 7 are determined by fitting to the experimental results.
Author (year) Reference Equation
- 9,10,13 M = M0 (1 – bP) (1)
- 10,13 M = M0 (1 – b1P + b2P2) (2)
Knudsen (1959) 9,10,13 M = M0 exp(– bP) (3)
Hasselman (1962) 9,10,13 E = E0 (1 – P)/(1 + bP) (4)
Martin-Haynes (1971) 9,13 E = E0 (1 – bP2/3) (5)
Wang (1984) 10,13 E = E0 exp(– b1P – b2P2) (6)
Phani-Niyogi (1987) 10 E = E0 (1 – bP)n (7)
Lam et al. (1994) 11 E = E0 (1 – P/Pg) (8)
Dewey (1947) 8,13 G = G0 [1 – 15 P(1 – ν0)/(7 – 5 ν0)] (9.1)
K = K0 [1 – 3(1 – ν0)P/(2 – 4 ν0) (9.2)
Mackenzie (1950) 8,13 G = G0 [1 – 5 P(3 K0 + 4 G0)/(9 K0 + 8 G0) – AP2] (10.1)
K = K0 {(1 – P)-1 + 3 PK
0/[4 G0(1 – P)] + BP
3}-1 (10.2)
Kerner (1952) 8,13 G = G0 (1 – P)(7 – 5 ν0)/[P(8 – 10 ν0) + 7 – 5 ν0] (11.1)
K = 4 K0G0(1 – P)/(4 G0 + 3 PK0) (11.2)
Hashin (1962) 8,13 E = E0 (1 – P)/{1 + (1 + ν0)(13 – 15 ν0)P/[2(7 – 5 ν0)]} (12.1)
G = G0 (1 – P)/[1 + 2(4 – 5 ν0)P/(7 – 5 ν0)] (12.2)
K = K0 (1 – P)/{1 + (1 + ν0)P/[2(1 – 2 ν0)]} (12.3)
Hashin-Rosen (1964) 8,12,13 E = E0(1 – P) (13.1)
G = G0 (1 – P)/(1 + P) (13.2)
Hashin-Rosen (1964) 8,12,13 E = 4 GK{K + G + KGν02/[E
0(1 – P)]} (14.1)
G = G0{1 – 4 P(1 – ν0)/[1 + 2 P(1 – 2 P(1 – 2 ν0)]} (14.2)
K = 2 ν0 (K0 + G0/3)(1 – P)/P + 2 ν0) (14.3)
Budianski (1970) 8,13 G = G0[1 – 15 P(1 – ν)/(7 – 5ν)] (15.1)
K = K0[1 – 3(1 – ν)P/(2 – 4ν)] (15.2)
3 3 4
K V2 V2
L T
$ $ $
t
= ^ - h (19)
3. Results and Discussion
The experimental results were plotted without the error bars, since the standard deviations were relatively small. The order of magnitude of the standard deviation can be inferred from the coefficients of variation shown in Table 2 for all measured properties.
The green densities of all samples were ~60% of the theoretical densities. Porosity decreased with the increase in sintering tempera-ture and time, and the densification of pure AlN sample was slower than the AlN samples with additive (CaO, CaCO3, and Y2O3), as ex-pected (Figures 2a and 2b). Samples with additive achieved almost full density at 1750 °C. The elastic constants increased with the increase in sintering temperature and time (Figures 2c and 2d), indicating an inverse relationship between these constants and porosity.
Table 2. Coefficient of variation of the measured bulk density (ρ), volume
fraction porosity (P), longitudinal (VL) and shear (VT) velocity, Poisson’s ratio
(ν), Young’s (E), shear (G), and bulk (K) modulus.
ρ P VL VT ν E G K
0.3% 1.6% 0.6% 0.6% 2.7% 1.2% 1.4% 1.8%
a
b
c
d
Figure 1. Images of a) oscilloscope, b) ultrasonic pulser-receiver, c) longitudinal wave transducer, and d) shear wave transducer used to measure sonic velocities. In c,d), a disk-shaped specimen in contact with the transducer is also shown.
Figure 2. Porosity as a function of a) sintering temperature (3 hours) and b) sintering time (1600 °C), and Young’s modulus as a function of c) sintering temperature (3 hours) and d) sintering time (1600 °C).
10 100 1000
0 50 100 150 200
Isothermal at 1600 °C
E (GP
a)
Sintering time (min) (d) Pure AlN
2% CaCO3 2% CaO 2% Y2O3
1600 1650 1700 1750 0.0
0.1 0.2 0.3 0.4 0.5
V
olume fraction of pores
Sintering temperature (°C) Pure AlN 2% CaCO3 2% CaO 2% Y2O3
(a)
Pure AlN 2% CaCO3 2% CaO 2% Y2O3
(b)
10 100 1000
0.0 0.1 0.2 0.3 0.4 0.5
V
olume fraction of pores
Sintering time (min)
Isothermal at 1600 °C
Pure AlN 2% CaCO3 2% CaO 2% Y2O3
(c)
1600 1650 1700 1750 0
50 100 150 200 250 300 350
E (GP
a)
Sintering temperature (°C)
in Figure 3c). At this temperature, the densification of the sample with added Y2O3 seemed to be dominated by the SSS process. This result is in accordance with the work of Molisani et al.4, which observed that
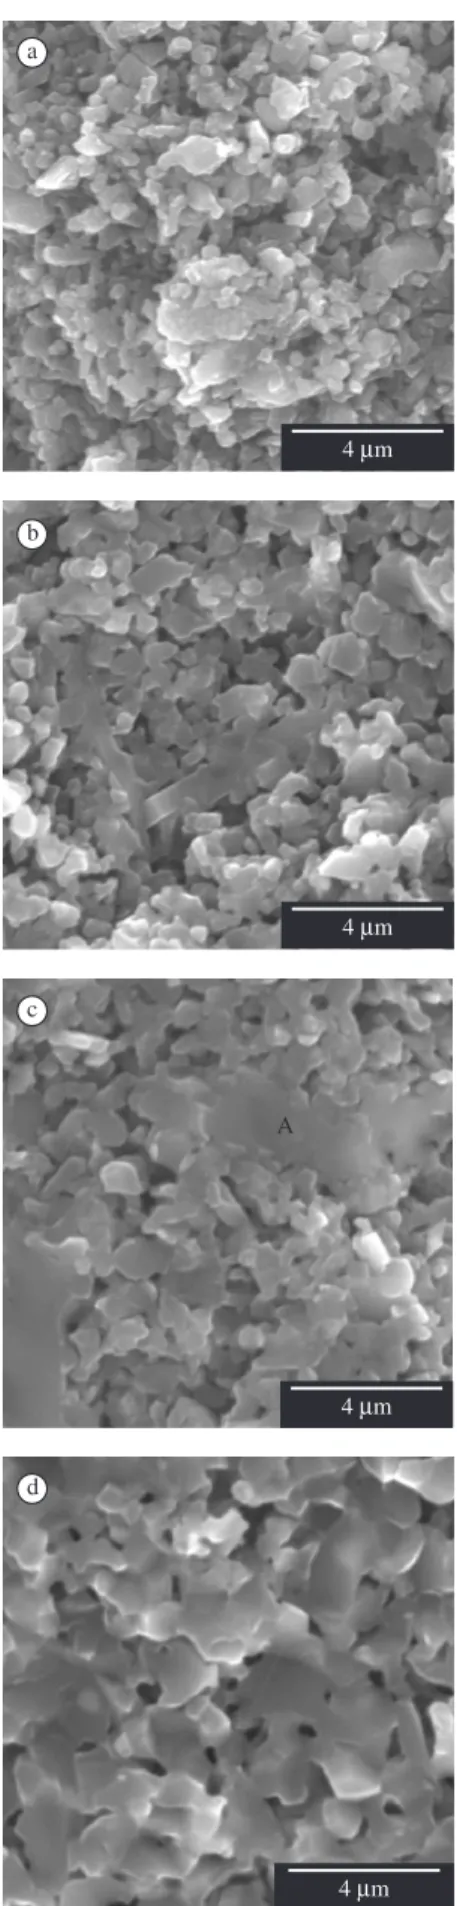
the LPS process started to operate in AlN with Y2O3 additive only at 1725 °C. After a sintering time of 8 hours at 1700 °C, the samples with additive showed significant densification and grain growth, and some isolated pores with morphology tending to spherical could be observed (Figure 3d). These samples sintered at 1750 °C (3 hours) presented almost fully dense microstructure and only some residual pores were observed. Pure AlN presented sluggish densification at 1700 °C by the SSS process. Without the aid of additives, AlN with high density can only be achieved after sintering above 1900 °C5.
Variations in elastic constants as a function of porosity were similar for the samples investigated, since the addition of a small amount (2 wt. (%)) of additives had almost no influence on the elastic constants of AlN. Thus, for each property, the results of all samples were analyzed together.
The results of longitudinal and shear sonic velocities (VL and VT) and Poisson’s ratio (ν) are shown in Figure 4a. Among the first three empirical equations (Equations 1 to 3), the best fits were observed for the second-degree polynomial equation (Equation 2). The values of VL, VT, and ν for zero porosity determined with polynomial fit were (10284 ± 164) m.s-1, (6004 ± 85) m.s-1, and (0.239 ± 0.005), a
4Mm
b
4Mm
d
4Mm c
4Mm A
Figure 3. SEM images of: a) AlN-2% CaO sintered at 1600 °C for 7 minutes;
b) AlN-2% CaO sintered at 1600 °C for 8 hours; c) AlN-2% CaCO3 sintered at
1700 °C for 1 hour; and d) AlN-2% Y2O3 sintered at 1700 °C for 8 hours. In c), the
letter A indicates a region with high Ca content determined by EDS analysis.
0.0 0.1 0.2 0.3 0.4 0
2000 4000 6000 8000 10000 12000 14000 16000
0.00 0.05 0.10 0.15 0.20 0.25 0.30
VT
Sonic v
elocity (m.s
-1)
Volume fraction of pores VL
N
Poisson's ratio
Pure AlN 2% CaCO3 2% CaO 2% Y2O3
(a)
0.0 0.1 0.2 0.3 0.4
0 50 100 150 200 250 300 350
Elastic modulus (GP
a)
Volume fraction of pores
Pure AlN 2% CaCO3 2% CaO 2% Y2O3
K
G E
(b)
respectively. The values of VL and VT were close to those measured by Gerlich et al.21 for a dense AlN-3 wt. (%) Y
2O3 (10127 and 6333 m.s
-1,
respectively). The reported ν value (0.179)21, however, was lower
than the value obtained in this work (0.239), which was close to that measured by Boch et al. (0.245)22.
The results of E, G, and K moduli as a function of porosity are shown in Figure 4b. Elastic moduli decreased more rapidly with increasing porosity compared to sonic velocities and ν. Empirical and semi-analytical equations (Equations 1 to 8) were adjusted to the results and the parameters of these fits are shown in Table 3 for E. The best fits were observed for polynomial and Phani-Niyogi’s equations (Equations 2 and 7, respectively). The average values of E, G, and K for zero porosity determined with these equations were (303 ± 4), (122 ± 1), and (195 ± 3) GPa, respectively. Boch et al.22
observed a linear decrease of the elastic constants with the increase in porosity (up to 20%) in AlN without additives prepared by hot press-ing. The determined values of E and G for zero porosity (314.7 and 126.2 GPa, respectively22) were close to the values determined in
this work (difference less than 4.0%). Bruls et al.23 measured an E
value of (312 ± 4) GPa for hot-pressed AlN. The values of E, G, and K measured by Gerlich et al.21 were 307.6-308.3, 128.3-130.8, and
159.9 GPa, respectively. They also reported literature data of E rang-ing from 294 to 392 GPa and calculated values of E, G, and K by Voigt averages using single crystal data (294.5, 117.2, and 201.7 GPa, respectively)21. Therefore, the measured elastic constants of almost
fully dense samples in this work were close to those reported in the literature.
The linear equation (Equation 1) presented good fits (Table 3), but tended to underestimate the elastic moduli for zero porosity. The widely used exponential equation (Equation 3) and the equations from Hasselman (Equation 4) and Martin-Haynes (Equation 5) presented poor fits and tended to overestimate the elastic moduli for zero poros-ity. These equations seem to be applicable only for small ranges of volume fraction of pores. Wang’s equation (Equation 6) presented good fits, and the values of the elastic moduli for zero porosity were close to the best fits. The equation from Lam et al. (Equation 8) presented poor fits, mainly for the results of high porosity range (above ~30%).
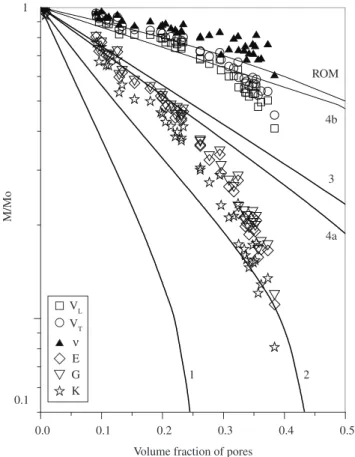
The results of elastic constants, normalized with the values de-termined for zero porosity, were compared to minimum solid area (MSA) models14,24 and the rule of mixture (ROM) model in Figure 5.
ROM model is a particular form of the linear equation (Equation 1, with b = 1). The Poisson’s ratio decreased with the increase in poros-ity with a rate lower than that predicted by ROM model, while the sonic velocities varied close to the ROM model in the low porosity range and tended to deviate after ~30% porosity. The elastic moduli initially tended to decrease with the increase in porosity close to two MSA models: spherical pores in cubic stacking and cylindrical pores in cubic stacking aligned transversal to applied stress. SEM analysis revealed the presence of spherical isolated pores in the microstructure of samples with high relative densities (Figure 3d), indicating that the first model is physically more reasonable for consideration. Above ~25% porosity, the elastic moduli decreased significantly, and in the high porosity range, the values approximated another MSA model:
spherical particles in cubic stacking. This analogy is consistent with the result fitted by Phani-Niyogi’s equation (Equation 7) that predicted a critical porosity (Pc = 1/b, b in Table 3), at which elastic modulus is zero, close to the Pc for spherical particles arranged in cubic array (0.476)10. Since the porosity of the green compacts was 0.40, the
elastic moduli do not become zero at this Pc value. Moreover, Nan-jangud et al.25 observed in a partially sintered alumina compact that
the elastic modulus increased significantly during the initial stage of sintering even when the densification was zero or minimal. Thus, at the porosity of the green compact (0.40), the onset value is expected to be ~6% of the elastic modulus in a fully dense material25.
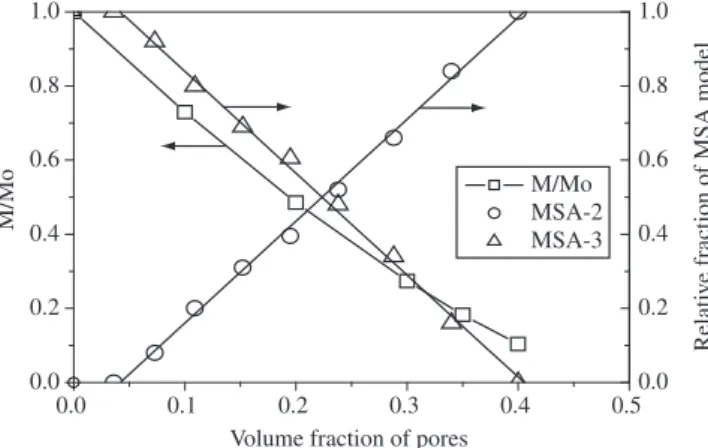
The gradual transition of the elastic moduli from the model of spherical particles in cubic stacking to the model of spherical pores in cubic stacking with decreasing porosity is consistent with the microstructural evolution during the sintering of a powder compact. In order to evaluate the influence of each of these models during the transition, the average curve of the elastic moduli with porosity,
Table 3. Fitted parameters of Equations 1 to 8 for the results of E. E0 is the Young’s modulus for zero porosity and OP is b for Equations 1, 3, 4, and 5, b1/b2 for Equations 2 and 6, and b/n for Equation 7.
Equation 1 2 3 4 5 6 7 8
E0 (GPa) 292 ± 3 303 ± 4 327 ± 8 328 ± 12 331 ± 5 300 ± 5 302 ± 4 306 ± 4
OP 2.32 2.74/1.23 4.28 4.56 1.63 2.08/7.09 2.05/1.30
-χ2/R2 70/0.988 52/0.991 229/0.960 423/0.926 104/0.982 68/0.988 53/0.991 202/0.964
0.0 0.1 0.2 0.3 0.4 0.5 0.1
1
M/Mo
Volume fraction of pores VL
VT N E G K
ROM
4b
3
4a
1 2
obtained by the Phani-Niyogi’s equation (Equation 7) fitted to the relative values of the E, G, and K, was compared to the MSA models. The relative influence of each model was estimated by the rule of mixture. This approach was suggested by Rice7, but it seems like it
has not been used before. The results (Figure 6) indicated an almost linear relationship between the relative volume fraction of each model that determined the trajectory of elastic moduli with porosity in the range of ~0.04 and 0.40. Bellow ~0.04 porosity, the model of spherical pores in cubic stacking was predominant.
In Figure 7, the relative results of E, G, and K moduli were plotted together with the predicted curves from analytical models based on stress concentration (Equations 9 to 15). In the case of Mackenzie’s equation (Equation 10), the second order terms were neglected. This simplification may influence only the range of high porosity8.
For Budianski model (Equation 15), the values of Poisson’s ratio, ν, were assumed to follow the polynomial fit given in Figure 4a. When the equations predicted only solution for two moduli, the third was calculated from the elastic relationship given by:
E KG
K G =
+ 9
3 (20)
The Hashin-Rosen’s model, for bodies with cylindrical pores aligned transversally to the applied stress (Equation 14), showed good fits to the experimental results of E until ~20% porosity (Figure 7a) and G until ~35% porosity (Figure 7b), but overestimated the K modu-lus (Figure 7c). The equations from Dewey (Equation 9), Mackenzie (Equation 10), and Budianski (Equation 15) showed slightly higher curves than the experimental values of E and G. Dewey’s equation (Equation 9.2) showed the best tendency for K in all porosity ranges, but the predicted values were slightly higher than the experimental results (Figure 7c). The remaining analytical models significantly overestimated the values of elastic moduli. The good predictability of Equation 14 (Hashin-Rosen’s model) for E and G, but not for K, was also observed in a high purity alumina13. The results also
corroborate the observations from Phani12 that analytical models
based on spherical pores do not fit well to the experimental results of elastic properties and that the models with non-spherical pores, such as cylindrical pores, aligned transversally to the applied stress result in better fits. However, there is no experimental evidence from microstructural analysis (Figure 3) to support the assumption of the presence of aligned cylindrical pores in partially sintered ceramic bodies. Moreover, the Poisson’s ratios, ν, calculated from analytical equations (Equations 9 to 15) with the elastic relationship were also
0.0 0.1 0.2 0.3 0.4 0.5 0.0
0.2 0.4 0.6 0.8 1.0
0.0 0.2 0.4 0.6 0.8 1.0
M/Mo
Volume fraction of pores
Relati
v
e fraction of MSA model
M/Mo MSA-2 MSA-3
Figure 6. Relative elastic modulus and relative fraction of MSA model versus porosity. MSA-2 is the model of spherical particles in cubic stacking and MSA-3 is the model of spherical pores in cubic stacking.
0.0 0.1 0.2 0.3 0.4 0.5 0.0
0.2 0.4 0.6 0.8 1.0
E/Eo
Volume fraction of pores Pure AlN 2% CaCO3 2% CaO 2% Y2O3
Dewey (Equation 9) Mackenzie (Equation 10) Kerner (Equation 11) Hashin (Equation 12.1)
Hashin-Rosen (Equation 13.1) Hashin-Rosen (Equation 14.1) Budiansky (Equation 15)
(a)
0.0 0.1 0.2 0.3 0.4 0.5 0.0
0.2 0.4 0.6 0.8 1.0
G/Go
Volume fraction of pores
Pure AlN 2% CaCO3 2% CaO 2% Y2O3
Dewey (Equation 9.1) Mackenzie (Equation 10.1) Kerner (Equation 11.1) Hashin (Equation 12.2)
Hashin-Rosen (Equation 13.2) Hashin-Rosen (Equation 14.2) Budiansky (Equation 15.1)
(b)
0.0 0.1 0.2 0.3 0.4 0.5 0.0
0.2 0.4 0.6 0.8 1.0
K/K
o
Volume fraction of pores Pure AlN 2% CaCO3 2% CaO 2% Y2O3
Dewey (Equation 9.2) Mackenzie (Equation 10.2) Kerner (Equation 11.2) Hashin (Equation 12.3)
Hashin-Rosen (Equation 13) Hashin-Rosen (Equation 14.3) Budiansky (Equation 15.2)
(c)
compared to the experimental results, but all models showed over-estimated predictions. The inconsistency of the proposed analytical models based on stress concentration to predict the elastic constants (mainly K and ν) reinforces Rice’s proposition that shape-stress con-centration concepts have little or no fundamental basis to determine elastic properties of porous materials26.
4. Conclusions
The elastic constants of AlN were significantly influenced by porosity, however they were not affected by the different types of additives used (2 wt. (%) of CaCO3, CaO, and Y2O3). All elastic con-stants evaluated (VL, VT, ν, E, G, and K) decreased with the increase in porosity, but the rates of decrease were higher for elastic moduli compared to sonic velocities and Poisson’s ratio. Among the empirical and semi-analytical equations, the best fits in the ~0 to 38% porosity range were observed with the second-degree polynomial equation (Equation 2) for all elastic constants, and also with the Phani-Niyogi’s equation (Equation 7) for elastic moduli.
The effect of porosity on Poisson’s ratio was lower than that predicted by the rule of mixture. Sonic velocities decreased with the increase in porosity following the rule of mixture up to ~30% porosity. The analysis of elastic modulus results by minimum solid area models indicated that, up to ~4% porosity, the model for spherical pores in cubic stacking was predominant and, above this porosity level, an almost linear transition occurred to the model of spherical particles in cubic stacking. The analytical model with the best fit to the results of E and G moduli (up to ~20 and 30% porosity, respectively) was the Hashin-Rosen’s model for cylindrical pores aligned transversally to the applied stress.
Acknowledgments
The authors acknowledge Brazilian agencies, FAPESP and CNPq, for their financial support of the present research.
References
1. Holmquist TJ, Templeton DW, Bishnoi KD. Constitutive modeling of aluminum nitride for large strain, high-strain rate, and high-pressure
applications. Int J Impact Eng. 2001; 25(3):211-231.
2. Tangen I-L, Yu Y, Grande T, Høier R, Einarsrud MA. Phase relations and microstructural development of aluminum nitride–aluminum nitride polytypoid composites in the aluminum nitride–alumina–yttria system. J Am Ceram Soc. 2004; 87(9):1734-1740.
3. Qiao L, Zhou H, Xue H, Wang S. Effects of Y2O3 on low temperature
sintering and thermal conductivity of AlN ceramics. J Eur Ceram Soc.
2003; 23(1):61-67.
4. Molisani AL, Yoshimura HN, Goldenstein H. Efeito do teor de Y2O3 na
sinterização do nitreto de alumínio. Cerâmica. 2006; 52(322):151-160.
5. Molisani AL, Yoshimura HN, Goldenstein H, Watari K. Effects of CaCO3
content on the densification of aluminum nitride. J Eur Ceram Soc. 2006;
26(15):3431-3440.
6. Kim YW, Jin YJ, Chun YS, Song IH, Kim HD. A simple pressing
route to closed-cell microcellular ceramics. Scripta Mater. 2005;
53(8):921-925.
7. Rice RW. Evaluation and extension of physical property-porosity models
based on minimum solid area. J Mater Sci. 1996; 31(1):102-118.
8. Rice RW. Microstructure dependence of mechanical behavior of
ceram-ics. In: MacCrone RK, editor. Properties and microstructures. New York:
Academic Press; 1977. p. 199-381. (Treatise on Materials Science and Technology, vol 11).
9. Dean EA, Lopez JA. Empirical dependence of elastic moduli on porosity
for ceramic materials. J Am Ceram Soc. 1983; 66(5):366-370.
10. Phani KK, Niyogi SK. Young’s modulus of porous brittle solids. J Mater
Sci. 1987; 22(12):257-263.
11. Lam DCC, Lange FF, Evans AG. Mechanical properties of partially
dense alumina produced from powder compacts. J Am Ceram Soc. 1994;
77(8):2113-2117.
12. Phani KK. Porosity-dependence of elastic properties and ultrasonic velocity in polycrystalline alumina-a model based on cylindrical pores. J Mater Sci. 1996; 31(1):262-266.
13. Yoshimura HN, Molisani AL, Siqueira GR, Camargo AC, Narita NE, Cesar PF et al. Efeito da porosidade nas propriedades mecânicas de uma
alumina de elevada pureza. Cerâmica. 2005; 51(319):239-251.
14. Rice RW. Comparison of physical property-porosity behaviour with
minimum solid area models. J Mater Sci. 1996; 31(6):1509-1528.
15. Chao LP, Huang, JH. Prediction of elastic moduli of porous
materi-als with equivalent inclusion method. J Reinforc Plast Compos.
1999;18(7):592-605.
16. Ostrowski T, Rödel J. Evolution of mechanical properties of porous
alumina during free sintering and hot pressing. J Am Ceram Soc. 1999;
82(11):3080-3086.
17. Deng AY, Zhou Y, Inagaki Y, Ando M, Ohji T. Role of Zr(OH)4 hard
agglomerates in fabricating porous ZrO2 ceramics and the reinforcing
mechanisms. Acta Mater. 2003; 51(3):731-739.
18. Reyanud C, Thevenot F. Porosity dependence of mechanical properties
of porous sintered SiC: verification of the minimum solid area model. J
Mater Sci Lett. 2000; 19:871-874.
19. Molisani AL. Sinterização de nitreto de alumínio com compostos contendo
cálcio. [Unpublished M.Sc thesis]. São Paulo: University of São Paulo; 2004.
20. American Society for Testing and Materials. ASTM E 494 - Standard
practice for measuring ultrasonic velocity in materials. Philadelphia: American Society for Testing and Materials; 2002.
21. Gerlich D, Dole SL, Slack GA. Elastic properties of aluminum nitride. J Phys Chem Solids. 1986; 47(5):437-441.
22. Boch P, Glandus J, Jarrige J, Lecompte JP, Mesmain J. Sintering,
oxida-tion and mechanical properties of hot pressed aluminium nitride. Ceram
Inter. 1982; 8(1):34-40.
23. Bruls RJ, Hintzen HT, De With G, Metselaar R. The temperature
depend-ence of the Young’s modulus of MgSiN2, AlN and Si3N4. J Eur Ceram
Soc. 2001; 21(3):263-268.
24. Knudsen FP. Dependence of mechanical strength of brittle
polycrys-talline specimens on porosity and grain size. J Am Ceram Soc. 1959;
42(8):376-387.
25. Nanjangud SC, Brezny R, Green DJ. Strength and Young’s modulus
behavior of a partially sintered porous alumina. J Am Ceram Soc. 1995;
78(11):266-268.
26. Rice RW. Comparison of stress concentration versus minimum solid
area based mechanical property-porosity relations. J Mater Sci. 1993;