Abs tract
Structural foams are a relatively new class of materials with pecu-liar characteristics that make them very attractive in some energy absorption applications. They are currently used for packaging to protect goods from damage during transportation in the case of accidental impacts. Structural foams, in fact, have sufficient me-chanical strength even with reduced weight: the balance between the two antagonist requirements demonstrates that these materials are profitable. Structural foams are generally made of microcellu-lar materials, obtained by polymers where voids at the microscopic level are created. Although the processing technologies and some of the material properties, including mechanical, are well known, very little is established for what concerns dynamic impact proper-ties, for the design of energy absorbing components made of mi-crocellular foams. The paper reports a number of experimental results, in different loading conditions and loading speed, which will be a basis for the structural modeling.
Key words
Lightweight materials, structural foams, microcellular foams, pol-ymeric foams
Mechanical properties and impact behavior of a
microcellular structural foam
1 INTRODUCTION
Structural foams are defined in different ways:
• materials to build objects "possessing a smooth solid skin and a cellular core. Structural foam provides improved part strength to weight ratios" (ampacet.com, 2011)
• "any of the various foam materials with structural qualities"(WaterMark Marine Industries, classboats.com, 2011)
In more general terms, structural foam is a (polymeric) material with considerable mechanical prop-erties comparable to a solid material although with lower density. The relative density ρf/ρs (ratio
between the density of the foam and the density of the solid) of these foams is very high, much greater than 0.5 as defined by Gibson and Ashby (1997) as it is for the usual cellular foams. Such high values of relative density can be obtained only with a very large number of very small cells, as
M. A va ll e A . Sc atti n a *
Politecnico di Torino, Dipartimento di Inge-gneria Meccanica e Aerospaziale
Corso Duca degli Abruzzi, 24 – 10129 Tori-no, Italy
Received in 20 Jan 2013 In revised form 29 Apr 2013
* Author email:
Latin American Journal of Solids and Structures 11(2014) 200 - 222 is obtained in the so-called microcellular materials. For this reason microcellular materials are used as structural foams. These foams can be produced from various plastics (PVC, PC, PP, ABS, PET, and PETG) where cells of micrometric size are created inside: medium porosity size is 10 μm, typi-cally varying between 0.1 and 100 μm (differently from traditional polymeric foams where cell size vary between 100 and 500 μm).
Microcellular foams can be obtained by different process, discrete, semi-continuous and continuous, as discussed by Kumar (1993) for several types of polymers in a discontinuous process whereas Ku-mar et al (2004) show the same for a continuous production, or both (KuKu-mar and Nadella, 2004); Nadella et al. (2005) propose the constrained foaming process for panels of ABS, PMMA, and PS; Kumar et al. (1992) and Kumar and Weller (1994) use a discrete process for foaming microcellular PVC, even considering (Kumar et al., 1998) the effect of additives; finally Murray et al. (2000) pre-sent the discontinuous process for microcellular ABS. Temperature and other technological parame-ters can change the characteristics of the obtained foam.
Many examples of these materials are reported in different works: Kumar and Suh (1990) tested a polystyrene foam, Nadella et al. (2005) examined PMMA, PS and ABS, Kumar and Weller (1994), Kumar et al. (1994) and Bureau and Kumar (2006) treated about polycarbonate foam, Ku-mar (1993) spoke about PVC, PC, PS and PET foams, KuKu-mar and Nadella (2004) generally spoke about PS, PC, ABS, PET, CPET and PVC foams, Kumar et al. (2004), Kumar et al. (1992, 1998) and Demir et al. (2008) dealt about microcellular PVC, Murray et al. (2000), Beydokhti et al. (2006), Nadella and Kumar (2007) and Nabhani and Bamford (2002) tested ABS foam. The pro-cessing parameters (pressure, time, temperature, etc.) and the resulting physical properties are dis-cussed there (relative density, cell size and distribution, etc.).
Current applications include packaging, disposable kitchen tools, masonry, etc. Recycled plastics can also be used.
Figure 1 shows a section of a typical microcellular foam from the current work: details of the materials will be given in §3.1. The cell size of this microcellular ABS is quite scattered with an average size of 30 μm, but with larger cells sometimes up to 1000 μm. The outer layer forms a dens-er skin that gives advantages both in tdens-erms of supdens-erficial strength and surface finish.
In this work, after a discussion about the properties of microcellular foams and their dependency from the density, a series of experimental results, in different loading conditions and loading speed are presented and discussed.
2 PROPERTIES-DENSITY DEPENDENCE
The mechanical properties of the microcellular foams are reported in many papers: Beydokhti et al. (2006), Nadella and Kumar (2007) and Nabhani and Bamford (2002) presented results about ABS foams, Bezazi et al (2011) presented results about PVDF foams, while Kumar et al. (1994) and Bureau and Kumar (2006) showed results about polycarbonate foams.
Latin American Journal of Solids and Structures 11(2014) 200 - 222
same for the solid material is indicated by the suffix s. As a matter of fact, there are functional forms of the type:
pf ps
=F ρf
ρs ⎛ ⎝ ⎜⎜ ⎜⎜⎜
⎞ ⎠ ⎟⎟
⎟⎟⎟ (1)
Figure 1 Section after tensile failure of the microcellular ABS examined: thickness of the sample, along the vertical direction in the pic-tures, is 3.2 mm.
In Eq. (1) p is any parameter used to describe some specific properties of the foam pf and of the
solid ps in terms of the relative density (ρf / ρs). With this in mind, it can be argued that the
ex-treme values of the function F must be 0 in the case of a foam with null density, and 1 when the foam degenerates back to the solid ρf = ρs. Gibson and Ashby (1997) propose, for the various
prop-erties, several theoretical or experimental laws to describe such dependencies. Some do not respect these necessary constraints since the case of relative density next to one is not common.
Latin American Journal of Solids and Structures 11(2014) 200 - 222 Ef
Es =C1 ρf ρs ⎛ ⎝ ⎜⎜ ⎜⎜⎜ ⎞ ⎠ ⎟⎟ ⎟⎟⎟ 2
open-cell foams
(2) Ef
Es
≈φ2 ρf
ρs ⎛ ⎝ ⎜⎜ ⎜⎜⎜ ⎞ ⎠ ⎟⎟ ⎟⎟⎟ 2
+
(
1−φ)
ρfρs ⎛ ⎝ ⎜⎜ ⎜⎜⎜ ⎞ ⎠ ⎟⎟ ⎟⎟⎟+ p0
1−2v
f
(
)
Es
(
1−ρf ρs)
closed-cell foams
Where ϕ is the fraction of the solid contained in the cell edges (Gibson and Ashby, 1997). For
open-cell foams they report that the constant C1 ≈ 1 so that the elastic modulus of the foam tends to
that of the solid when the relative density tend to one; for closed-cell foam there are two terms one showing a quadratic influence of the relative density, and the second indicating a linear influence of the relative density, plus a third term – that keeps into account the compression of the gas included in the cells, related to the gas pressure p0, the elastic modulus Es of the solid material, and the
Pois-son ratio of the foam vf – related to the inverse of the relative density. This term tends to infinity
when the relative density tends to 1 but it is influencing only the range of densities next to 1. In fact, Gibson and Ashby suggest also that this last contribution can be usually neglected. However, even in this case the constraint on the value of the elastic modulus when the relative density tends to 1 cannot be respected.
For what concerns the plastic stress level of the foam, plateau level of the stress-strain curve, the proposed relations are as follows:
σpl,f σy,s ≈0.3
ρf ρs ⎛ ⎝ ⎜⎜ ⎜⎜⎜ ⎞ ⎠ ⎟⎟ ⎟⎟⎟ 3 2
or σpl,f
σy,s ≈0.23 ρf ρs ⎛ ⎝ ⎜⎜ ⎜⎜⎜ ⎞ ⎠ ⎟⎟ ⎟⎟⎟ 3 2
1+ ρf ρs ⎛ ⎝ ⎜⎜ ⎜⎜⎜ ⎞ ⎠ ⎟⎟ ⎟⎟⎟ 1 2 ⎡ ⎣ ⎢ ⎢ ⎢ ⎢ ⎤ ⎦ ⎥ ⎥ ⎥ ⎥
open-cell foams
(3)
σpl,f
σy,s ≈0.3 φ
ρf ρs ⎛ ⎝ ⎜⎜ ⎜⎜⎜ ⎞ ⎠ ⎟⎟ ⎟⎟⎟ 3 2
+
(
1−φ)
ρfρs ⎛ ⎝ ⎜⎜ ⎜⎜⎜ ⎞ ⎠ ⎟⎟
⎟⎟⎟+p0−patm
σy,s
closed-cell foams
All these formulations do not respect the previously mentioned constraints: for closed cell foams at the extreme value of null relative density there is still a non-zero value of plastic stress related to the difference between the included gas pressure p0 and the atmospheric pressure patm.
For structural microcellular foams the relative density is much nearer to 1, generally from 0.85 to 0.95, and it is of great interest to have specific formulation to take into account in a proper man-ner the influence of the relative density. Looking at Eq. (2) and (3) it can be noticed that the influ-ence of the relative density is described by a quadratic monomial term for the open-cell foams, line-ar and quadratic for the closed-cell foam, when dealing with the elastic moduli; when dealing with the plastic stress level, the influence is slightly more complex involving a linear or a term with ex-ponent 3/2.
Latin American Journal of Solids and Structures 11(2014) 200 - 222
Ef
Es =
(
1−A)
ρf ρs
⎛
⎝ ⎜⎜ ⎜⎜⎜
⎞
⎠ ⎟⎟ ⎟⎟⎟ 2
+A ρf
ρs
⎛
⎝ ⎜⎜ ⎜⎜⎜
⎞
⎠ ⎟⎟ ⎟⎟⎟
(4)
σpl,f
σy,s
=
(
1−B)
ρf ρs ⎛⎝ ⎜⎜ ⎜⎜⎜
⎞
⎠ ⎟⎟ ⎟⎟⎟ 2
+B ρf ρs ⎛
⎝ ⎜⎜ ⎜⎜⎜
⎞
⎠ ⎟⎟ ⎟⎟⎟
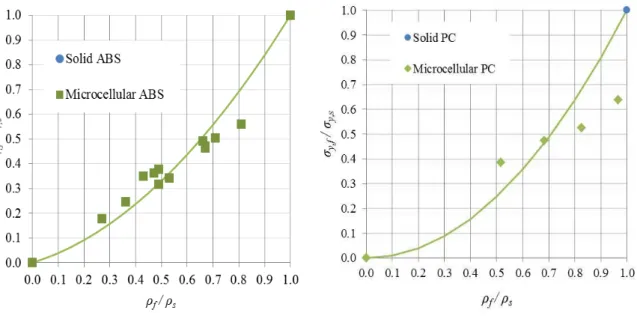
The validity and applicability of these equations can be demonstrated on the basis of experimental values from the literature: Kumar et al. (1998) and Demir et al. (2008) bring data for microcellular PVC; Beydokhti et al. (2006) report strength data for microcellular ABS composites; Nadella and Kumar (2007) report tensile and bending data for microcellular ABS; Kumar et al. (1994) bring data for tensile strength and modulus for microcellular PC; Bureau and Kumar (2006) discuss and report on the fracture toughness of microcellular PC; Wing et al. (1995) report creep data for mi-crocellular PC; Pasricha et al. (2005) also bring data on creep of mimi-crocellular PC but with different processing parameters; Armstrong and Kumar (2000) add results for dynamic compliance of micro-cellular PC; Barlow and Kumar (2001) report impact data for impact of micromicro-cellular PC; Kumar et al. (2000) again report impact strength data but for microcellular PET while Nabhani and Bam-ford (2002) do it for microcellular PE and PU. The relative importance of the two quantities de-pends on the fraction of open and closed cells. Figures 2 and 3 show the results about different mi-crocellular materials from the literature.
Latin American Journal of Solids and Structures 11(2014) 200 - 222 Figure 2 Ratio of the elastic modulus of the microcellular foam over the solid polymer elastic modulus as a function of the relative density
Latin American Journal of Solids and Structures 11(2014) 200 - 222
Figure 3 Ratio of the plastic stress of the microcellular foam over the solid polymer yield strength as a function of the relative density for several materials.
The conclusions that can be drawn are that in the case of simple tension or compression there is no advantage in using a foamed material if the elastic modulus decrease linearly with the density, and a worse result is obtained when the dependence is quadratic (as in open-cell foams). In this case, in theory using very lightweight foams requires much more weight to obtain the same stiff-ness. There is always advantage when bending is involved, even if the advantage is less in the case of open-cell foams.
Latin American Journal of Solids and Structures 11(2014) 200 - 222 Table 1 Influence of the relative density on the performance of typical components when constant stiffness is imposed.
Case Tension/Compression Bending
k =EA
l
⇒A=lk
E
m=ρAl =ρkl 2
E
k =csEJ
l3 =
c
sEbh 3
12l3 ⇒h =
12kl3 Eb ⎛ ⎝ ⎜⎜ ⎜⎜ ⎞ ⎠ ⎟⎟ ⎟⎟⎟ 1 3
m =ρbhl =ρb 12k
Eb ⎛ ⎝ ⎜⎜ ⎜⎜ ⎞ ⎠ ⎟⎟ ⎟⎟ 1 3
l2 =ρb2 3 12k E ⎛ ⎝ ⎜⎜ ⎜⎜ ⎞ ⎠ ⎟⎟ ⎟⎟ 1 3 l2
Mass mf
ms = ρf
ρs ⎛ ⎝ ⎜⎜ ⎜⎜⎜ ⎞ ⎠ ⎟⎟ ⎟⎟⎟ EEsf
⎛ ⎝ ⎜⎜ ⎜⎜⎜ ⎞ ⎠ ⎟⎟
⎟⎟⎟ mf
ms = ρf ρs ⎛ ⎝ ⎜⎜ ⎜⎜⎜ ⎞ ⎠ ⎟⎟ ⎟⎟⎟ EEsf
⎛ ⎝ ⎜⎜ ⎜⎜⎜ ⎞ ⎠ ⎟⎟ ⎟⎟⎟ 1 3
Case Ef Es
∝ ρf ρs
mf
ms
=1 mf
ms
= ρf
ρs ⎛ ⎝ ⎜⎜ ⎜⎜⎜ ⎞ ⎠ ⎟⎟ ⎟⎟⎟ 2 3
Case Ef
Es ∝ ρf ρs ⎛ ⎝ ⎜⎜ ⎜⎜⎜ ⎞ ⎠ ⎟⎟ ⎟⎟⎟ 2 mf
ms = ρf ρs ⎛ ⎝ ⎜⎜ ⎜⎜⎜ ⎞ ⎠ ⎟⎟ ⎟⎟⎟ −1 mf
ms = ρf ρs ⎛ ⎝ ⎜⎜ ⎜⎜⎜ ⎞ ⎠ ⎟⎟ ⎟⎟⎟ 1 3
If the design requirement is strength, a similar analysis can be carried out. For this output an-other interesting loading case is reported, that of a thin walled member used to absorb energy in impact situation. For this case an empirical relation obtained by Peroni et al. (2009) can be used. The average load Pm during crush (that represents the absorbed energy per unit crush length) can
be approximately evaluated, for a large number of cases, as follows:
1 5 1 3 3 2
m y
P =ks a t (5)
Where σy is the yield stress of the material, a the side of the member (considered square for
sim-plicity), and t the thickness.
Latin American Journal of Solids and Structures 11(2014) 200 - 222
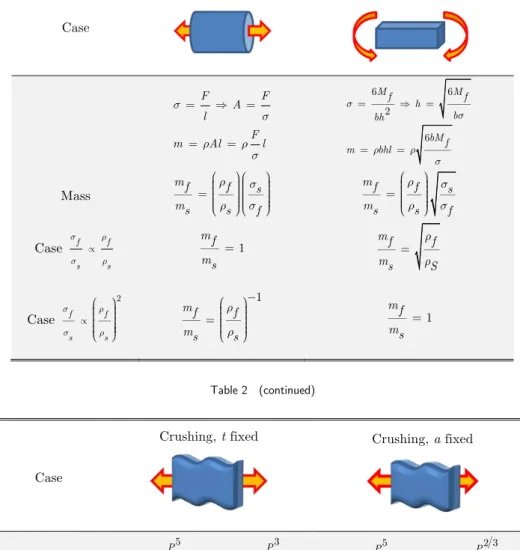
Table 2 Influence of the relative density on the performance of typical components when constant stiffness is imposed.
Case
Tension/Compression Bending
σ=
F
l
⇒A=
F
σ
m =ρAl =ρ
F
σ
l
σ=
6Mf
bh2 ⇒h =
6Mf
bσ
m=ρbhl =ρ 6bM
f
σ
Mass mf
ms = ρf ρs ⎛ ⎝ ⎜⎜ ⎜⎜ ⎞ ⎠ ⎟⎟ ⎟⎟⎟ σσsf
⎛ ⎝ ⎜⎜ ⎜⎜ ⎞ ⎠ ⎟⎟
⎟⎟⎟ mfms = ρf ρs ⎛ ⎝ ⎜⎜ ⎜⎜ ⎞ ⎠ ⎟⎟ ⎟⎟⎟ σσsf
Case σf σ s ∝ ρ f ρ s mf ms =1
mf ms =
ρf
ρS
Case σf σ s ∝ ρ f ρ s ⎛ ⎝ ⎜⎜ ⎜⎜ ⎞ ⎠ ⎟⎟ ⎟⎟⎟ 2 mf ms = ρf ρs ⎛ ⎝ ⎜⎜ ⎜⎜ ⎞ ⎠ ⎟⎟ ⎟⎟⎟ −1 mf ms =1
Table 2 (continued)
Case
Crushing, t fixed Crushing, a fixed
σ y =
Pm5
k5a5 3t15 2
⇒a = Pm 3
k3σy3 2t9 2
m= 4ρatl = 4ρ Pm3
k3σ y
3 2
t7 2 l
σy =
Pm5
k5a5 3t15 2
⇒t =
Pm2 3
k2 3σy2 15a2 9
m= 4ρatl =4ρa7 9 Pm2 3
k2 3σy2 15
l
Mass mf
ms = ρf ρs ⎛ ⎝ ⎜⎜ ⎜⎜ ⎞ ⎠ ⎟⎟ ⎟⎟⎟ σσsf
⎛ ⎝ ⎜⎜ ⎜⎜ ⎞ ⎠ ⎟⎟ ⎟⎟⎟ 3 2 mf ms = ρf ρs ⎛ ⎝ ⎜⎜ ⎜⎜ ⎞ ⎠ ⎟⎟ ⎟⎟⎟ σσsf
⎛ ⎝ ⎜⎜ ⎜⎜ ⎞ ⎠ ⎟⎟ ⎟⎟⎟ 2 15
Case σf σ s ∝ ρ f ρ s mf ms = ρf ρs ⎛ ⎝ ⎜⎜ ⎜⎜ ⎞ ⎠ ⎟⎟ ⎟⎟⎟
−1 2
mf ms = ρf ρs ⎛ ⎝ ⎜⎜ ⎜⎜ ⎞ ⎠ ⎟⎟ ⎟⎟⎟ 13 15
Latin American Journal of Solids and Structures 11(2014) 200 - 222 In conclusion, best performances are always obtained when the material properties depend line-arly from the density, that is the material is much farther from the behavior of open-cell foams.
3 EXPERIMENTAL TESTS AND RESULTS
3.1 Examined material
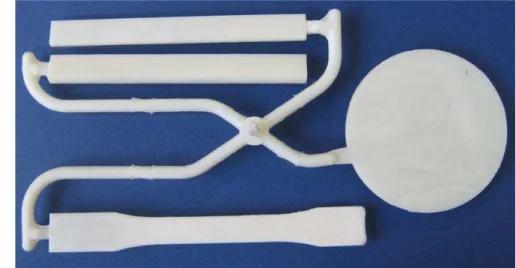
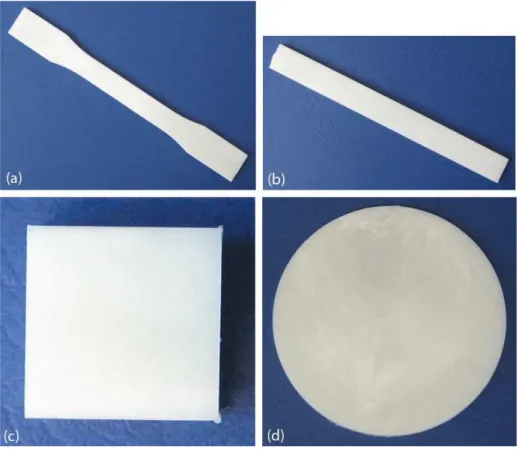
The material considered in this work is a microcellular PC manufactured by Centre Català del Plàstic in Barcelona, Spain. The nominal relative density of the microcellular foam samples was 90%. The samples were provided in different figures obtained from a single composite mold (Figure 4). In particular the specimens were:
a. Tensile specimen 3 mm thick (dog-bone shaped)
b.Prismatic specimen for compression tests, with 9 mm thickness c.Bending specimen 6.35 mm and 3.2 mm thick
d.Discs, diameter 80 mm, thickness 4 mm
In all cases samples made of solid material and of microcellular foams were considered and test-ed. Figure 5 illustrates the different types of specimen ustest-ed.
Dimensions and weight of each single sample has been measured, obtaining an evaluation of the actual foam density, reported in Table 3.
The relative density results to be 0.91 which is consistent with the manufacturer’s indications. For some samples there are absolute density values slightly higher or lower than the average: for example the tensile specimens have density greater than the average, while the contrary holds for the compression specimen. In this case, however, the apparent density reduction comes from the technique adopted to obtain this specimen, cutting from a larger one. The cut was not perfect, and it was quite difficult to obtain proper size values. However, in all cases the variation from the solid form to the micro-cellular is constant: this is an indication that the variations are not random but they depend from the type of specimen. This is explained by the fact that the different types of specimen have different position in the mold, and mold filling is not perfect: compaction is non-uniform giving density variations.
Latin American Journal of Solids and Structures 11(2014) 200 - 222
Figure 5 Specimens used in the experiments: (a) tensile dog-bone shaped according to ASTM D638-10; (b) prismatic specimen for bending tests, size 126.5 mm × 12.9 mm × 3.27/6.34 mm; (c) prismatic specimen for compression tests cut from a larger piece, size 18
mm × 18.6 mm × 9 mm; (d) discs diameter 79.7 × thickness 4 mm.
Another consideration is that the standard deviation is much higher for the micro-cellular sam-ples rather than for the solid ones: the standard deviation can be as high as 3% of the foam density. This is a consequence of the foaming process, which is far from giving a homogeneous cell distribu-tion, as it was shown in Figure 1. For the solid material the standard deviation is around 0.2-0.7, much lower than the micro-cellular samples.
Table 3 Results of the evaluation of the foam density from the samples used in the mechanical tests; specimen type (e) for Charpy tests was not used in this work.
Average density (kg/m3)
Relative density
Std. Deviation (kg/m3)
Type Solid Microcellular Solid Microcellular
(a) Tensile 1158.8 1027.6 89% 2.3 34.8
(b) Compression 984.9 884.7 90% 6.7 30.3
(c) Bending 1/4" 1035.4 937.6 91% 1.6 10.2
(c) Bending 1/8” 1022.9 961.7 94% 2.5 11.6
(d) Disc 1036.9 954.3 92% 2.0 8.4
(e) Charpy 1010.2 901.3 89% 4.6 10.5
Latin American Journal of Solids and Structures 11(2014) 200 - 222 3.2 Experimental methods
The performed tests were of four types:
a. Tensile tests at three loading speed: quasi-static (0.05 and 50 mm/s) and medium speed (5 m/s)
b.Compression tests at 0.05 mm/s (quasi-static) c.Four-point bending, quasi-static
d.Transverse impact by means of a falling mass (ASTM D5628)
All the tests were performed at room temperature on both the solid material and microcellular foam. At least 3 valid repetitions of each test were carried out.
The quasi-static tensile and compression tests were performed with a Zwick Z100 (mechanical) and an Instron 8801 (hydraulic) universal testing machines. Both are equipped with a 100 kN load cell, and extensometer to measure the specimen deformation. The medium speed tests were con-ducted by means of a custom made equipment, FASTENS, which is frame for a medium/high speed loading tensile tests pneumatically actuated. Maximum speed is around 10 m/s for a maximum measurable load of 30 kN. In this case the load is measured with a piezoelectric Kistler 9341 cell, while strain is evaluated by means of a displacement measurement done with a fast laser triangula-tion transducer (Keyence LK-G407).
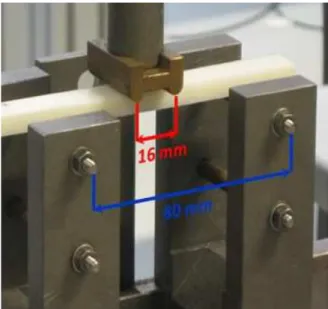
The four point bending tests were conducted in the same Zwick Z100 machine mounting the specimen into a custom made supporting frame, adapted to the size of the specimen itself (Figure 6). For the falling-dart test a CEAST 9350 Fractovis Plus was used (5.735 kg total falling mass, maximum height 1.5 m).
Latin American Journal of Solids and Structures 11(2014) 200 - 222 3.3 Tensile tests
The results of the tensile tests on the solid material and microcellular foams are shown in Figure 7 and 8. The figures compare the stress-strain curves obtained at the three loading speed considered.
Figure 7 Results of the tensile tests of the solid ABS material: TS-01, TS-02, TS-03 tested at 0.05 mm/s; TS-04, TS-05, TS-06 tested at 50 mm/s; TS-07 to TS-11 tested at 5 m/s (nominal speed).
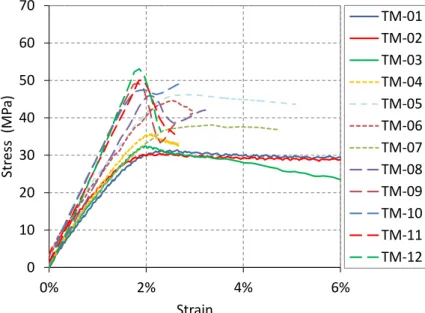
Figure 8 Results of the tensile tests of the microcellular ABS: TM-01, TM-02, TM-03 tested at 0.05 mm/s; TM-04 to TM-09 tested at 50 mm/s; TM-10 to TM-12 tested at 5 m/s (nominal speed).
First of all there is a clear effect of the loading speed on the mechanical properties: as expected, the yield strength increases with the loading speed, whereas the maximum strain decreases dramati-cally. In quasi static loading the yield strength reduces from about 40 MPa of the solid material to 30 MPa of the microcellular foam. Clearly the strength is less than proportional to the density.
An-0 10 20 30 40 50 60 70
0% 2% 4% 6%
S
tr
e
ss
(
MP
a)
Strain
TS‐01
TS‐02
TS‐03
TS‐04
TS‐05
TS‐06
TS‐07
TS‐08
TS‐11
0 10 20 30 40 50 60 70
0% 2% 4% 6%
S
tr
ess
(
MP
a)
Strain
TM‐01
TM‐02
TM‐03
TM‐04
TM‐05 TM‐06
TM‐07
TM‐08
TM‐09
TM‐10
TM‐11
Latin American Journal of Solids and Structures 11(2014) 200 - 222 other important consideration deals with the larger scatter observed in the microcellular material: due to the variability in the average density and inhomogeneity of the size and distribution of the cells, the macroscopic properties are also quite variable.
3.4 Compression tests
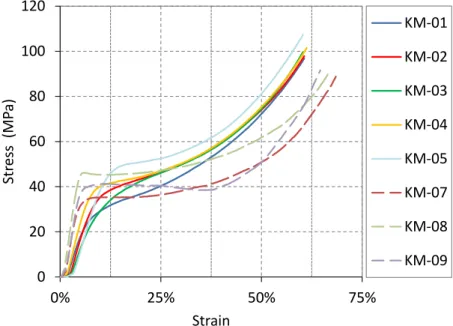
In the compression tests another important issue has been observed. The material, especially in the microcellular form, is not isotropic. This is evidenced in Figure 9 and 10 where the results of the compression tests in quasi-static conditions are reported. The material behavior, in both cases, is typical: after elastic loading, almost linear, there is yield with a plateau followed by densification. In this case only the strength can be evaluated. For the solid material a large gap is clear be-tween the two loading directions. The solid material is more compliant even with a higher yield and plateau. The curves are very repeatable. On the contrary, for the microcellular foam the difference between the two loading direction seems less significant but this is mainly because of a larger ter. In particular the elastic modulus shows very large variations, and all the curves are quite scat-tered.
The reduction of the mechanical properties is even more than for the tensile tests, but this is probably also due to the method used to cut the samples which could induce damage in the materi-al.
Figure 9 Results from the compression tests of the solid materials: 01 to 05 samples loaded on the largest surface; 06 to KS-09 sample loaded in the transverse direction.
0 20 40 60 80 100 120
0% 25% 50% 75%
S
tr
ess
(
MP
a)
Strain
KS‐01
KS‐02
KS‐03
KS‐04
KS‐05
KS‐06
KS‐07
KS‐08
Latin American Journal of Solids and Structures 11(2014) 200 - 222
Figure 10 Results from the compression tests of the microcellular materials: KM-01 to KM-05 samples loaded on the largest surface; KM-06 to KM-09 sample loaded in the transverse direction.
3.5 Bending tests
Bending tests were not conducted using the ASTM D790 flexural test methods because four-point bending tests was considered most significant for the evaluation of the properties of this kind of material. This implied the use of a loading scheme different from the cited standard: in particular the support span is greater than in the ASTM standard (Figure 6) to allow the presence of the two upper loading pins.
The tests were conducted at low speed only. The samples were not loaded until fracture that could not be obtained with the maximum stroke possible with this loading frame. The results are shown in Figure 11 and 12 reporting the load-stroke characteristics of the tests: in this case it is not possible to derive the stress-strain characteristic due to the nonlinear behavior of the material. This is not a serious drawback both because the bending tests will be used to check the material model derived from other test results and because by inverse methods these properties could be obtained.
0 20 40 60 80 100 120
0% 25% 50% 75%
S
tr
ess
(
MP
a)
Strain
KM‐01
KM‐02
KM‐03
KM‐04
KM‐05
KM‐07
KM‐08
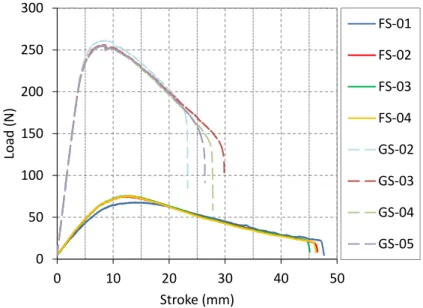
Latin American Journal of Solids and Structures 11(2014) 200 - 222 Figure 11 Results from the four-point bending tests of the solid material: FS-01 to FS-04; specimen with 1/8” thickness; GS-02 to GS-05,
specimen with 1/4” thickness.
The influence of the thickness, doubled from the FS-xx specimen (1/8” or 3.175 mm) to the GS-xx specimen (1/4” or 6.35 mm), is less than expected: the stiffness of the thicker specimen being theoretically eight times the stiffness of the thinner specimen, experimentally a ratio of 6.4 is ob-served. This result holds for both the solid material and the microcellular foam. The maximum bending load is instead augmented by four when the thickness is doubled.
Figure 12 Results from the four-point bending tests of the microcellular foam: FM-01 to FM-04; specimen with 1/8” thickness; GM-01 to GM-04, specimen with 1/4” thickness.
0 50 100 150 200 250 300
0 10 20 30 40 50
Load
(N
)
Stroke (mm)
FS‐01
FS‐02
FS‐03
FS‐04
GS‐02
GS‐03
GS‐04
GS‐05
0 50 100 150 200 250 300
0 10 20 30 40 50
Load
(N
)
Stroke (mm)
FM‐01
FM‐02
FM‐03
FM‐04
GM‐01
GM‐02
GM‐03
Latin American Journal of Solids and Structures 11(2014) 200 - 222 3.6 Lateral plate impact
The impact test by means of a falling dart is a common test to check the dynamic strength of plas-tics. In this case the sample is loaded neither in stroke control nor in force control, since it is the dynamic of the system that is controlling the evolution of the stroke and of the obtained force. Therefore, even unexpected results can occur. This depends from the fact that with a given amount of energy of the impactor it is possible to have sometimes complete penetration of the sample or not in other repetitions of the same test. This is related to the scatter in the material strength, both in terms of maximum allowable stress and of elongation at fracture.
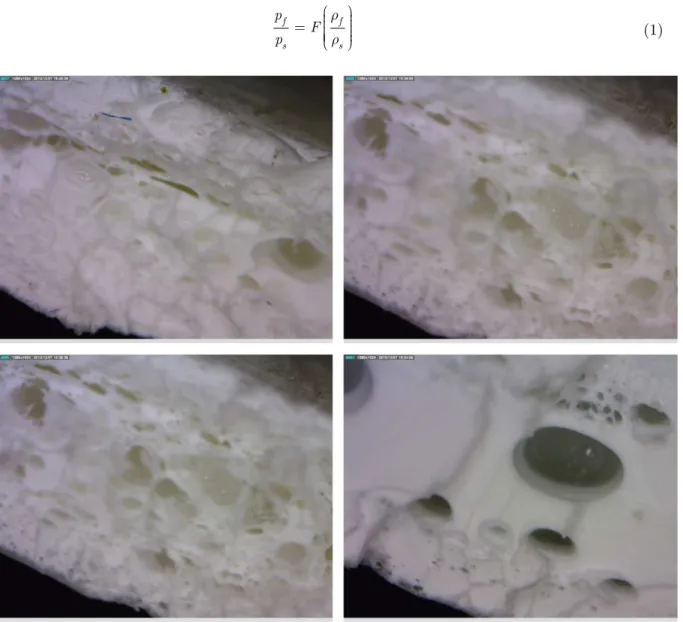
This result is shown in Figure 13 for the solid material and in Figure 14 for the microcellular foam. Figure 13 reports the results with three different falling heights. Comparing the three charts of Figure 13, it appears that even with largely different amounts of energy there is a random transi-tion from penetratransi-tion to containment of the falling dart. This does not appear at the highest falling level (1500 mm) in both the solid material and the microcellular foam. Penetration or no-penetration results can be observed in the images reported in Figure 15, for the solid ABS material. In Figure 16 the images from samples of microcellular foams are shown: in this case the fracture develops in the perpendicular directions, differently from the case of the solid material. This remark, together with the observation of a fractured surface from a microcellular foam sample (Figure 17), justifies the dramatic reduction in strength, and energy absorption, of the foam noticed in Figure 14.
Figure 13 Results from the lateral impact test on the solid ABS material: DS-09 to DS-11, falling height 500 mm; DS-06 to DS-08, falling height 1000 mm; DS-03 to DS-05, falling height 1500 mm.
0 1000 2000 3000 4000 5000 6000
0 10 20 30
Load
(N
)
Stroke (mm) DS‐09
DS‐10
DS‐11
0 1000 2000 3000 4000 5000 6000
0 10 20 30
Load
(N
)
Stroke (mm) DS‐06
DS‐07
DS‐08
0 1000 2000 3000 4000 5000 6000
0 10 20 30
Load
(N
)
Stroke (mm) DS‐03
DS‐04
Latin American Journal of Solids and Structures 11(2014) 200 - 222 Figure 14 Results from the lateral impact test on the microcellular ABS foam: falling height 1500 mm.
Figure 15 Samples of solid ABS material after lateral drop test with the dart falling from a height of 1000 mm: samples 06 and DS-07 fractured during the impact with less energy absorption.
Figure 16 Samples of microcellular ABS foam after lateral drop test with the dart falling from a height of 1500 mm: all the samples fractured.
0 1000 2000 3000 4000 5000 6000
0 10 20 30
Load
(
N)
Stroke (mm) DM‐01
DM‐02
Latin American Journal of Solids and Structures 11(2014) 200 - 222
Figure 17 View of the fractures surface of a microcellular sample after the lateral drop impact test: great inhomogeneity is observed in this foamed material.
3.7 Experimental results evaluation
From the analysis of §3 it is clear that the density plays a major role in the microcellular foam ma-terials performance, and that dependence from the density has to be carefully analyzed. Analyses in terms of the relative strength variation vs. the relative density are reported in the following figures, from Figure 18 to Figure 20. The charts reports results from the tension, compression, and bending tests; the results from the lateral impact tests are not reported since such a strong reduction in the properties was observed in the previous section. This is mainly due to the reduction in the elonga-tion at fracture.
Latin American Journal of Solids and Structures 11(2014) 200 - 222 Figure 19 Relative variation of yield strength (left) and of the absorbed energy (right) at 55% compression strain, as a function of the
relative density for the analyzed ABS microcellular foam; the two loading directions are compared.
Figure 20 Relative variation of strength as a function of the relative density for the analyzed ABS microcellular foam in bending condi-tions; the two thicknesses are compared in the figure.
ap-Latin American Journal of Solids and Structures 11(2014) 200 - 222
proximation, from literature results, as was reported in Figures 2 and 3, is also shown. From this, it appears that the current microcellular foam has a relatively low strength, less than what expected with a purely parabolic dependence: this is even lower than in the case of a power approximation with an exponent 3/2 typical of the strength of open-cell foams.
Similar results can be found for compression, especially when loading along the transverse direc-tion: in this case, however, there is also a strong reduction in strength due to the orthotropic behav-ior of the material. This is clear from the observation of the compressed samples in Figure 21. Cata-strophic failure and fragmentation of the samples is evident.
For bending the behavior is instead more compliant with the theoretical analysis, and the exper-imental results, for both thicknesses, lie within the two limit curves. This is probably due to the fact that in bending lowest deformation and stress occurs during the tests (fracture is not attained).
Figure 21 Microcellular foam samples loaded on the largest (KM-01 to KM-06) and smallest side (KM-07 to KM-09). 4 CONCLUSIONS
The paper reported the results of a large experimental campaign on structural microcellular ABS foam. Microcellular foams are a promising solution to reduce weight of some safety devices and packaging components without losing structural properties.
The performed tests included tension and compression, bending, and lateral impact by means of a falling weight. Tension tests were conducted at various speeds to study the effect of strain-rate on the mechanical behavior. The impact tests will be used to verify models and simulations of this material, and in particular to check how the influence of the loading speed is modeled. Compression tests were performed along different loading directions and anisotropy was shown from these results. Moreover, a relatively high scatter in the experimental results was found and this can be related to the inhomogeneity observed in the foamed material: in fact, the distribution of cell size and shape is far from regular and repeatable.
Latin American Journal of Solids and Structures 11(2014) 200 - 222 is not usually clear. In many cases, as shown, the lighter the better, in other situations a foam is not more convenient.
Modeling of the microcellular foam material, and verification of the adopted models, will be pos-sible based on the current results, and will be presented in a companion paper.
Acknowledgements The financial support of the Piemonte Regional Government made this work possible, within the project “MAESTRU”, Regional Call POR-FESR 2007/2013 “Competitività re-gionale e occupazione”, Asse I Innovazione e transizione produttiva – Activity I.1.3 Innovazione e P.M.I. - Aiuti ai soggetti aggregati ai poli di innovazione, 2009. This financial support is greatly acknowledged.
References
Ampacet glossary, 2011. www.ampacet.com/EN/global/glossary.html. Classxboats glossary, 2011. www.classxboats.com/htdocs/Glossary.htm.
Armstrong, W.D., Kumar, V. (2000). A stress and relative density-dependent dynamic compliance spectra model of the creep response on microcellular polycarbonate. Journal of Applied Mechanics 67: 663-665.
Barlow, C., Kumar, V. (2001). Impact strength of high density solid-state microcellular polycarbonate foams. Journal Engineering Material and Technology 123 (2): 229-234.
Beydokhti, K.K., Behravesh, A.H., Azdast, T. (2006). An experimental study on mechanical and microstructural properties of microcellular foams of ABS composites. Iranian Polymer Journal 15 (7): 555-567.
Bezazi, A., Frioui, N., Scarpa, F. (2011). Tensile static, fatigue and relaxation behaviour of closed cell electret PVDF foams. Mechanics of Material 43: 459-466.
Bureau, M.N., Kumar V. (2006). Fracture toughness of high density polycarbonate microcellular foams. Journal of Cellular Plastics 42: 229-240.
Demir, H., Sipahioğlu, M., Balköse D., Ülkü S. (2008). Effect of additives on flexible PVC foam formation. Jour-nal of Material Processing Technology. 195 (1-3): 144-153.
Gibson, L.J., Ashby, M.F. (1997). Cellular solids - structure and properties, Second ed., Cambridge University Press (Cambridge).
Kumar, V. (1993). Microcellular polymers novel materials for the 21st century. Progress in Rubber and Plastics Technology 9 (1): 54-70.
Kumar, V., Juntunen, R.P., Barlow, C. (2000). Impact strength of high relative density solid state carbon dioxide blown crystallizable poly(ethylene terephthalate) microcellular foams. Cellular Polymers 19 (1): 25-38.
Kumar, V., Nadella, K.V. (2004). Microcellular foams, in “Handbook on polymer foams”, RAPRA Technology (UK).
Kumar, V., Nadella, K., Branch, G., Flinn, B. (2004). Extrusion of microcellular foams using pre-saturated pel-lets and solid-state nucleation. Cellular Polymers 23 (6): 369-385.
Kumar, V., Suh, N.P. (1990). A process for making microcellular thermoplastic parts. Polymer Engineering and Science 30: 1323-1329.
Kumar, V., Van der Wel, M., Weller, J.E., Seeler, K.A. (1994). Experimental characterization of the tensile be-havior of microcellular polycarbonate foams. ASME Journal of Engineering Material and Technology 116: 439-445.
Latin American Journal of Solids and Structures 11(2014) 200 - 222
Kumar, V., Weller, J.E., Ma, M., Montecillo, R. (1998). The effect of additives on microcellular PVC foams part II - tensile behavior. Cellular Polymers 17 (5): 350-361.
Kumar, V., Weller, J.E., Montecillo, R. (1992). Microcellular PVC, Proceedings of Antec 92, pp. 1452-1456. Murray, R.E., Weller, J.E., Kumar, V. (2000). Solid-state microcellular acrylonitrile butadiene styrene foams. Cellular Polymers 19 (6): 413-425.
Nadella, K., Kumar, V. (2007). Tensile and flexural properties of solid-state microcellular ABS panels. In: Exper-imental analysis of nano and engineering materials and structures, Springer, pp. 765-766.
Nadella, K., Kumar, V., Li, W. (2005). Constrained solid-state foaming of microcellular panels. Cellular Polymers 24 (2): 71-90.
Nabhani, F., Bamford, J. (2002). Mechanical testing of hip protectors. Journal of Material Processing Technolo-gy. 124 (3): 311-318.
Pasricha, A., Wing, G., Kumar, V., Tuttle, M. (2005). Effect of CO2 sorption and desorption on the creep re-sponse of polycarbonate. Polymer Engineering & Science 45 (12): 1639-1644.
Peroni, L., Avalle, M., Belingardi, G. (2009). Comparison of the energy absorption capability of crash boxes as-sembled by spot-weld and continuous joining techniques. International Journal of Impact Engineering 36: 498-511.