A
rti
g
o
*e-mail: [email protected]
VOLTAMMETRIC DETERMINATION OF SIBUTRAMINE IN BEVERAGES AND IN PHARMACEUTICAL FORMULATIONS
Juliana M. Carvalho, Andrea R. da Silva, Alessandra L. M. C. da Cunha e Ricardo Q. Aucélio*
Pontifícia Universidade Católica do Rio de Janeiro, Rua Marquês de São Vicente, 225, 22453-900 Rio de Janeiro - RJ, Brasil
André Luis M. Alberti e Katia C. Leandro
Departamento de Química, Instituto Nacional de Controle de Qualidade em Saúde, Fundação Oswaldo Cruz, Av. Brasil, 4365, 21040-360 Rio de Janeiro - RJ, Brasil
Recebido em 6/10/11; aceito em 30/11/11; publicado na web em 23/1/12
A simple and sensitive method has been proposed for the determination of sibutramine-HCl in energy drinks, green tea and pharmaceutical formulations using differential pulse voltammetry performed on a hanging mercury drop electrode. In the chosen experimental condition (Mcllvaine pH 4.0 buffer, 50 mV pulse amplitude and 40 mV s-1 scan velocity), sibutramine-HCl presented a reversible behavior and a peak maximum at –80 mV. Detection limit was 0.4 mg L-1 and the working linear range extended up to 33.3 mg L-1 (r = 0.99). Analysis of real and fortiied samples enabled recoveries between 91 and 102%. The electroanalytical method was compared with a HPLC method which indicated it accuracy.
Keywords: sibutramine; differential pulse voltammetry; pharmaceutical formulations.
INTRODUCTION
Obesity is a complex condition with serious social and psycho-logical dimensions that affects virtually all age and socioeconomic groups in both developed and developing countries.1 The health
impact of overweighting is so marked that obesity has now been classiied as a major global public-health problem.2 The World
Health Organization projects 700 million adults will be clinically obese by 2015 and at an increased risk of developing other chronic diseases such as diabetes mellitus type II, coronary heart disease, hypertension, and various types of cancer.3 A drug therapy might
be considered if obesity persists despite diet, physical exercise and modiication if life-style.
Drugs used to aid in weight loss can be divided into two cate-gories based of their mechanisms of action: appetite suppressants and lipase inhibitors.4 Appetite suppressors are no longer indicated
due to its high potential to drug dependency. 5-hydroxytryptamine reuptake inhibitors such as fenluramine and dexfenluramine were approved for obesity, but they were immediately withdrawn from the market because they were associated with pulmonary hyper-tension and increasing of the incidence of heart valve disease. Sibutramine, N -(1-(1-(4-chlorophenyl)-cyclobutyl)-3-methylbutyl)-N,N-dimethylamine, is a serotonin and noradrenalin reuptake inhi-bitor5,6 currently used as an anti-obesity drug in the hydrochloride
form.Sibutramine increases concentrations of HDL-cholesterol and lower triglycerides-levels, but can raise blood pressure and pulse rate.7,8 Because of these collateral effects, the illicit addition
of sibutramine in energy drinks has been reported. The LD50 for sibutramine is 64 mg kg-1 (oral uptake in mouse).9 In 2010,
sibutra-mine was removed from the European market, based on new data from the Sibutramine Cardiovascular Outcomes Trial (SCOUT), which demonstrated an increased risk of non-fatal cardiovascular events, such as stroke or heart attack,8,10 therefore, the Agency’s
Committee for Medicinal Products for human use has concluded that any beneit brought by the use of sibutramine do not compensate the risks imposed to the patients.11,12 In this same year, the U.S. Food
and Drug Administration recommended against prescription and use sibutramine based medicines and requested the withdraw of products containing this drug from the United States market.13 Based on the
SCOUT results, the Brazilian National Agency of Sanitary Vigilance published the RDC n.25, allowing the prescription of sibutramine for the treatment obesity for no longer than 60 days and limited in 15 mg the maximum daily dose of the drug.12
The public has also been looking for alternative sliming treat-ments that include phytotherapy such as the so called green teas. Upon promises of fast and effective weight loss offered by the suppliers, the presence of non-declared synthetic substances (adulterants) in the phytotherapic products has been increased. However, such practice violates the laws of most of the countries. Due to its anti-depressant and appetite inhibition properties, sibutramine may be fraudulently included in commercial energy drinks and in diet-oriented green tea commercial formulations, therefore, this is a serious public health problem. In fact the Brazilian National Agency of Sanitary Vigilance (ANVISA) has reported cases of adulteration of athlete food and complements beverages.14
The United State Pharmacopoeia does not indicate an oficial method for the quantiication of sibutramine hydrochloride mono-hydrate, but a few methods have been described in the literature using high performance liquid chromatography with UV photometric15
and mass spectrometric detection,16,17 capillary electrophoresis with
UV detetion,7,18 UV absorption spectrophotometry19 and infrared
spectroscopy.20
Voltammetric methods enable the sensitive and selective measu-rement of organic compounds based on their speciic electrochemi-cal behavior at the working electrode surface.21,22 Electrochemical
methods are advantageous if the selectivity achieved eliminates the need for separation procedures, which simpliies procedures, enables short analysis times and lower cost of analysis by using a relatively cheaper instrument and less consumables.23
EXPERIMENTAL
Instrumentation
Voltammetric measurements (diferential pulse voltammetry) and mechanism studies (using square wave voltammetry) were carried out with a model 757 VA Metrohm attached to a multi-electrode system formed by a mercury working electrode (HMDE) with 0,3187 mm2 surface area, an auxiliary electrode (platinum wire) and
a reference electrode Ag/AgCl (KCl 3 mol L-1). The digital
analyti-cal balance (AG 285 model, 0.01 mg sensitivity) of Mettler Toledo was used for weighing standards and samples. Chromatographic measurements were performed on a Waters chromatograph with UV-vis absorption photometric detector (wavelenght set a 230 nm). The chromatographic column was a C8 (250 x 4 mm and 5 nm average particle size) placed inside an oven with temperatures set at 25 oC. Chromatograms were made using isocratic elution (1 mL
min-1) with mobile phase containing acetonitrile/0.05% triluoracetic
acid (70/30% v/v). Sample was prepared in methanol and injection volume was 15 μL. Under such conditions, analyte retention time was 2.8 min. Acid-base titrations were performed in a Metrohm Titration Automatic system with a combined glass electrode (KCl 3 mol L-1).
Solutions and reagents
Ultrapure water was obtained from a water ultra puriication Milli-Q system from Millipore (Simplicity model 185). Analytical grade (glacial acetic acid, phosphoric acid, boric acid, sodium chloride and citric acid, sodium hydroxide, potassium hydroxide, potassium nitrate, potassium acid phthalate, sodium acetate and methanol) were from Merck (Darmstadt, Germany). Sibutramine hydrochlori-de standard was obtained from Abbott Ireland Pharmaceutical with 99.6% purity.
Mcllvaine pH 4.0 buffer was prepared mixing 0.2 mol of Na2HPO4
and 0.1 mol of citric acid with water to obtain 1 L volume of solution. Britton-Robinson buffer (0.1 mol L-1) was prepared by mixing 0.1 mol
acetic acid, 0.1 mol boric acid and 0.1 mol phosphoric acid with water to obtain 1 L volume of solution. The pH of these buffers was adjusted by the addition of aliquots of sodium hydroxide solution 2 mol L-1. Samples
Medicine samples from three different laboratories were used: Biomag (similar medicine containing either 10 or 15 mg of the analyte/capsule) from Aché laboratories from which were taken two samples each one from a different lot, sample 1 (15 mg of sibutramine-HCl) and sample 2 (10 mg of sibutramine-HCl); Vazy (similar medicine containing 15 mg of the analyte/capsule) from Sigma Pharma laboratories which was named sample 3; and Chloridrato de sibutramina (generic medicine containing 15 mg of the analyte/capsule) from Sandoz, which was named sample 4. Seven independent subsamples were prepared for each one of the different lots and analyzed using both the proposed method and a HPLC method. Samples were prepared weighing an appropriate amount of sample and dissolving it in deionized water (for DPV) or in methanol (for HPLC). The sample was left in ultrasonic bath for 10 min.
Three different brands of commercial energy drink (E1, E2 and E3) and two brands of green tea (T1 and T2) were fortiied with sibutramine and analyzed by differential pulse voltammetry (DPV). Volumes (750 µL) of these samples were added directly into the su-pporting electrolyte (Mcllvaine buffer) in the electroanalytical cell.
Voltammetric measurements
A 10 mL volume of the supporting electrolyte solution (Mcllvaine buffer pH 4, 0.1 mol L-1) was transferred to the working borosilicate
cell and then purged with nitrogen for 1500 s (and for 20 s before each adsorptive cycle). Analyte determinations using differential pulse technique were performed by scanning the potential from +170 to -70 mV. Volumes of samples (750 µL) were placed in the electrochemical cell containing the supporting electrolyte. The solution was stirred (30 s) and then stopped 15 s (equilibrium time) before recording the voltammograms (scan rate of 40 mV s-1 and pulse amplitude of 50
mV). Cycles were repeated with a fresh medium size mercury drop, chosen because of the better precision of results. All reported values (signal intensities and maximum potentials) were calculated based on the average of at least three replicate measurements. Cyclic vol-tammograms were obtained by irst using a direct scan from +200 to -600 mV and then reversing the direction (inverse scan) from -600 to +200 mV.
Determinations in green tea and energy drink were made by analyte addition technique while the pharmaceutical formulations were analyzed using an external analytical curve.
Acid-base titrations
For titration studies, 10 mL KNO3 1.2 mol L
-1 and 10 mL H 2O was
added into a cell, kept at 25 oC, containing 100 mL of sibutramine 10-3
mol L-1 solution. The titration was made with a 0.100 mol L-1 KOH. RESULTS AND DISCUSSION
Optimization of experimental conditions
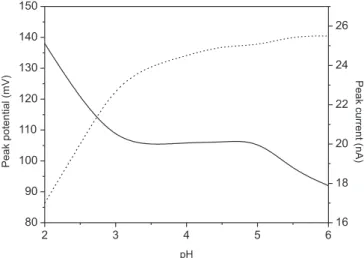
Preliminary studies were performed in order to ind a suitable supporting electrolyte for sibutramine-HCl using the HMDE. Britton-Robinson buffer was irst studied since this buffer offered the possibi-lity to study a wide pH range (2-12), allowing search the most suitable pH to observe the sibutramine-HCl voltametric signal. For pH values higher than 6, no signal characteristic of the analyte was observed. In the acid pH range, the magnitude of the signal was almost invariable in the pH range between 3.0 and 6.0 with analyte peak maximum varying from -139 mV (pH 2) to -92 mV (pH 6) remaining constant at 107 mV between pH 3 and 5 (Figure 1). Analyte peak with a better shape (symmetric and with smaller width at half maximum) and a smaller background noise were obtained using the supporting electrolyte at
pH 4.0. In addition, the shift in peak potential was constant between pH 3.0 and pH 5.0 which means that the choice of pH 4.0 produced a robust condition with respect to the peak potential.
The evaluation of the analytical response of sibutramine-HCl in other pH 4 buffered systems was done using Mcllvaine buffer, acetate buffer and potassium hydrogen phthalate buffer. The best results have been achieved with Mcllvaine buffer (pH 4.0) since it enabled a peak at least 1.4 times more intense than the ones achieved with the others buffer as well as a lat and low baseline proile, as can be seen in Figure 2. Therefore, Mcllvaine buffer pH 4.0 was chosen as the supporting electrolyte.
In order to improve signal, different scan velocities (from 10 to 50 mV s-1) were tested, indicating results (current values and peak
width) practically constant in the tested range. The chosen scan velocity was 40 mV s-1, since it would provide fast scan and lead
to a robust parameter within the tested range. Pulse amplitude was evaluated from 10 to 100 mV. Although the magnitude of the fara-daic current increased with increasing of pulse amplitude, a shift in the anodic peak potential is observed and a signiicant increasing in peak width at the half of the maximum current (∆Ep/2) is achieved.
Therefore, a compromise between the peak intensity and the peak width was found using 50 mV pulse amplitude, which enabled a peak maximum at -80 mV.
Mechanism insights based on cyclic voltammetry, square-wave voltammetry and acid-base chemistry
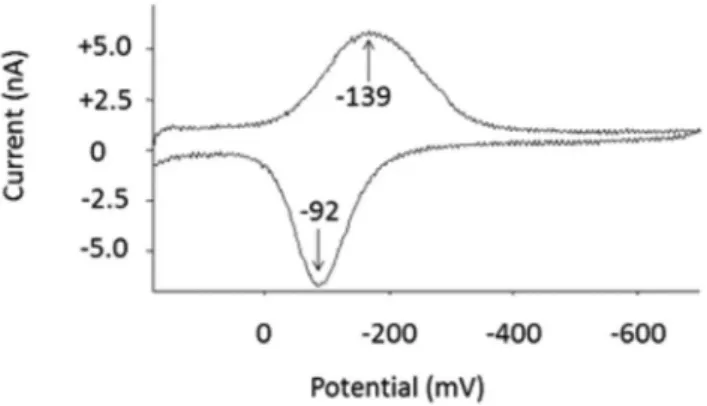
Cyclic voltammetry was performed in order to study the electro-chemical behavior of sibutramine-HCl. The study was made using pH 4.0 Mcllvaine buffer and 50 mmol L-1 ofsibutramine-HCl (Figure
3). The voltammogram presented a reversible behavior with the ratio between the peak current for the cathodic process (-8.2 nA) and the peak current for the anodic process (7.9 nA) close to unity (1.04). In addition, it is observed that the difference between the cathodic peak potential (Epc = -132 mV) and the anodic peak potential of the
reverse scan (Epa = -73 mV) is 59 mV. Such results are indicative of
a reversible one electron transfer mechanism (Er). 24
Insights on the mechanism were also obtained using square wave voltammetry.25 For equivalent concentrations of sibutramine-HCl,
SWV produced peak current intensities about two times the one achieved using DPV as indicated by the ratio between the angular coeficient of the analytical curves obtained by SWV (mSWV = 4.8)
and by DPV (mDPV = 2.1). This is characteristic of reversible systems
with adsorption of the product on the electrode. The reversibility of
the process was also indicated by the linear correlation (R2 = 0.996)
between the increase of the peak current in function of the square--root of the increased applied frequency (from 10 to 50 Hz). SWV studies also showed the independence of the Ep/2 value in function of
both the pulse amplitude (between 10 and 40 mV) and the frequency (between 10 and 60 Hz) which are also in agreement with the behavior of reversible systems. The lack of any linear adjustment between peak potencial and the applied frequency (in the range from 10 to 60 Hz) indicates a mechanism involving the adsorption of both the reagent and the product. This adsorptive mechanism is also conirmed as the peak current linearly (R2 = 0.986) increases in function of the
applied pulse amplitudes up to 60 mV. The increasing in Ep/2 and
the constant values of peak currents for applied pulse amplitudes larger than 60 mV is also in agreement with the adsorption of both the reagent and the product.
Sibutramine-HCl is the marketed form of the drug because of its higher solubility in water. In this form, the tertiary amine shares its non-bonding electron pair with an H+ forming an ammonium
qua-ternary cation (conjugate acid of sibutramine). The titration of a 1.0 x 10⁻³ mol L-1 sibutramine-HCl solution with a strong base indicated
pKa value of 6.6 (pKb value of 8.4, which is close to the 8.5 reported
in the literature).21 This result shows that an insigniicant fraction
(less than 0.5%) of the drug is not protonated in aqueous solution at pH 4. Therefore, it is expected that the ammonium quaternary cation of sibutramine in the solution-electrode interface is adsorbed at the surface of the mercury electrode where it is easily transformed to the less soluble sibutramine at small negative potentials (Figure 4). The process is easily reversed as the inverse scan of potentials is applied. As sibutramine-HCl is an ammonium quaternary salt with no possible resonance structures (due to the lack of nearby groups containing sp2 orbitals, which would favor the deslocalization of electrons)26 no
further reaction can occur.
In order to take advantage from the adsorption of the analyte on the surface of the electrode, studies were carried out aiming to pre-concentrate sibutramine-HCl. Mcllvaine buffer (pH 2.0 to 5.0) as well as in Britton-Robinson buffer (pH 2.0 to 6.0) were used. Hydrochloric acid 0.1 mol L-1 and sulfuric acid 0.1 mol L-1 were
also used as supporting electrolytes in these attempts, however, no Figure 2. Voltammetric peak profiles (differential pulse) of sibutramine-HCl
in (A) Mcllvaine buffer pH 4; (B) Mcllvaine Britton-Robinson pH 4; (C) potassium hydrogen phthalate pH 4; (D) acetate buffer pH 4
Figure 3. Cyclic voltammograms of sibutramine 0.05 mmol L-1 (Mcllvaine buffer pH 4.0)
success was achieved by applying potentials between 300 and 0 mV from 20 to 100 s.
Analytical figures of merit
Sibutramine-HCl analytical curve was constructed using DPV with the HMDE as the working electrode, Mcllvaine pH 4.0 buffer, 50 mV amplitude and 40 mV s-1 scan velocity. The linear range of
analytical response was from 1.4 mg L-1 (5 mmol L-1) to 33.3 mg
L-1 (118 mmol L-1) with homocedastic behavior indicated by the
random dispersion of results in the residual plots. In the chosen analytical working range (7.3 and 33.3 mg L-1), the determination
coeficient (R2) was 0.9994 with analytical curve equation of Y (nA)
= (2.1 ± 0.1) X (mg L-1) – (2.3
± 5.6). Linearity was conirmed by statistical Student-t test. In Figure 5, a sequence of voltammograms of sibutramine-HCl at the chosen working concentration range is shown. Limit of detection (LOD) of 0.4 mg L-1 (1.3 mmol L-1) was
calculated as the concentration of analyte that enabled a signal three times the standard deviation of the blank (3sb). The 3sb value was
obtained from the standard deviation of ten measurements on a low sibutramine concentration point of the analytical curve (2.0 mg L-1).
The analyte peak corresponding to the LOD was actually identiied by the instrument software. The limit of quantiication (LOQ), calculated using 10sb,was 1.4 mg L
-1 (5 mmol L-1).
Tests using the analytical curve, enabled recovery values of 95, 98 and 104% (n=3) respectively for standard solutions of sibutramine hydrochloride (controlled samples) at three different levels (8, 20 and 33 mg L-1).
Pharmaceutical sample analysis by DPV and HPLC
In order to evaluate the potential interference from the matrix of the sibutramine-HCl pharmaceutical formulations, several substances were studied by adding a larger amount of each of them in the analytical cell were the signal from one standard solution of sibutramine-HCl
was measured. This signal was compared to the value of the standard solution of sibutramine-HCl measured from a cell in the absence of the potential interferent. Several substances were tested at concentration levels 10 and 50 times higher than that of sibutramine-HCl. Sucrose, sorbitol and sodium glutamate did not impose any interferences at the two concentration levels using the established experimental conditions set for the determination of sibutramine-HCl. Histidin and lactose caused no intererence when present in concentrations 10 times higher than the one of the analyte. However, at concentrations 50 times hi-gher, a decreasing of the analyte signal (about 20%) was imposed by phenylalanine when compared to the sibutramine-HCl signal measured in absence of these concomitant substances. However such type of interference can be easily corrected by using the standard additions method when quantifying the analyte. When measurements were made in the presence of phenylalanine, the sibutramine-HCl voltammetric signal was completely eliminated even when phenylalanine is present at the lower concentration level tested.
Pharmaceutical formulation solutions of sibutramine-HCl were prepared using a pool of capsules and the analyte content was deter-mined using the proposed method and using a HPLC based method. The results in Table 1 indicated relative standard deviations no higher than 6% (n = 7) for the DPV method. When the analysis results are compared with the nominal values of sibutramine-HCl in the pharma-ceutical formulations, the recoveries varied from 92 to 100%, which are within the acceptable recovery range (from 90 to 110%) indicated in the United States Pharmacopoeia. In addition, the t-test (two-sided) was performed to compare the analytical results achieved with the proposed method with the ones achieved using HPLC. No statistical differences (at a 95% conidence level) were found indicating the adequate performance of the DPV method.
Analysis of beverages
The DPV proposed method was also used to quantify sibutramine-HCl in beverages. Energy drinks and commercial green tea (as a ready to drink liquid beverage) were fortiied with sibutramine-HCl (200 mg L-1) and analyzed. In order to evaluate the interference from
the sample matrices, the standard addition curve made in a cell con-taining a volume of the sample (energy drink or tea) was compared to a standard addition curve made in a cell only containing the supporting electrolyte. The sensitivities of the curves obtained in the presence of the energy drink (m = 1.6 nA L mg-1) and of the tea (m = 1.4 nA L
mg-1) was smaller than the one achieved in the cell without samples
(m = 2.1 x 10⁻⁶ nA L g-1). The result indicated that the complexity of
Table 1. Sibutramine recovery results from the analysis of pharmaceutical
formulations using DPV and HPLC Sample Recoveries using DPV
mass per tableta,b (percent recovery)
Recoveries using HPLC mass per tableta,b (percent recovery)
tcalculated c
1 14.1 ± 0.4 mg (94%)
13.6 ± 0.5 mg (90,7%)
2.00
2 9.9 ± 0.4 mg (99%)
10.0 ± 0.5 mg (100%)
0.40
3 14.2 ± 0.3 mg (94.7%)
14.0 ± 0.3 mg (93.3%)
1.24
4 13.6 ± 0.5 mg (90.7%)
14.3 ± 0.6 mg (95.3%)
2.37
aBased on the reported value of each pharmaceutical formulation: 10 mg/ tablet (samples 1 and 4) and 15 mg/tablet (samples 2,3 and 5). bConidence interval based on 95% conidence level and n = 7. cTwo-sided Student t-test at 95% conidence level comparing the result obtained with DPV with the one achieved with HPLC.
the sample matrices imposed a certain degree of interference in the voltammetric measurements, which, in turn, because of the type of the interference that decreases the analyte signal, it could be circum-vented by the use of the standard addition method for the analysis. In order to verify the accuracy of the method, all samples were also analyzed using the HPLC based method. Recoveries obtained from the energy drink samples (E1, E2 and E3) were between 96 and 101.3% and for green tea samples (T1 and T2) the recovery results were between 98 to 102.2% as indicated in Table 2. Statistical t-test indicated that the results achieved by DPV are equivalent to the ones achieved by HPLC.
CONCLUSION
The proposed differential pulse voltammetric method was adequate for the determination of sibutramine as indicated by the results achieved in the analysis of pharmaceutical formulations and beverages. Interferences observed in the analysis of beverages could be eliminated by using the standard addition method, quantiication procedure that is suitable and usual in voltammetric determinations. The proposed method presented some advantages over the traditional methods based on liquid chromatography, enabling fast analysis that do not requires sample preparation and the use of expensive supplies such columns, ilters and HPLC-grade solvents. In addition, DPV employs less expensive equipment that in some cases allows the automatization of the method for routine analysis.
ACKNOWLEDGEMENTS
The following scholarships are acknowledged: CNPq (R. Q. Aucélio and J. M. Carvalho), FAPERJ (R. Q. Aucélio) and CAPES-PNPD project (A. R. da Silva). The authors thank scientiic funding from FINEP-MCT, CNPq and FAPERJ.
REFERENCES
1. http://www.who.int/nutrition/topics/obesity/en/index.html, accessed January 2012.
2. Warren, E.; Brennan, A.; Akehurst, R.; Med. Decis. Making2004, 24, 9. 3. Bello, N. T.; Liang, Nu-Chu.; Drug Design, Development and Therapy
2011,5, 95.
4. Snow, V.; Barry, P.; Fitterman, N.; Qaseem, A.; Weiss, K.;Ann. Internal Med.2005, 142, 525.
5. Heal, D. J.; Cheetham, S. C.; Prow, M. R.; Martin, K. F.; Buckett, W. R.; Br. J. Pharmacol. 1998, 125, 301.
6. Zu, H.; Wu, H.; Chen, J.; Men, C.; Jang, Y.-S.; Kang, W.; Choi, J. K.; Lee, W.; Kang, J. S.; Bull. Korean Chem. Soc. 2010, 31, 6.
7. Amundsen, M. O.; Engdahl, B.; Berg, C.; Nordeng, H.; Pharm. World Sci.201032, 752.
8. Rucker, D.; Padwal, R.; Li, S. K.; Lau, D. C.; Br. Med. J. 2007, 335, 1194.
9. http://www.usp.org/pdf/EN/referenceStandards/msds/1612845, accessed January 2012.
10. http://www.ema.europa.eu/ema/index.jsp?curl=pages/medicines/human/ referrals/Sibutramine/human_referral_000219.jsp&murl=menus/ regulations/regulations.jsp&mid=WC0b01ac0580024e9a, accessed January 2012.
11. http://www.fda.gov/Drugs/DrugSafety/ucm228746.htm., accessed January 2012.
12. http://portal.anvisa.gov.br/wps/portal/anvisa/imprensa/!ut/p/c4/04_SB 8K8xLLM9MSSzPy8xBz9CP0os3hnd0cPE3MfAwMDMydnA093 Uz8z00B_A3dLE_2CbEdFAJSoWeQ!/?WCM_PORTLET=PC_7_ CGAH47L0006BC0IG5N65QO0OM4_WCM&WCM_GLOBAL_ CONTEXT=/wps/wcm/connect/anvisa/anvisa/sala+de+imprensa/ noticias/anvisa+esclarece+nova+resolucao+sobre+sibutramina, accessed January 2012.
13. http://www.fda.gov/Drugs/DrugSafety/ucm228746.htm, accessed January 2012.
14. http://www.anvisa.gov.br/divulga/noticias/2007/150607_2.htm, accessed January 2012.
15. Diefenbach, I. C. F.; Friedrich, M.; Santos, M. R.; Bittencourt, C. F.; J. AOAC Int.2009, 92, 148.
16. Satoshi, I.; Shiori, M.; Mitsunorio, O.; Osamu, E.; Gen, S.; J. Health Sci.
2009, 55, 183.
17. Chen, Y.; Zhao, L.; Lu, F.; Yu, Y.; Wu, C. Y.; Food Addit. Contam., Part A2009, 26, 595.
18. Carvalho, L. M.; Martini, M.; Moreira, A. P.; Garcia, S. C.; Nascimento, P. C.; Bohrer, D.; Microchem. J.2010, 96, 114.
19. Obreshkova, D.; Peykova, L.; Bulgarian Academy of Sci.2010, 63, 1137. 20. Lu, F.; Li, S.; Le, J.; Chen, G.; Cao, Y.; Qi, Y.; Chai, Y.; Wu, Y.; Anal.
Chim. Acta2007, 589, 200.
21. Carvalho, L. M.; Martini, M.; Moreira, A. P. L.; Lima, A. P. S.; Correia, D.; Falcão T.; Garcia, S. C.; Bairros, A. V.; Nascimento, P. C.; Bohrer, D.; Forensic Sci. Int. 2011,204, 6.
22. Carvalho, L. M.; Nascimento, P. C.; Bohrer, D.; Correia, D.; Bairros, A. V.; Pomblum, V. J.; J. Braz. Chem. Soc.2007, 18, 789.
23. Noh, K.; Bae, K.; Min, B.; Kim, E.; Kwon, K.; Jeong, T.; Kang, W.; Arch Pharm Res. 2010, 33, 267.
24. Grosser, D. K.; Cylic voltammetry: simulation and analysis of reaction mechanisms, 1st ed., Wiley-VCH: New York, 1993.
25. de Souza, D.; Machado, S. S. A.; Avaca, L. A.; Quim. Nova2003, 26, 8. 26. Cases, F.; Huerta, F.; Garcés, P.; Morallón, E.; Vázquez, J. L.; J.
Eletctroanal. Chem. 2001, 501, 186.
Table 2. Recovery results for sibutramine fortiied energy drinks (E) and
green tea (T) samplesa
Sample Recoveries using DPV concentrationb,c (percent recovery)
Recoveries using HPLC concentrationb,c (percent recovery)
tcalculated d
E1 192.3 ± 6.1 mg L-1 (96.1%)
199.4 ± 12.3 mg L-1 (99.7%)
0.90
E2 195.1 ± 6.0 mg L-1 (97.5%)
197.4 ± 6.5 mg L-1 (98.7%)
0.45
E3 198.7 ± 4.2 mg L-1 (99.3%)
202.5 ± 15.3 mg L-1 (101.2%)
0,41
T1 195.9 ± 8.4 mg L-1 (98%)
202.5 ± 5.4 mg L-1 (101.2%)
1.14
T2 204.3 ± 11.0 mg L-1 (102.1%)
200.1 ± 9.5 mg L-1 (100%)
0.50