A SMALL WORLD MODEL FOR THE SPREAD OF HIV INFECTION
Israel T. Vieira
1, Valter de Senna
2and Hernane B. de B. Pereira
3*Received December 4, 2008 / Accepted April 15, 2011
ABSTRACT.It has long been recognised that the structure of social networks plays an important role in the dynamics of disease propagation. The spread of HIV usually results from a complex network of so-cial interactions and other factors related to culture, sexual behaviour, demography, geography and disease characteristics, as well as the availability, accessibility and delivery of healthcare. The small world phe-nomenon has been used for representing social network interactions. It states that, given some random connections, the degrees of separation between any two individuals within a population can be very small. In this paper we present a discrete event simulation model which uses a variant of the small world network model to represent social interactions and the sexual transmission of HIV within a population. We use the model to demonstrate the importance of the choice of topology and initial distribution of infection, and capture the direct and non-linear relationship between the probability of a casual partnership (small world randomness parameter) and the spread of HIV.
Keywords: small world networks, HIV, Health care modelling.
1 INTRODUCTION
Social network theory focuses on understanding social structures and its consequences by using the relations between people as the unit of analysis where measurements are taken Moreno (1934). Social network analysis is used widely in the social and behavioural sciences as an abstract representation of interpersonal relationships that aid in the study of populations.
The spread of sexually transmitted diseases (STDs), particularly HIV, results from a complex network of social interactions, sexual behaviour, culture, demography, geography and disease characteristics, as well as the availability, accessibility and delivery of healthcare. Traditional
*Corresponding author
1School of Mathematics, Cardiff University, Senghennydd Road, CARDIFF, CF24 4AG. E-mails: [email protected] / [email protected]
2Programa de Modelagem Computacional, SENAI CIMATEC, Av. Orlando Gomes, 1845, Piat˜a, 41650-010 Salvador, BA, Brazil. E-mails: [email protected] / [email protected]
social network studies have been used to investigate static networks of tens, or in extreme cases, hundreds of vertices, but today with the availability of fast transport systems, powerful computers and mobile communications, people are no longer isolated by geographic boundaries. One now can gather and analyse data on a scale far larger than previously possible. It is not uncommon to see networks with thousands (Liljeroset al., 2001), millions (Newman, 2001) or even billions (Broderet al., 2000, Leskovecet al., 2008, Kwaket al., 2010) of vertices. This change of scale also requires a corresponding change in analytic approach.
The modelling of disease spread in social networks involves knowledge of both the nature of the infectious agent in question and the dynamics of its transmission through a medium or po-pulation after being initiated. A connection between the formulation of traditional mathematical models of diseases and those for social networks analysis can be established by comparing the stochastic-deterministic split in traditional models with that of sociometric-egocentric split in network analysis (Wasserman & Galaskiewicz, 1994). The stochastic formulations are like so-ciometric analysis, which model each individual node in a system and the links among them. In network analysis, such data are typically represented as a sociomatrix or sociogram. The deterministic formulations are like egocentric analysis, which divide the population into relati-vely homogeneous groups and map the average rates of contacts among them. These models are known as compartmental models in epidemiology, and such data are typically represented as a mixing matrix in network analysis.
The traditional sexual network analysis embodies the social structure by addressing issues of centrality, which individuals are best connected to others or have most influence; and connecti-vity, whether and how individuals are connected to one another through the network. However, traditional network analysts still have problems with how they view the world. In particular, there is no account of dynamics. Instead of thinking of networks as entities that evolve over time under the influence of social forces, network analysts have tended to treat them effectively as the frozen embodiment of those forces. Instead of regarding networks as merely the conditions through which influence propagates according to its own rules, the networks themselves are taken as a direct representation of influence (Watts, 1999). Unfortunately as experience tells us, both personal and social lives are always changing dynamically.
2 SMALL WORLD NETWORKS AND DISEASE SPREAD
Small world models were initially proposed by Watts & Strogatz (1998). Both Watts & Stro-gatz (1998) and Newman & Watts, (1999) used the spread of an infectious disease in order to investigate the functional significance of small world connectivity for dynamical systems, where they predicted that infectious diseases spread much more easily and quickly in a small world. In other words, information or disease spreading on a small world graph reaches a number of people which increases initially as a power of time, then changes to an exponential increase, and then flattens off as the graph becomes saturated. Since this initial work, a number of results about epidemics on a small world have appeared in the literature (Kuperman & Abramson 2001; Xu & Sui 2009), commonly using the original Watts model definition to represent the network structure, social interactions and the spread of diseases.
Mathematical models characterising the dynamics of STD transmission indicate that heteroge-neity in sexual activity allows them to persist even when the typical behaviour of the population would not support endemicity. This suggests that more attention should be focused on the pro-perties of the distribution of sexual activity within a population (Guptaet al., 1989; Morris & Kretzschmar, 1995; Kretzschmar, 2000). The nodal and edge properties such as gender, strength and duration of partnerships, frequency of intercourse, ethnicity and relationship status are vital for the formation of partnerships (Anderson & May, 1988; Kretzschmar, 2000). In addition, to deal with HIV models, other network properties like concurrency, which allows simultaneous partnerships to be formed, play a fundamental role in epidemics on social networks (Morris, 1997; Ghani & Garnett, 1998).
The original small world formulation suffers from some serious problems that render it unsuitable as a model of social networks. There are three main limitations to the model, when dealing with social network interactions and the spread of infectious diseases:
1. No vertex properties. The vertices are equally considered for rewiring or shortcuts, unlike the real world, as the level of interaction that an individual possesses will not be the same as for other individuals;
2. They do not characterise the ties/link properties of edges, essential to capture the social behaviour of an individual within the network;
3. Connections are equally weighted or strongly connected.
In order to accommodate differential selectivity (vertex properties), sexual contacts behaviour (edge properties), and network properties such as concurrency, fundamental for the modelling of human sexual contact networks and the spread of HIV, we had to modify the original Watts & Strogatz (1998) topological model as follows:
• The connectedness restriction to evaluate the mean geodesic length was relaxed (Vieira, 2005);
• Conditions that two vertices must hold in order to be connected have been added;
The suggested modification of the small world network model, allows both geographical and social distances to be taken into account as part of the dynamics of social interactions. Actors are uniquely represented by their personal and social characteristics within the system; they can choose their partners and have different sexual behaviour when in a partnership. The making and breaking of network ties take place over time, vertices can be added or removed at any point in time and the strength of their interactions are governed by social, cultural and structural rules. The effects of network structure on disease transmission can be evaluated at the level of individual, group and across an entire population.
3 DEVELOPMENT OF HIVacSIM
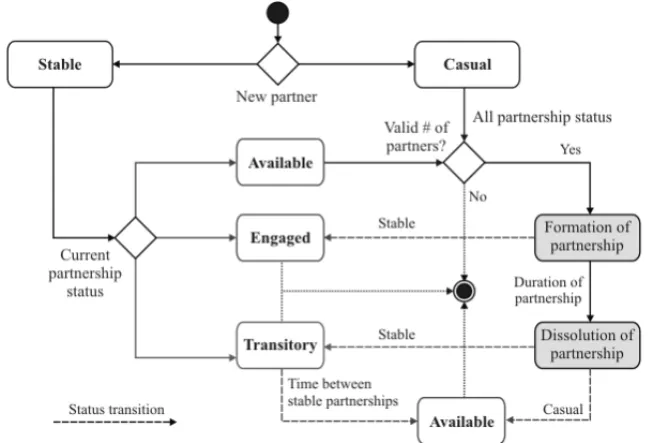
The model starts by defining the simulation clocktthat moves in1tsteps (for months, trimesters, semesters and years), which guides the definition of the population structure, sexual behaviour of individuals and model outcomes. For the computation, one defines the number of replications, the underlying network structure for each population core group and the levels of interactions among individuals. The model then warms-up to eliminate transient effects if necessary, and runs for the predefined length of interactions. Activities associated with the dynamics of population (birth and deaths), social interactions leading to the formation and dissolution of partnerships, preventive vaccination intervention, the dynamics of sexual behaviour and transmission of HIV are evaluated for each1t as shown in Figure 1. The information to be transmitted through the network connections over time is the HIV infection.
The initial size of the core group population is kept unchanged throughout the simulation run time; individuals dying from natural causes or HIV infection are replaced by new individuals sampled at random from the same core group’s definition with the current HIV prevalence. The main activities associated with social interactions and sexual transmission of HIV are the forma-tion/dissolution of partnerships, the nature of the partnerships (duration, monogamy or concur-rent), rate of sexual contacts, safe sex practice and the HIV transmissibility (Fauciet al., 1996). Although other sources of HIV infection such as mother to child and needle sharing among in-jecting drug users (IDUs) are important, the focus of this work is on sexual transmission, the main source of HIV infection within the general population worldwide.
– High-level HIVacSim computation activity diagram. Figure 1– High-level HIVacSim computation activity diagram.
In the case of HIV, lesbian sex is not considered in our model, as the rate of transmission is very low. AIDS surveillance data indicate that women with AIDS who are reported to have had sexual contacts only with other women have also been reported to have injected drugs or to have received blood transfusions or blood components (Raiteriet al., 1994).
3.1 Population
– Population characteristics definition.
Population structure Parameters and probability distributions
Population identity
1: Size n - The size of the population in each core group.
2: Age distribution - The population's age distribution used to quantify the effects of HIV infection on individuals and/or to define age based population core groups.
3: Life expectancy - The distribution of life expectancy in the population without the effects of HIV infection.
4: Gender - Proportions of female, male and homosexuals in the population, used to define partnerships within the population.
HIV infection status
5: HIV prevalence - The currently estimated prevalence of HIV infection within the population.
6: HIV lead-time distribution - The lead-time of the HIV infection among people living with HIV/AIDS, used to quantify deaths caused by HIV infection.
7: HIV testing rate - The proportion of people tested for HIV infection in the population, fundamental when making decisions about treatment and preventive intervention strategies.
Network and social rules governing the formation of
partnerships, migration, concurrency and community
structure
8: Maximum number of concurrent partnerships - Network property governing the overlapping of partnerships.
9: Probability of concurrent partnership - Population behaviour towards multiple sexual partners or extramarital partnerships.
10: Probability of a casual partnership - equivalent to small world's probability - social rule governing the network structure according to the nature of the partnerships within the population.
11: Probability of looking for a sexual partner at any time - Available for partnership - social rule accounting for individuals' desire to be involved in sexual partnerships.
12: Probability of searching own group first for a casual partner - Network rule representing the community structure of the population and the cultural behaviour of individuals when looking for casual partnerships.
Sexual behaviour of individuals
in ,
quantifying the strength and frequency of social interactions as
well as the dissolution of partnerships
13: Duration of stable partnerships - The distribution of length of long-term partnerships in the population (e.g. the duration of marriage). 14: Time between stable partnerships - The distribution of time between two consecutive stable partnerships. The mean time taken by individuals to find a new stable partner as described by the pair formation models (Dietz & Hadeler, 1988). However individuals can have casual partners in between stable partnerships.
15: Rate of sexual intercourse for stable partnership per unit of time - The distribution of sexual contacts, the sexual behaviour of individuals when engaged in a long-term partnership.
16: Probability of safe sex practice during sexual intercourse for stable partnership - The behaviour of individuals engaged in stable partnerships, condom use, especially relevant to those having extramarital partnerships, the bridges for HIV (Morris et al., 1996).
Sexual behaviour of individuals
in s,
quantifying the strength and frequency of social interactions as
well as the dissolution of partnerships
17: Duration of casual partnership - The distribution of short-term partnerships in the population.
18: Rate of sexual intercourse for casual partnership per unit of time - The distribution of sexual contacts between individuals when engaged in a short term sexual partnership.
–Multiple group scenario definitions.
LogNormal(9.2, 14.6) Gamma(5.3, 1.0)
Duration of casual partnership Gamma(8.8, 1.1)
Gamma(5.3, 1.4) Gamma(7.1, 1.1)
Rate of sexual intercourse for
casual partnership per unit time Gamma(5.0, 1.6)
0.42 0.55
Probability of safe sex practice during sexual intercourse for
casual partnership
0.12
Weibull(89.7 1.0) LogNormal(29.8,
37.2) Duration of stable partnerships Weibull(198.2, 1.6)
Gamma(24.4, 1.0) Weibull(14.9,1.1)
Time between stable partnerships Gamma(20.2, 1.1)
Gamma(5.1, 1.3) Gamma(6.5, 1.1)
Rate of sexual intercourse for
stable partnership per unit time Gamma(4.7, 1.5)
0.21 0.47
Probability of safe sex practice during sexual intercourse for
stable partnership
0.11
5 5
Maximum number of concurrent
partnerships 5
0.14 0.21
Probability of concurrent
partnership 0.06
0.27 0.40
Probability of casual partnership 0.06
0.64 0.78
Probability of looking for a
sexual partner 1
0.7 0.8
Probability of searching own
group first for casual partner 0.4
18.29% 11.71%
HIV testing rate 16.34%
Weibull(64.3, 1.6) Weibull(71.8, 1.6)
HIV lead-time distribution Weibull(64.3, 1.6)
0.007 0.007
HIV prevalence 0.007
5% 5%
Proportion of homosexual males 5%
37.6% 54.3%
Proportion of males 50%
62.4% 45.8%
Proportion of females 50%
840 months 840 months
Life expectancy (70 years) 840 months
InvNormal(242.2, 246.9, 621.9) LogNormal(144.0,
95.1, 37.0) Age distribution Weibull(182.3, 336.3,
2.3)
1108 794
Married Parameters and Probability
Distributions
Population size ( ) 1422
Under 25 Others Group Definitions
In this model an individual can be in one of the following partnership states which depend upon the social behaviour of the population and the network concurrency property as follows: (1) Available (i.e. stable or casual partnership can be established), (2) Transitory (i.e. available only for casual partnership) and (3) Engaged (i.e.currently involved in a stable partnership).
partnership starts the engaged state. The dissolution of a stable partnership begins the transitory state, the time during which only casual partnerships are allowed. At the end of the transitory period, one returns to the available state as illustrated in Figure 2.
– Partnership status transition diagram.
Figure 2– Partnership status transition diagram.
Although in some cultures it may be acceptable for one to have multiple wives or families at the same time, this can be seen as a social exception, not a common rule in western societies. There-fore within this model individuals are allowed to be involved only in a single stable partnership at a time. Concurrent partnerships may occur, either involving a stable and a casual partner, or among multiple casual partners according to the social rules governing the interactions.
3.2 Mixing
The mixing pattern specifies the extent to which individuals in different core groups interact within the model. In our model the overall population can be divided into several core groups according to the risk of HIV infection or any other appropriate criteria. For each group the characteristics defined in Table 1, are specified so that they represent both the structure and beha-viour of the group’s population. The flow of individuals between different core groups may be asymmetric (e.g.married couple versus commercial sex workers), therefore a mixing procedure that accounts for both the pattern of external interactions and the direction of individuals between core groups was developed.
3.3 Structure
Topological networks account for both geographical distances as well as social distances as defi-ned for metric networks. Two topological structures are defidefi-ned:
• Circle– the original small world topological model (Watts, 1999), where the population lives in a lattice ring with periodic boundary conditions. Geographically one is close to k neighbours on one’s left and right. Socially one is close to other people by acquaintances as for a topology free structure;
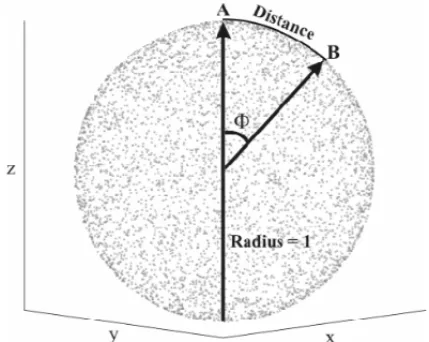
• Sphere– the population lives on the surface of a unit sphere. Socially people are closely related by acquaintances as above, geographically one’s neighbourhood is defined by a distance on the surface of the sphere.
The assumption that people live in a ring lattice was given in the original small world model (Watts, 1999). However, we believe that the spherical topology provides a more intuitive repre-sentation of the real world and has been assumed as the default population structure within our model. The other two structures (free and circle) are provided for convenience; they can be used as baselines for comparison of experiments using previous small world models as the underlying network structure.
The unit sphere provides a robust and convenient mathematical representation of the network elements. Individuals are distributed uniformly on the surface of the sphere. One’s geographical neighbourhood can be defined in terms of the unit sphere surface for efficient computation as well as real world geography representation,e.g.population density, country boundaries, Global Positioning System (GPS) location. Figure 3 illustrates the spherical topology representation of such a small world network and the geographical distance among individuals.
– Geographical distances on the spherical to
Figure 3– Geographical distances on the spherical topology.
3.4 Searching for Relationships
rules governing the size of the acquaintances list. The formation of sexual partnerships depends upon the individuals’ sexual behaviour and the rules defined by one’s population group regar-ding the formation and dissolution of partnerships. The following social and structural rules are predefined within HIVacSim. New ones can be added at any time as needed:
1. Both source and target individuals must be available for sexual partnership (probability of looking for a sexual partner at any time);
2. The source and target individuals must agree with the nature of the proposed partnership (probability of a casual partnership);
3. The network concurrency (Fig. 2) must hold true (maximum number of concurrent part-nerships and probability of concurrent partnership);
4. Source and target individuals must not already be sexual partners;
5. The gender preconditions for establishing a partnership must hold.
These preconditions are evaluated for the source and target individuals before and during the search for a sexual partner, according with each core group definition. The search procedure is evaluated for each individual in the population for every model interaction.
In the case of sexual partners, the procedure first defines the nature of the partnership (stable or casual) to search for. The next step is to evaluate the partnership state, and the social and struc-tural rules regarding the formation of partnerships as described above. Forcasualpartnerships, the scope (internal or external) and order of the search are defined by the probability of searching own group first for a casual partner. Theexternalsearch chooses a single external core group based upon the probabilities provided in the mixing matrix. If a partner is found, a new casual partnership is formed, otherwise the search failed and no action is taken.
To find a stable partner, the search starts in the lists of acquaintances up to three degrees of separation. If a new stable partner is not found among acquaintances, the search continues by geographic closeness. In either case, if a new partner is found, a new stable partnership is formed and the states of the individuals involved are updated. Otherwise, the search fails and no action is taken.
3.5 Transmission of HIV
transmission per single unprotected sexual intercourse. The probability of sexual transmission of HIV betweenuandvduring time1t, denoted byZuv, is therefore:
zuv= 0 ,
(uorv) practiced safe sex or
(uorv) is protected or
(uorv) are susceptible or
(uorv) are infected or
1−(1−h)s, Otherwise
(1)
The networkefficacyis calculated as a function of the HIV transmission over time through the network edges and the population size. In epidemiological terms this is the HIV incidence within the population, given byefficacy(t)=HIV Incidence(t)divided by Population Size.
3.6 HIV Vaccine and Intervention
A preventive vaccine against HIV infection is the greatest hope to control the HIV pandemic, in December 2009, Rerks-Ngarmet al. reported the results of a clinical trial of a vaccine re-gimen, describing the first findings of possible prevention of HIV-1 infection in humans. The trial results show modest vaccine efficacy at three years after initiating vaccination, with a lowe-red rate of HIV infection by 31.2% A modest efficacy vaccine can still have benefit because all vaccines derive their power from group immunity, as the prevalence of a transmissible disease diminishes among a population, each individual’s risk of contracting the disease also lessens, regardless of whether they are directly protected. However effective vaccine intervention must go alongside education and a wide range of effective prevention programmes. HIVacSim allows multiple preventive vaccines to be defined. The definition of a preventive HIV vaccine requires basic information about the effectiveness of the vaccine in stopping the HIV transmission and the duration of the protection provided by the vaccine for the vaccinated individuals. In HIVac-Sim, the necessary information for defining a preventive HIV vaccine is: (1)Effectiveness(i.e. the effectiveness of the vaccine in stopping HIV transmission), (2)Protection(i.e.does the vac-cine provide a lifelong protection against HIV transmission?) and (3)Length(i.e.length of the vaccine protection – if not lifelong).
The implementation of different vaccination strategies can be defined within the model and will depend on: core groups’ definitions, available HIV vaccines, number of interventions, HIV tes-ting and testes-ting results. Intervention strategies therefore may target specific core groups and use different types of vaccines in order to minimise the costs and maximise the effectiveness. The following options can be used for intervention.
• Population to be vaccinated (all groups or selection of user-defined specific groups);
• Time for intervention as a function of the clockt;
• Percentage of population to be vaccinated;
• Vaccine to be used;
The many characteristics of graphs and networks are accounted for by HIVacSim, in order to quantify the dynamics of sexual network interactions, social structure and transmission of infec-tious diseases. In total, 16 characteristics are used to summarise the network properties calculated by our model for each core group. They include, among others, number of network edges and vertices, concurrency index, diameter of the network, mean geodesic length, clustering coeffici-ent and network efficiency. Descriptions and numerical values for all 16 characteristics are given in Vieira (2005).
3.7 Initial Infection Distribution
The model provides two options (uniform and clustered) to distribute the initially infected indi-viduals within the core group’s population:
• Uniform– the initially infected individuals are distributed uniformly within the population. This is typical of traditional epidemiological models with no geographical consideration;
• Clustered– this approach distributes the initially infected individuals by geographical clus-ters within the population. This enables one to observe the development of an epidemic over time both numerically and geographically, providing a better understanding of the disease.
3.8 Model Outputs
HIVacSim provides detailed information on a wide range of population structures and interac-tion quantities as well as on the efficacy of the HIV transmission within each core group. This information can be analysed using standard statistical methods to quantify the dynamics of se-xual network interactions, its effect on the spread of HIV within a population, and to evaluate a particular decision, a particular policy, or to provide guidance for evolving good decisions or policies to prevent the spread of HIV.
4 MODEL EXPERIMENTATION
A further follow-up survey entitled the “Knowledge, Attitudes and Practices of the Brazilian Population aged between 15 and 54 years” (Szwarcwaldet al., 2004) was completed in 2004. A total of 6,000 individuals were interviewed, the sample was stratified according to geographic region (macro-region): 900 interviews were conducted in the North, South and Centre-West regions; 1,100 in the Northeast region and 2,200 in the Southeast. In each of the major regions, the sample was carried out in multiple stages: states; census sectors; households. The sectors within each of the states were selected with probability proportional to size. The data from the second and the third studies were used to adjust the parameters fitted to the first study due to observed sexual behavioural changes during the four years gap. The way parameters were estimated for the model is described in detail in Vieira (2005).
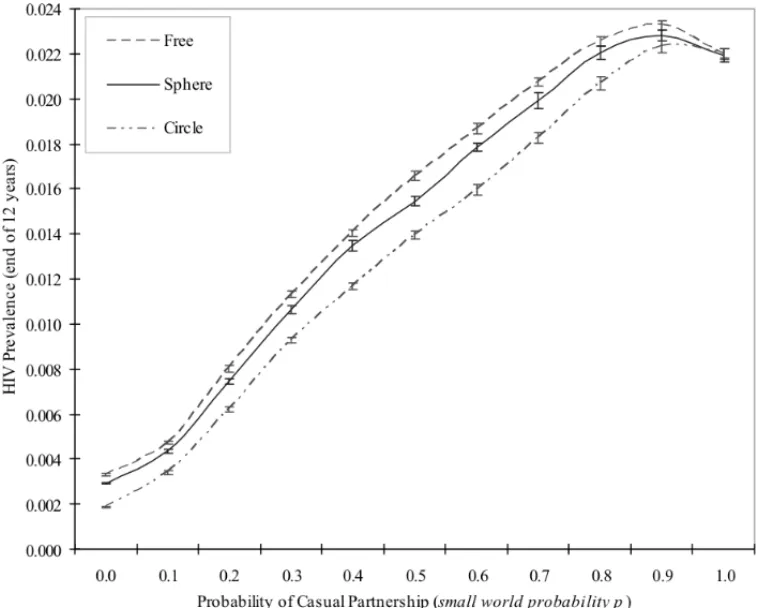
We used the model to experiment with different topologies and initial distribution of infected populations. Our findings show that the differences on network efficiency between topologies are negligible when the initial population is uniformly distributed within the network. Howe-ver, when we consider a clustered initial distribution topology becomes important. Figure 4 illustrates this effect. Topology has a clear effect on network efficiency and should not be over-looked. The circle topology has the lowest network efficiency. Topology free has the highest network efficiency, however it completely ignores the geographical distribution of individuals and consequently is not a realistic representation of the real world. Spherical topology provides an intuitive representation of the real world and its network efficiency lies between regularity (circle) and randomness (free).
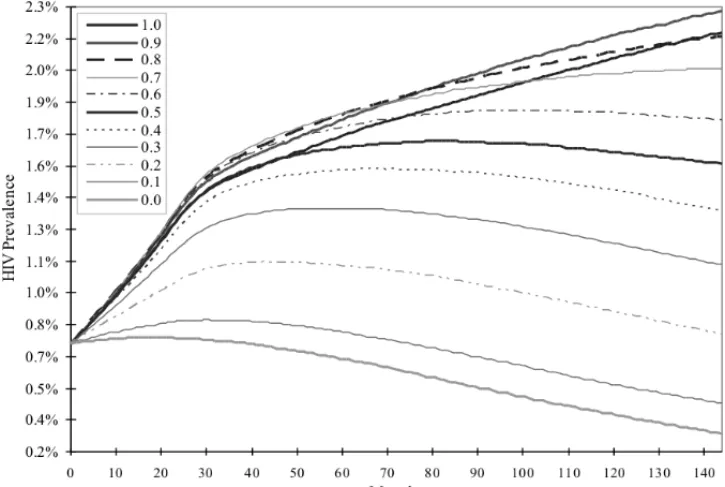
For epidemiological validation, we used HIVacSim to model HIV transmission dynamics on the surface of a sphere. In order to quantify the effects of a small world network on the sexual transmission of HIV, we gradually increased the probability of a casual partnership (small world randomness probabilityp) from regularity(p=0.0)to randomness(p=1.0)and evaluated the development of the HIV epidemic over time for each experiment. Figure 5 summarises the results for this experiment by showing the small world effect on the HIV prevalence as the epidemic progresses over time in a dynamic network. Points on the graph were joined to highlight the differences between the results.
The results show that the small world randomness parameter (probability of casual partnership) directly affects the speed of the HIV transmission. However the rate of change on the network randomness value does not have a linear effect on HIV transmission, as can be observed. For example, an increase of 0.1 in the network randomness(0.0→0.1)results in a 33% increase in HIV prevalence (and a 42% in HIV incidence) after 12 years compared with the regular network as the baseline.
5 CONCLUDING REMARKS
Figure 4– Network efficiency by topology with clustered distribution, based on Brazilian data.
is strongly connected and they do not characterise the ties/link properties of edges, essential to capture the social behaviour of an individual within the network.
The model presented in this paper modifies the original small world model in order to accommo-date differential selectivity (vertex properties), sexual behaviour (edge properties) and network properties such as concurrency, fundamental for the modelling of human sexual contact network and the spread of HIV. Yet it is consistent with the general definition of the small world theory.
The originalcircle topologyof the small world network has the lowest network efficiency. To-pology free networks typical of traditional social networks and epidemiological models with no geographical considerations, have the highest network efficiency, however they completely ignore the geographical distribution of individuals and consequently are not a realistic represen-tation of the real world.Spherical topologyis an intuitive representation of the real world and its network efficiency lies between regularity (circle) and randomness (free). The initial distribution of infection has also a significant effect on network efficiency within the same topology.
Figure 5– Small world effect on HIV prevalence, based on Brazilian data.
Our model allows both geographical and social distances to be taken into account as part of the dynamics of social interactions. Actors are uniquely represented by their personal and social characteristics within the system. They can choose their partners and have different sexual beha-viour when in a partnership. The making and breaking of network ties take place over time, vertices can be added or removed at any point in time and the characteristics of their interactions are governed by social, cultural and structural rules. There is a dynamics in the network leading to a better understanding of social interactions and spread of diseases. Thus, this model makes an important contribution for the general theory of the small world networks when representing the spread of infectious disease or information through social interactions.
REFERENCES
[1] ANDERSONRM & MAYRM. 1988. Epidemiological parameters of HIV transmission.Nature,333: 514–519.
[2] BRAZIL, MINISTRY OF HEALTH. 2000. Centro Brasileiro de An´alise e Planejamento. Survey of sexual behavior of the Brazilian population and perceptions of HIV/AIDS. Technical report, Brazilian Minister of Health, Brasilia.
[3] BRAZIL, MINISTRY OF HEALTH. 2003. Brazilian National Programme on DST/AIDS. Survey of the sexually active population. Technical report, Brazilian Minister of Health/IBOPE, Brasilia.
[4] BRODERA, KUMARR, MAGHOULF, RAGHAVANP, RAJAGOPALANS, STATAR, TOMKINSA & WIENERJ. 2000. Graph structure in the web.Computer Networks,33: 309–320.
[6] FAUCIAS, PANTALEOG, STANLEYS & WEISSMAND. 1996. Immunopathogenic mechanisms of HIV infection.Annals of Internal Medicine,124(7): 654–663.
[7] GHANIAC & GARNETTGP. 1998. Measuring sexual partner networks for transmission of sexually transmitted diseases.Journal of the Royal Statistical Society,161(2): 227–238.
[8] GUPTAS, ANDERSONRM & MAYRM. 1989. Networks of sexual contacts: Implications for the pattern of spread of HIV.AIDS,3: 807–817.
[9] KRETZSCHMARM. 2000. Sexual network structure and sexually transmitted disease prevention – a modeling perspective.Sexually Transmitted Diseases,27: 627–635.
[10] KUPERMANM & ABRAMSONG. 2001. Small world effect in an epidemiological model.Phisical Review Letters,86(13): 2909–2912.
[11] KWAKH, LEEC, PARKH & MOONS. 2010.What is twitter, a social network or a news media?In: WWW ’10: Proceedings of the 19thinternational conference on World Wide Web. ACM Press, New York, USA, 591–600.
[12] LESKOVECJ & HORVITZE. 2008. Planetary-scale views on a large instant-messaging network. In: WWW ’08: Proceeding of the 17thinternational conference on World Wide Web. ACM Press, New York, USA, 915–924.
[13] LILJEROSF, EDLINGCR, AMARAL LAN, STANLEYHE & ABERGY. 2001. The web of human sexual contacts.Nature,411: 907–908.
[14] MORENOJL. 1934.Who Shall Survive?Nervous and Mental Disease Publishing Company, Washing-ton DC.
[15] MORRISM. 1997. Sexual networks and HIV.AIDS,11(Suppl A): S209–S216.
[16] MORRIS M & KRETZSCHMAR M. 1995. Concurrent partnerships and transmission dynamics in networks.Social Networks,17: 299–318.
[17] MORRISM, PODHISITAC, WAVERMJ & HANDCOCKMS. 1996. Bridge populations in the spread of HIV/AIDS in Thailand.AIDS,10: 1265–1271.
[18] NEWMAN MEJ. 2001. Scientific collaboration networks I. Network construction and fundamental results.Physical Review E,64(016131): 1–8.
[19] NEWMAN MEJ & WATTSDJ. 1999. Scaling and percolation in the small-world network model. Physical Review E,60(6): 7332–7342.
[20] RAITERIR, FORA R & SINICCO A. 1994. No HIV-1 transmission through lesbian sex.Lancet, 344(8917): 270.
[21] RERKS-NGARMS, PITISUTTITHUMP & NITAYAPHANSET AL. 2009. Vaccination with ALVAC and AIDSVAX to prevent HIV-1 infection in Thailand.New England Journal of Medicine, 361: 2209–2220.
[22] SZWARCWALDCL, JUNIORAB, PASCOMAR & JUNIORPRS. 2004. Pesquisa de Conhecimento, Atitudes e Pr´aticas na Populac¸˜ao Brasileira de 15 a 54 anos. Technical report, Boletim Epidemiol ´ogico AIDS e DST, Year XVIII – Number 1, Brazilian Ministry of Health.
[24] WASSERMANS & GALASKIEWICZJ. 1994.Advances in social network analysis: research in the social and behavioral sciences. Sage Publications, Thousand Oaks.
[25] WATTSDJ. 1999.Small Worlds: The dynamics of networks between order and randomness. Princeton Studies in Complexity, Princeton University Press, Princeton.
[26] WATTSDJ & STROGATZSH. 1998. Collective dynamics of small-world networks.Nature,393(4): 440–442.