Daniel Henrique Marco Detzel1, Cristóvão Vicente Scapulatempo Fernandes2 e Miriam Rita Moro Mine3
1 Graduate Program on Water Resources and Environmental Engineering, Federal University of Parana, Curitiba, PR, Brazil
2,3 Department of Hydraulic and Sanitation, Federal University of Parana, Curitiba, PR, Brazil
[email protected]; [email protected]
Received 18/03/15 - Revised: 04/09/15 - Accepted: 09/09/15
ABSTRACT
Anthropogenic activities in the watersheds are responsible for land use changes, thus interfering in its rivers lows regimes. Consequently, changes occur in the hydrological series statistical moments, a condition known as nonstationarity. The use of a nonstationary time series can cause relevant errors, misleading and biasing the ongoing analyses. In this manner, this paper evaluates the possible effects of nonstationarity over water availability for water resources permits in six Brazilian gauges, considering the Q95% as reference. Median and seasonal low-duration curves are employed in two distinct periods, before and after 1969, for all the series. Results suggested that Q95% increased in four gauges and reduced in the remainder two. Moreover, important changes were observed in intermediate low-durations, suggesting that the variations are not limited to the series extreme values.
Keywords: Statistical stationarity. Flow-duration curve. Water resources permits
Atividades antrópicas nas bacias hidrográicas são responsáveis por causar mudanças no uso do solo, de modo a ocasionar relexos nas vazões aluentes de seus rios. Dentre essas consequências está a alteração dos primeiros momentos estatísticos das séries hidrológicas, condição conhecida por não estacionariedade. O emprego de uma série não estacionária pode repercutir em erros relevantes e conclusões tendenciosas nas análises propostas. Dessa maneira, o presente trabalho avalia os possíveis efeitos dessa condição na disponibilidade hídrica para outorga de uso dos recursos hídricos em seis postos hidrométricos brasileiros, considerando como referência a Q95%. Opta-se pelo uso da curva de permanência mediana anual e de curvas de permanência sazonais, determinadas em dois momentos distintos das séries históricas, antes e depois do ano de 1969. Os resultados sugerem aumento da Q95% em quatro postos e redução nos outros dois. Além disso, alterações importantes foram também identiicadas em permanências intermediárias, sugerindo que as variações nas séries não estão limitadas a valores extremos.
Palavras-chave: Estacionariedade estatística. Curva de permanência. Outorga de recursos hídricos
Nonstationarity in determining low-duration curves aiming water resources permits
Não Estacionariedade na Construção de Curvas de Permanência com Vistas à Outorga de Recursos Hídricos
RESUMO
INTRODUCTION
Time series are valuable sources of information that can be consulted for the characterization of variables in several areas of knowledge. In hydrology, such series are employed in water systems management as tools for the hydrological cycle understanding.
Traditionally, stochastic models use time series to reproduce the behavior of a given phenomenon. Models for synthetic rainfall series generation (RASMUSSEN, 2013;
DET-ZEL; MINE, 2011) and streamlow (NIU; SIVAKUMAR, 2013;
DETZEL et al., 2014) are examples. Alternatively, reservoir
storage capacity determination (SILVA; PORTELA, 2013), water demand related analysis (ADAMOWSKI et al., 2012) and
assessment of water availability in rivers (CRUZ; TUCCI, 2008) may also consider time series.
In most studies, hydrological time series application requires the knowledge of its basic properties. Evidently, one may expect these properties to undergo changes over time since
they derive from natural phenomena. However, these luctuations should be low enough as to preserve the series’ irst statistical moments. Otherwise, one may classify the series as nonstationary. In streamlow time series, studies point anthropogenic
activities in watersheds as potential sources of nonstationarity
(TUCCI; BRAGA, 2003; TUCCI, 2007). Other authors mention
climate change as another cause, although this still is an ongoing discussion (SALAS et al., 2012). Nevertheless, nonstationarity
detection in streamlow series is a recurrent topic in the lite
-rature (FLEMING; WEBER, 2012; BORMANN et al., 2011;
SÁFADI, 2004; MÜLLER et al., 1998; GENTA et al., 1997).
Recently, Detzel et al. (2011) analyzed inlows to 146
Brazilian hydropower plants aiming nonstationarity detection. The authors applied six well-known statistical inferences and concluded that 75 series were second-order nonstationary.
Moreover, they identiied the beginning of the 1970s as an important period for streamlow regime alteration in Southern Brazil. In some rivers, the average streamlow increased 25% in the periods prior and after 1969.
The present paper proposes advancing the analysis towards understanding the possible effects caused by these nonstationarities. Water availability for water resources permits (or grants) were evaluated under a water resources management
context. The granting of water rights is one of the ive instru -ments provided by the Brazilian Federal Law number 9433/97 (BRASIL, 1997), document that regulates the country water resources management. Notably complex for relating water availability with demand, both space and time dependent, Cruz and Tucci (2005) points it as the main instrument of the referred law. The presented results also highlight the need for better understanding the nonstationarity effects over the remainder water resources management instruments provided by the federal legislation.
In agreement with other water availability studies, low-duration curves constructed with daily mean natural low data
were used as method for the analyzes. After a brief description,
the paper shows the low-duration curves in different historical
periods for six gauges located in hydropower plants. In addition,
seasonal (monthly) low-duration curves were obtained. A dis
-cussion on the nonstationarity inluence over water resources
permits is proposed, as well as recommendations when using time series with such condition.
WATER AVAILABILITY VIA FLOW-DURA-TION CURVES
The low-duration curve is a widespread tool among
hydrologists as it can express the diverse rivers regimes in a
single plot. Vogel and Fennessey (1995) argue that its use is
convenient since it synthesizes complex elements of a river hy-drology. Hence, it is suitable for stakeholders or managers with limited knowledge in the area. Although not the only method
in determining water availability in a river (e.g. 7-day low-low
with a 10-years return period, Q7,10, see WOLFF et al., 2014), it certainty is the most common.
The low-duration curve relates the streamlow mag -nitude (vertical axis) with the temporal exceedance frequency (horizontal axis). Typically, one may use daily data in cons-tructing such curve. However, it can also be obtained using
data in any available time scale. Given a streamlow sample, the low-duration curve estimates the exceedance frequency
of the observed magnitudes. In other words, it expresses the
frequency that a historical low was equaled or exceeded within
the sample period. With water resources grants purposes, one
may employ the 95% percentile (Q95%, MÜLLER, 2009) as the
target streamlow. Alternatively, this value may be determined
relating the watershed topology with consensus measurements established by local committees, as in many Brazilian states.
In determining low-duration curves, one may employ two methods: (i) itting probabilistic functions or (ii) empiri -cally. In method (i) one may consider skewed distributions, in
agreement with many rivers streamlow behavior. For example,
LeBoutillier and Waylen (1993) compared log-normal, gamma
and generalized extreme value distributions for estimating
low-duration curves. Log-normal distribution provided the best results, however underestimated the sample variance.
In method (ii) one may sort the streamlow time series
in decreasing order and rank the results. Mathematically, let qi be a set of n streamlow observations, with i = 1,...,n. One may
sort it in such way that qi and qn assume the highest and lowest elements, respectively. Equation (1) represents each observation exceedance probability:
where
� = 1 − ��(�) (1)
��(�)
��
��
��=� + 1� (2)
is the streamlow probability density
function. To each element qi one associates an exceedance probability pi. The latter can be estimated using Weibull
plot-ting positions [equation (2)]. Vogel and Fennessey (1994) state
that this method provides unbiased estimators regardless the
streamlow theoretical distribution.
� = 1 − ��(�) (1)
��(�)
��
��
��=� + 1� (2)
� = 1 − ��(�) (1)
��(�)
��
��
Still concerning the empirical technique, one may identify distinct approaches in selecting the series historical reference period. The classical method (BEARD, 1943) employs
the entire series available to build a single curve. Vogel and
Fennessey (1994) criticize this format for its susceptibility to extreme events. Alternatively, the authors propose to estimate
a median low-duration curve based on yearly curves calculated
from the observed series. This method also allows determining
conidence intervals for the percentiles.
Cruz and Tucci (2005) defend a third approach based
on seasonal low-duration curves speciically calculated for water
granting purposes. According to the authors, water demand follows seasonal variations, justifying the need to estimate water availability in distinct periods over the year.
Apart of the method used for the low-duration curve estimation, nonstationarity may inluence the water availability determination. In the present paper, this issue is irstly addressed with curves determined for periods prior and after 1969 in all gauges. Vogel and Fennessey (1994) concepts are employed in calculating median annual low-duration curves. In addition,
seasonal curves are also obtained, based on a monthly time
scale. In all cases, the 95% percentile is considered for water
granting purposes.
STUDY AREA AND DATASET
The study area and dataset selection allied the presence of nonstationarity (according to DETZEL et al., 2011) with
long and consisted records of streamlow. Six gauges installed
in Brazilian hydropower plants were selected, each one
repre-senting distinct hydrological regimes. At irst, this number may be considered limited, however it is suficient for the proposed
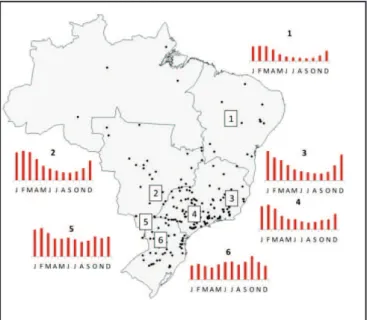
analyses. Table 1 lists the selected gauges and Figure 1 exhibits their location.
Naturalized daily mean low data were collected from the National Electrical System Operator database (www.ons.org.
br). All the records are consisted and have no missing values. The time series consider the consumptive water uses (for irrigation, livestock and urban, rural and industrial activities) and discount the reservoir evaporation losses (BRAGA et al., 2009). The
historic period varies from 1931 to 2010 in all gauges, except
Mascarenhas and Salto Osório with periods spanning from 1938
to 2010 and from 1940 to 2010, respectively.
Table 1 last column shows the long-term mean (LTM)
variation for the periods prior and after 1969 as calculated by DETZEL et al. (2011). One may note distinct situations of
increase and decrease rates between periods. A stationary time series was also included for comparison purposes. It is important to mention that these variations are merely indicators of the
average behaviors before and after 1969; the approach adopted
in this paper is independent of these numbers.
Figure 1 also shows monthly LTM histograms, plotted to characterize the seasonal variations among gauges. Southern
gauges (Rosana e Salto Osório) have undeined seasonality across
the year. In addition, the same series exhibit higher variation
rates prior and after 1969 (see Table 1). On the other hand, the
remainder gauges present clear seasonal behavior, with high and low averages in summer and winter seasons respectively.
Table 1 – Studied hydrological gauges
Figure 1 – Hydrological gauges location and histograms for
streamlow monthly long-term mean. The numbers refer to the irst column of Table 1
# Name River LTM (m³/s) Variation rate Drainage area (km²)
1 Sobradinho São Francisco 2,667 Stationary 499,084
2 Ilha Solteira Paraná 5,322 +10.3% 377,197
3 Mascarenhas Doce 974 -11.7% 73,487
4 Barra Bonita Tietê 438 +16.2% 33,156
5 Rosana Paranapanema 1,286 +28.4% 100,799
6 Salto Osório Iguaçu 1,045 +26.2% 45,769
1
RESULTS AND DISCUSSION
Median annual flow-duration curves
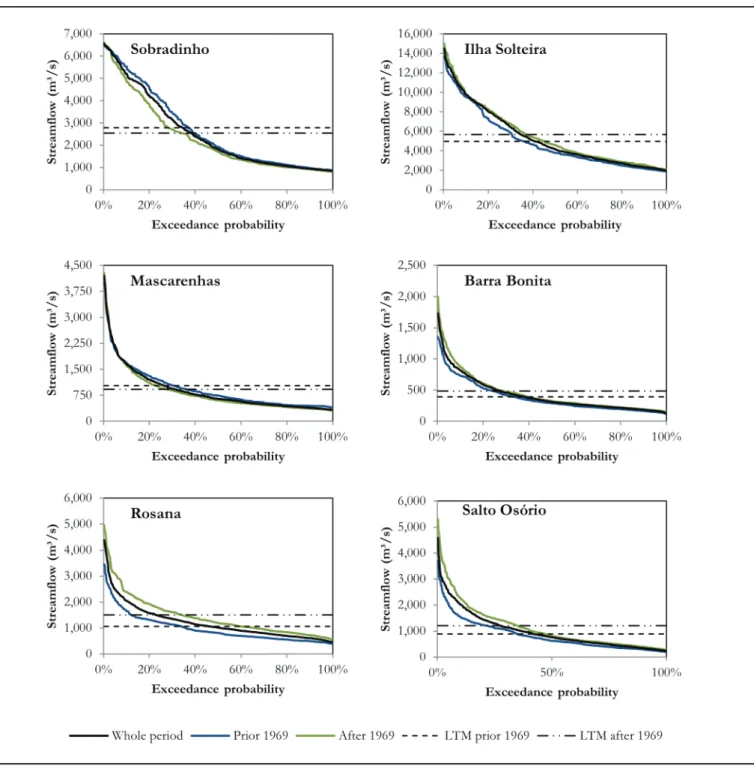
Figure 2 shows the median annual low-duration curves
for all considered gauges. Curves for the periods before and
after 1969 were plotted, as well as the median curve considering
the records full length.
The irst notable result was obtained from Sobradinho, which exhibited signiicantly differences in the 15-55% percentile range. One may recall that Detzel et al. (2011) classiied this
series as stationary. In their study, the authors applied
inferen-ces over annual means, what might have hidden an eventual nonstationarity.
As to the other series, the general behavior proved to be consistent with the magnitudes of the LTM variations showed in
Table 1. Rosana and Salto Osório presented the highest discre
-pancies in the low-duration curves for the considered periods.
In turn, Mascarenhas exhibited an interesting result: the curve
prior 1969 was above the curve for the latter period, which is a direct relex of the negative LTM variation.
An important result can be inferred in the
interme-diate percentiles (20-50%). The observed differences between curves suggest that the streamlow variations were not limited
to the extreme events. This may imply a change in the overall
streamlow regimes for these rivers. This argument is reinforced by the use of median annual low-duration curves, insensitive to extreme events (VOGEL; FENNESSEY, 1994). Naturally, this conclusion is more evident in Rosana and Salto Osório.
Together with all those curves, LTMs for the periods
prior and after 1969 were also plotted. The intention was to
investigate a possible variation in the associated percentiles.
Barra Bonita presented a reduction from 33.3% to 29.0% per
-centile. Therefore, even with higher lows in magnitude after 1969, its associated LTM percentile decreased. In other words, the frequency that the lows reached (or surpassed) its LTM
was reduced. Another decrease was observed in Sobradinho,
from percentiles 37.0% to 33.4%. Nonetheless, in this case the mean lows also reduced between the periods. For the remainder
gauges, no changes were observed in this regard.
Table 2 presents a speciic analysis over the 95% per
-centile. Associated low magnitudes prior and after 1969 are shown, as well as their percentage variation. One may note signiicant variations on the Q95% for all series, with positive changes in four gauges. In this sense, Ilha Solteira, Barra Bonita,
Rosana and Salto Osório had their Q95% lows increased in the period after 1969. To provide an in-depth analysis and discuss its consequence for water granting, seasonal low-duration curves
results are shown in the next section.
Seasonal flow-duration curves
Monthly low-duration curves were obtained for all
six studied gauges, however only the most important results are presented due space limitation. The choosing criterion was based on the results exhibited in Table 2 and in the histograms
showed in Figure 1. At irst, Figure 3 presents January and June low-duration curves for Ilha Solteira and Salto Osório.
Differences are most evident in Ilha Solteira, which has
a well-deined seasonality over the year. In January, the associated LTMs percentiles reduced 12.5%, from 50.0% before 1969 to 37.5% in the latter period. This is a similar conclusion drawn
for the annual curves in Barra Bonita.
Figure 3 – January and June low-duration curves for Ilha Solteira and Salto Osório
Table 2 – 95% percentile streamlows (Q95% – m³/s)
Name Prior 1969 After 1969 Variation
Sobradinho 912 859 -6.2%
Ilha Solteira 2.027 2.287 +11.4%
Mascarenhas 443 343 -29.5%
Barra Bonita 151 179 +15.6%
Rosana 454 653 +30.5%
Salto Osório 249 324 +23.1%
Yet, the highest distinctions in the Q95% percentiles were
noted in January for Salto Osório gauge. While Ilha Solteira presented 9.4% (January) and 13.1% (June), Salto Osório dis
-played 35.0% (January) and 19.7% (June) variations. Moreover, the highest increase in Ilha Solteira occurred in January, a month
within the wet season (see Figure 1). No similar conclusion can
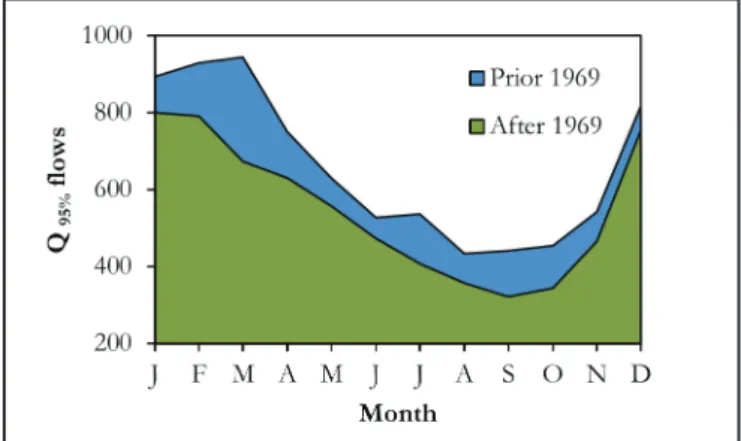
be drawn for Salto Osório, since its wet/dry seasons are not clear. Figure 4 details the monthly differences in the 95% percentile for Mascarenhas. Reductions in the Q95% lows
were observed in all months, being more severe in May,
July, September and October. For these months, the varia
-tions overcame 30% in reducing the Q95% (-40.2%, -31.7%, -37.3% e -32.3%, respectively). Recalling the histograms in Fi
-gure 1, one may note that July, September and October are in
the dry season. Hence, the detected reductions may indicate a concern in Mascarenhas gauging station. The smaller reductions
were observed in January and December (-11.6% and -8.6%,
respectively).
Figura 4 – Monthly variations in the Q95% lows in Mascarenhas
It is important to stress that the presented monthly
low-duration curves should be analyzed with caution. In de -aling with monthly scale curves, the considered sample sizes are reduced. While for annual scale one may use samples with
365 elements, in monthly scale these samples are limited to 31 elements. Vogel and Fennessey (1994) explain that small samples may induce bias in the low-duration curves. Alternatively, they
propose an estimator based on the Beta distribution, conside-rably more complex than the Weibull estimators [equation (2)].
Nevertheless, the results presented in this section conirm that nonstationarity plays a signiicant role in water resources grants estimation via low-duration curves.
Further discussion
The search for nonstationarity causes is out of the scope of this paper. However, it is known that they are a consequence of land use changes, climate variability and other anthropogenic activities in the watersheds. Soil sealing and deforestation for crop planting possibly altered the runoff processes and increased the Q95% in some gauges. On the other hand, two gauges shown reduction in the Q95%. One may point the consumptive uses as a plausible cause, though they were considered in obtaining the
naturalized streamlow time series. Thus, one can argue whether the reductions resulted from inaccuracies in the streamlow
series reconstitution or are a consequence of climate variability.
Evidently, the choice for 1969 as the reference year for the analysis can be considered a simpliication. Although
based in other studies (GENTA et al., 1997; MÜLLER et al., 1998; SÁFADI, 2004) it is possible that variations occurred in different moments for each gauge. In contrast, the existence of a database with consisted and long time series is rare and may limit studies like the one presented here. In particular, the con-sidered database resulted of a great effort by National Electrical
System Operator in obtaining and validating the naturalized streamlow series (MÜLLER, 2009). Yet, these records carry
uncertainties mainly associated with consumptive uses. Braga et al. (2009) explain that estimates for consumptive uses were obtained through other hydrological variables, censuses and documents published by diverse institutions. They also argue that the consumptive uses peaks occur in the dry season. This is important considering the results obtained in the present paper. It is worth mentioning that Sobradinho, Ilha Solteira and Barra Bonita gauges operate in hydropower plants with
reservoirs that are able to regularize the inlows. This may in -crease the Q95% percentiles as well as the water availability for
granting purposes. On the other hand, run-of-river reservoirs
are unable to do so.
Usually, one may need to determine water availability
in sites with insuficient or low quality data. Cruz (2001) states that there is great dificulty in obtaining reliable information
and thus achieve proper characterization of the watercourse in question. This requires researchers and potential stakeholders
interested in water granting to use residual streamlow records
(i.e. discounting water uses before the gauge measurement point). Considering the presented results, it is clear that deter-mining water availability in watersheds affected by anthropogenic activities must be done carefully. It is strongly recommended
that nonstationarity condition must be veriied. Should the nonstationarity be conirmed, procedures for data correction
can be employed (see DETZEL et al., 2011).
CONCLUSION
The analyzes presented in this paper raised important issues. The most important ones are listed below:
• Sobradinho showed notable differences in the low-duration curves prior and after 1969 even with Detzel et al. (2011) classiication as a stationary series. • Overall, the low-duration curves variations in the
sub-samples were consistent with the respective series LTM variations.
• Changes in the intermediate percentiles (20-50%) were observed. This is an important inding of the paper. • Barra Bonita and Sobradinho exhibited changes in
the associated LTM percentiles prior and after 1969. • As to the Q95%, variations ranged from -29,5% (Mas
• Important changes also occurred in the seasonal low-duration curves. Salto Osório suffered a 35% increase in Q95% in January.
• Mascarenhas presented signiicant reductions in Q95% reaching -40,2% in May. Other decreases were detected
in the driest months of the year for this gauge. In-depth studies on the nonstationarity condition of hydrological time series have been done almost exclusively for modeling purposes. However, the results here obtained alert that these analyzes should be embedded in water resources management activities as well.
AKNOWLEDGEMENTS
The authors would like to thank the valuable criticism, suggestions and further contributions provided by the anony-mous reviewers.
REFERENCES
ADAMOWSKI, J., FUNG CHAN H., PRASHER S. O., OZGA-ZIELINSKI, B., SLIUSARIEVA, A. Comparison of multiple
linear and nonlinear regression, autoregressive integrated moving
average, artiicial neural network, and wavelet artiicial neural
network methods for urban water demand forecasting in Montreal, Canada, Water Resources. Research, v. 48, n. 1, W01528, 2012.
BEARD, L. R. Statistical analysis in hydrology. ASCE Transactions,
v. 108, p. 1110-1160, 1943.
BORMANN, H.; PINTER, N.; ELFERT, S. Hydrological signatures of lood trends on German rivers: Flood frequencies, lood heights and speciic stages. Journal of Hydrology, v. 404, n.
1-2, p. 50–66, 2011.
BRAGA, R. S.; ROCHA, V. F.; GONTIJO, E. A. “Revisão das séries de vazões naturais nas principais bacias hidrográicas do Sistema Interligado Nacional” (in Portuguese), In.: XVIII
Brazilian Symposium of Water Resources, 2009, Campo Grande.
Proceedings of the XVIII SBRH. Porto Alegre: ABRH, 2009
BRASIL, Federal Law number 9433, of January 8th, 1997, which establishes the National Water Resources Policy, creates the National System of Water Resources Management and provides other measures (in Portuguese).
CRUZ, J. C. Disponibilidade hídrica para outorga: avaliação de
aspectos técnicos e conceituais (in Portuguese). Thesis (doctorate),
Programa de Pós Graduação em Engenharia de Recursos
Hídricos e Saneamento Ambiental, Federal University of Rio Grande do Sul, 2001.
CRUZ, J. C.; TUCCI, C. E. M. Optimization and Comparative
Simulation of Water Grant Scenarios (in Portuguese). Revista Brasileira de Recursos Hídricos, v. 10, n. 3. p. 75-91, Jul/Set 2005.
CRUZ, J. C.; TUCCI, C. E. M. Estimate of Water Availability
Using the Permanence Curve (in Portuguese). Revista Brasileira de Recursos Hídricos, v. 13, n. 1, p. 111-124, Jan/Mar 2008.
DETZEL, D. H. M.; BESSA, M. R.; VALLEJOS, C. A. V. SANTOS, A. B.; THOMSEN, L. S.; MINE, M. R. M.; BLOOT, M. L. e ESTRÓCIO, J. P. Stationarity of Inlows to Brazilian
Hydroelectric Power Plants (in Portuguese). Revista Brasileira de Recursos Hídricos, v. 16, n. 3, p. 95-111, 2011.
DETZEL, D. H. M.; MINE, M. R. M. Generation of daily synthetic precipitation series: analyses and application in La Plata river Basin. Open Hydrology Journal, v. 5, p. 69-77, 2011.
DETZEL, D. H. M.; MINE, M. R. M.; BESSA, M. R.; BLOOT,
M. Synthetic Flows Scenarios for Large Water Systems Through Contemporary Models and Sampling (in Portuguese). Revista Brasileira de Recursos Hídricos, v. 19, n. 1, p. 17–28, 2014.
FLEMING, S. W.; WEBER, F. A. Detection of long-term change
in hydroelectric reservoir inlows: bridging theory and practise.
Journal of Hydrology, v. 470-471, p. 36–54, 2012.
GENTA, J. L.; PEREZ-IRIBARREN, G; MECHOSO, C. R. A recent increasing trend in the streamlow of rivers in southeastern
South America. Journal of Climate, v. 11, p. 2858-2862, 1997.
LeBOUTILLIER, D. W.; WAYLEN, P. R. A stochastic model of low duration curves. Water Resources Research, v. 29, n. 10, p. 3535-3541, 1993.
MÜLLER, I. I. KRÜGER, C. M.; KAVISKI, E. Stationarity
Analysis of Hydrological Series in the Incremental Watershed of Itaipu (in Portuguese). Revista Brasileira de Recursos Hídricos, v.3, v.4, p. 51-71, 1998.
MÜLLER, I. I. Proposta de uma metodologia de cobrança pelo uso da água para o setor hidrelétrico: avaliação das vazões indisponibilizadas por usinas hidrelétricas em bacias hidrográicas (in Portuguese).
Thesis (doctorate), Setor de ciências agrárias, Federal University of Paraná, 2009.
NIU, J.; SIVAKUMAR, B. Scale-dependent synthetic streamlow
generation using a continuous wavelet transform. Journal of Hydrology, v. 496, p. 71–78, 2013.
RASMUSSEN, P. F. Multisite precipitation generation using a latent autoregressive mode, Water Resources Research, v. 49, n. 4, p. 1845-1857, 2013.
SÁFADI, T. Use of time series analysis for the water outlow
at furnas dam (in Portuguese). Ciências Agrotécnicas, v. 28, n. 1, p. 142-148, 2004.
SALAS, J. D.; RAJAGOPALAN, B.; SAITO, L.; BROWN, C.
Resources Planning and Management, v. 138, n. 5, p. 385–388, 2012.
SILVA, A. T.; PORTELA, M. M. Stochastic assessment of
reservoir storage-yield relationships in Portugal. Journal of Hydrologic Engineering, v. 18, n. 5, p. 567–575, 2013.
TUCCI, C. E. M.; BRAGA, B. (org.) Clima e recursos hídricos no
Brasil.(in Portuguese). Coleção ABRH de Recursos Hídricos v.
9. Porto Alegre: ABRH, 2003.
TUCCI, C. E. M. Mudanças climáticas e impactos sobre os recursos hídricos no Brasil (in Portuguese). Ciência & Ambiente,
UFSM, Santa Maria, p. 137-156, 2007.
VOGEL, R. M.; FENNESSEY, N. M. Flow duration curves I: new interpretation and conidence intervals. Journal of Water Resources Planning and Management, v. 120, n. 4, 1994.
VOGEL, R. M.; FENNESSEY, N. M. Flow duration curves
II: a review of applications in water resources planning. Water Resources Bulletin, v. 31, n. 6, 1995.
WOLFF, W.; DUARTE, S. N.; MINGOTI, R. Nova metodologia de regionalização de vazões, estudo de caso para o Estado de São Paulo (in Portuguese). Revista Brasileira de Recursos Hídricos, v. 19, n. 4, p. 21-33, out/dez 2014.
Authors’ contributions:
Detzel, D. H. M.: Literature research, study area selection, data collection, method implementation, results analyzes (statistical approach) and paper organization.
Fernandes, C. V. S.: Analysis scheme organization, results analyzes
(water resources management approach) and paper organization.