Threshold-Based Epidemic Dynamics
Taro Takaguchi1, Naoki Masuda1, Petter Holme2,3,4*
1Department of Mathematical Informatics, The University of Tokyo, Tokyo, Japan,2IceLab, Department of Physics, Umea˚ University, Umea˚, Sweden,3Department of Energy Science, Sungkyunkwan University, Suwon, Korea,4Department of Sociology, Stockholm University, Stockholm, Sweden
Abstract
Records of social interactions provide us with new sources of data for understanding how interaction patterns affect collective dynamics. Such human activity patterns are often bursty,i.e., they consist of short periods of intense activity followed by long periods of silence. This burstiness has been shown to affect spreading phenomena; it accelerates epidemic spreading in some cases and slows it down in other cases. We investigate a model of history-dependent contagion. In our model, repeated interactions between susceptible and infected individuals in a short period of time is needed for a susceptible individual to contract infection. We carry out numerical simulations on real temporal network data to find that bursty activity patterns facilitate epidemic spreading in our model.
Citation:Takaguchi T, Masuda N, Holme P (2013) Bursty Communication Patterns Facilitate Spreading in a Threshold-Based Epidemic Dynamics. PLoS ONE 8(7): e68629. doi:10.1371/journal.pone.0068629
Editor:Alain Barrat, Centre de Physique The´orique, France
ReceivedFebruary 4, 2013;AcceptedMay 31, 2013;PublishedJuly 19, 2013
Copyright:ß2013 Takaguchi et al. This is an open-access article distributed under the terms of the Creative Commons Attribution License, which permits unrestricted use, distribution, and reproduction in any medium, provided the original author and source are credited.
Funding:This research was supported by the Aihara Project, the FIRST program from the Japan Society for the Promotion of Science (JSPS), initiated by Council for Science and Technology Policy (NM), Grants-in-Aid for Scientic Research (No. 10J06281) from JSPS, Japan (TT), Grants-in-Aid for Scientic Research (No. 23681033) from the Ministry of Education, Culture, Sports, Science, and Technology, Japan (NM), the Swedish Research Council (PH) and the WCU program through the National Research Foundation of Korea funded by the Ministry of Education, Science and Technology R31-2008-10029-0 (PH). The funders had no role in study design, data collection and analysis, decision to publish, or preparation of the manuscript.
Competing Interests:Petter Holme is an academic editor of PLOS ONE. This does not alter the authors’ adherence to all the PLOS ONE policies on sharing data and materials.
* E-mail: [email protected]
Introduction
Communication between individuals is a fundament of human society. Nowadays technologies such as sensor devices and online communication services provide us with records of interaction between individuals, including face-to-face conversations, e-mail exchanges, and phone calls, in massive amounts. Such data often consist of a sequence of interaction events. Each event is represented by a triplet,i.e., the IDs of two individuals involved in the event and the time of the event. One traditional way to characterize such data is to represent them as an aggregated network, in which the links are drawn between two nodes (i.e., individuals) that communicate in at least one event, and investigate structural properties of the aggregated static networks [1]. Another and richer representation of this type of data is to model them as temporal networks, in which the links between two nodes exist only at the time of an event [2].
Effects of temporal networks on contagious phenomena, such as infectious diseases and rumors, have been investigated by various authors. To simulate spreading dynamics on temporal networks, we read the events in an empirical event sequence one by one in the chronological order and possibly update the states (e.g., susceptible and infected) of the two nodes involved in the event. Karsai and colleagues simulated the susceptible-infected (SI) model on temporal networks and found that bursty activity patterns slow down contagions [3]; Bursty activity patterns are identified with a long-tailed distribution of the interevent times (IETs) [4,5]. The slowing down occurs because, at an arbitrary time point, the average time to the next event is longer for the
long-tailed IET distribution than for the exponential IET distribution with the same mean. In other words, after an individual gets infected, it tends to take longer time to infect the neighbors under the long-tailed as compared to exponential IET distribution. Other numerical [6,7] and analytical [8–10] results also support that the long-tailed IET distribution mitigates contagion. However, the burstiness was reported to accelerate contagion on a different data set [11] and a different type of epidemic dynamics. Our understanding of the effect of the burstiness, and other temporal structures, on contagious processes is still elusive.
contacts with the same person need not be as influential as the same number of contacts with different persons. In this work, we do not model such effects but focus on the limit where contacts are worth equally much. To consider this type of infection, we generalize the deterministic threshold model to the case of history dependence and memory decay and simulate the proposed model on temporal network data.
Results
Simulation protocols and data sets
Each nodei is assumed to have an internal variable denoted by vi§0 (i~1,2,. . .,N ), which represents, for example, the
concentration of a pathogen in the individual or the individual’s interest in a topic. Initially,vi to equal to zero for alli. We assume
that node i is in the susceptible (S) state beforevi exceeds a
threshold valuevthr and that nodei is in the infected (I ) state
oncevi exceedsvthr. Each node is in either state. Nodes in stateI
never return to stateS; our model is an extension of the SI model.
Therefore, the number of I nodes monotonically increases in
time. It should be noted that the SI model was used in place of the more realistic SIR model in previous literature on static [17] and temporal [3,11] networks. This is because the initial growth phase, which determines the possibility of large-scale spreading initiating from a small number of infected individuals, is the same between the SI and SIR models.
When nodei in stateS interacts with anI node through an
event,vi is increased by unity. In the absence of interaction with
I nodes,vi is assumed to decay exponentially in time. In other
words,vi is given by
vi(t)~
X
te
g(t{te), ð1Þ
where
g(s)~ exp {s=td
ð Þ (s§0),
0 (sv0),
ð2Þ
andte is the time of an event between nodei and anI node, and
td is the decay time constant. An example time course ofvi(t) is shown in Figure 1.
The model contains two parameterstd and vthr and can be
regarded as a variant of the deterministic threshold model [12,13]. Although we assume that all the nodes have the same values oftd andvthr for simplicity, it is straightforward to generalize the model
in the case of heterogeneous parameter values.
We simulate our model numerically on empirical temporal networks in the following way. Att~0, we select a node as initial seedi (1ƒiƒN) and set its state toI. All the other nodes are
initially in state S. Then, we chronologically read the event
sequence one by one and updatevi and the states of the two nodes
involved in the event. Because our model is deterministic, the final infection size (i.e., fraction ofI nodes at timetmax, wheretmax is
the time of the last event in the data set), denoted byIi, is unique
for given initial seed i, td, and vthr. We examine spreading dynamics starting from all the possible initial seeds, except for the results shown in Figure 2 for which we select the node with the maximum number of events as the seed.
We use two data sets. The first data set, called Conference in the following, is the face-to-face conversation log between attendees of a scientific conference [18]. The second data set, called Email, is the record of e-mail exchanges between the members of a university [19]. In the second data set, we neglect the direction of the interaction (i.e., from sender to receiver) for simplicity. The basic statistics of the data sets are summarized in Table 1.
Effects of the burstiness on infection size
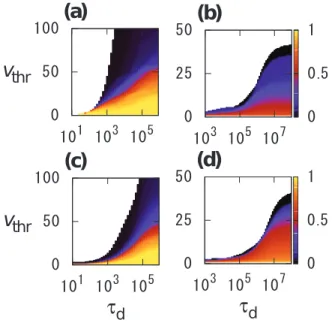
In Figures 2(a) and 2(b), we plot the dependence of final infection sizeIm ontd andvthr for initial seed nodem having the maximum number of events in Conference and Email data sets, respectively. In the blank parameter region, no infection occurs such thatIm~1=N. Naturally,Im increases withtd and decreases withvthr.
Next, we carry out the same set of simulations on the randomized temporal networks for the sake of comparison. To this end, we use the so-called randomly-permuted-times random-ization, in which the time stamps of all the events are randomly shuffled [2,3,6]. The randomization eliminates temporal proper-ties of the original temporal networks such as bursty activity patterns and the pairwise correlations of the IETs, whereas it conserves all the properties of the aggregated networks, i.e., weighted adjacency matrix. In addition, daily and weekly activity patterns are conserved at the population level although they are not conserved for each individual.
1.05 1.06 1.07 1.08
t
/106 02 4
v
i=0
(
t
)
Figure 1.vi~0(t)for1:05|106
ƒtƒ1:08|106
in Email data set.We settd~1000. The vertical ticks in the box plot in the bottom indicate the times of the events that involve nodei~0.
doi:10.1371/journal.pone.0068629.g001
For the randomized temporal networks, the dependence ofIm on
td andvthr are shown in Figures 2(c) and 2(d) for Conference and Email data sets, respectively. We find that the parameter region in which infection occurs is larger for the original temporal networks (colored regions in Figures 2(a) and 2(b)) than for the randomized temporal networks (colored regions in Figures 2(c) and 2(d)) for intermediate values oftd (102ƒtdƒ104 and104ƒtdƒ106 for Conference and Email data sets, respectively). In the original data sets, the nodes tend to have many events in bursty periods and be quiescent in other periods. The randomization procedure eliminates bursty activity patterns. Therefore,vm(t) can reachvthr in such a
bursty period for the original but not randomized temporal networks iftd andvthr take intermediate values. In the randomized data sets, vm(t) tends to decay faster than it grows, although the number of
events per node is the same between the original and randomized data.
For Email data set,Im for the randomized data set (Figure 2(d))
is larger than that for the original data set (Figure 2(b)) whentd is large andvthr is small. This is mainly because the randomization
considerably increases the reachability ratio of initial seedm. The reachability ratio of a node is defined as the fraction of nodes that we can reach from the node by tracing the events in the chronological order [20]. If every event can elicit infection, which is the case whentd is large andvthr is small,Im is approximated by the reachability ratio of nodem. The reachability ratio of node m~3024 in Email data set is equal to 0.7458 and 0.9981 for the original and randomized data sets, respectively. In contrast, the reachability ratio of nodem~55 in Conference data set is equal to 0.9642 and 1 for the original and randomized data sets, respectively; the difference is smaller than in the case of Email data set.
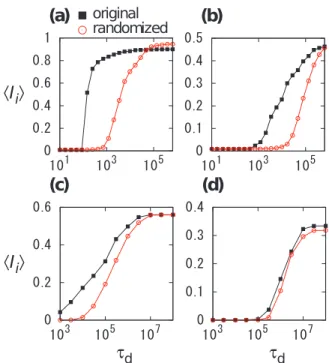
In Figure 3, the average final infection sizeSIiT, defined as the
average ofIi over all the nodesi, is plotted as a function oftd for two values ofvthr for each data set. Figure 3 indicates thatSIiT for
the original temporal networks is larger than that for the
randomized temporal networks for a broad range of td for both
data sets. For Email data set, theSIiT values for the original data
set are similar to or larger than those for the randomized data set,
even for large td (Figures 3(c) and 3(d)). These results are
apparently inconsistent with the fact that Im is larger for the
randomized data set than for the original data set (Figures 2(b) and
2(d)) for large td. The inconsistency may be caused by the
competition between two opposite effects of the randomization. First, the randomization tends to increase the reachability ratio of each node to enhance epidemic spreading. Second, the random-ization eliminates the burstiness to suppress epidemic spreading. For nodes involved in many events, the first effect would dominate the second effect (Figures 2(b) and 2(d)) and vice versa for nodes involved in a small number of events. We will also discuss this point in Discussion.
In the bond percolation on static networks, the probability that single bonds are open (independent of different bonds) is the sole
parameter that determines the possibility that the entire network has a giant component [1]. Motivated by this picture, we hypothesize that the results shown in Figures 2 and 3 are largely explained by the bursty nature of events on single links. In other words, we speculate that the structure of the aggregated networks or correlation between event sequences on different links do not much influence the results. To test the hypothesis, we separately Table 1.Statistics of the two data sets.
Conference Email
Number of nodes (N) 113 3,188
Number of events 20,808 309,125
Recording period 3 days 83 days
Time resolution 20 sec 1 sec
doi:10.1371/journal.pone.0068629.t001
Figure 3. Average final infection sizeSIiTfor (a), (b) Conference and (c), (d) Email data sets.Squares and circles correspond to the original and randomized temporal networks, respectively. We set (a)
vthr~5, (b)vthr~20, (c)vthr~3, and (d)vthr~10.
doi:10.1371/journal.pone.0068629.g003
Figure 4. Average single-link infection rateS1=Tj?iTfor (a), (b) Conference and (c), (d) Email data sets.(a), (c) Original temporal networks. (b), (d) Randomized temporal networks.
examine the event sequence on each link. For each link,i.e., node pair(i,j) with at least one event,Tj?i(t) is defined as the time required for nodei to be infected since nodej is infected at time t. We emphasize that we do not consider influences from other nodes oniin this analysis. We take the time average ofTj?i(t),
denoted by Tj?i, over 0ƒtƒtmax. A problem with the time averaging is thatTj?i(t) is indefinite for sufficiently larget because
i does not get infected by time tmax. Therefore, we adopt the
boundary condition in which the first events between nodesi andj virtually replay after t~tmax. We denote the time of the first
event between i and j by t1. If we temporarily set
Tj?i(tmaxzt1)~Tj?i(t1), it takes at mosttmax{tzt1zTj?i(t1) for nodei starting withvi(t)~0 to be infected from nodej, where
tlastƒtƒtmax and tlast is the last time before which Tj?i(t) is
finite. Therefore, we set Tj?i(t)~tmax{tzt1zTj?i(t1) for tlastƒtƒtmax. This boundary condition is the same as that is used
in Ref. [21] for defining the average temporal path length. If Tj?i(t1) is indefinite (i.e., infection never occurs betweeni andj),
Tj?i is set to infinite. We define denoted byS1=Tj?iT as the
average of1=Tj?i over the 20% links with the largest numbers of events, because the majority of the links possesses a small number of events in both data sets. This thresholding leaves 441 and 6,932 links for Conference and Email data sets, respectively.
S1=Tj?iT for the original and randomized temporal networks
are shown for various td and vthr values for Conference
(Figures 4(a) and 4(b)) and Email (Figures 4(c) and 4(d)) data sets. Because infection can be induced only through a single link in the present simulations, we examinedvthrvalues that are much smaller
than those used in Figures 2 and 3. For both data sets,S1=Tj?iT for the original temporal networks (Figures 4(a) and 4(c)) is larger than that for the randomized networks (Figures 4(b) and 4(d)) for intermediate values oftd (102ƒtdƒ104 and104ƒtdƒ106 for Conference and Email data sets, respectively). The behavior of S1=Tj?iT is consistent with the results of the network-based
simulations (Figures 2 and 3).
Discussion
We numerically simulated a variant of the deterministic threshold model on empirical temporal networks. We found that the average final infection size for the empirical temporal networks is larger than those for the randomized temporal networks in a broad parameter region (Figures 2 and 3). The bursty nature of the
IETs on single links has a sufficient explanatory power for the results of the network-based simulations (Figure 4). The burstiness
promoted epidemic spreading when the decay exponenttd takes
an intermediate value (102ƒtdƒ104 and 104ƒtdƒ106 (sec-onds) for Conference and Email data sets, respectively). This range oftd may be practical because the influence of a pathogen that an individual has received may last for hours to days.
The finding that the burstiness facilitates the spreading also sheds light on a function of the redundant interaction events. We previously found that about 80% of the events are redundant in the sense that they affect little on bridging efficient temporal paths in Conference data set [22]. However, for the spreading dynamics in our model, such redundant events play a crucial role in increasingvi(t) within bursty periods. Threshold models can be
generalized to temporal networks in several ways. Reference [23], for example, considers a sliding window where only contacts within the window matters for the spreading. The authors examined two types of threshold rules–whether the threshold operates on all the total number of contacts with I in the interval or on the fraction of such contacts. The output was data dependent, but for most of their datasets, the results for the present model are similar to their results in the case of an absolute threshold. This suggests that we should be careful in generalizing our results too much (even though they should probably hold true for email and conference contacts).
In the previous section, we mentioned two possible consequenc-es of the randomization of temporal networks: weakened burstiness and enhanced reachability. To disentangle the contri-bution of the two factors to epidemic spreading is difficult, because the two factors are simultaneously affected by the present randomization scheme. Therefore, looking for alternative ran-domization procedures or generative models of temporal networks in which burstiness and reachability are independently controlled is warranted for future work.
Acknowledgments
The authors thank the SocioPatterns collaboration (http://www. sociopatterns.org) and J.-P. Eckmann for providing the data set.
Author Contributions
Conceived and designed the experiments: PH. Performed the experiments: TT. Analyzed the data: TT NM. Wrote the paper: TT NM PH.
References
1. Newman MEJ (2010) Networks: an Introduction. Oxford: Oxford University Press. 784 p.
2. Holme P, Sarama¨ki J (2012) Temporal networks. Phys Rep 519: 97–125. 3. Karsai M, Kivela¨ M, Pan R, Kaski K, Kerte´sz J, et al. (2011) Small but slow
world: How network opology and burstiness slow down spreading. Phys Rev E 83: 025102(R).
4. Baraba´si A-L (2005) The origin of bursts and heavy tails in human dynamics. Nature 435: 207–211.
5. Va´zquez A, Oliveira JG, Dezso¨ Z, Goh KI, Kondor I, et al. (2006) Modeling bursts and heavy tails in human dynamics. Phys Rev E 73: 36127.
6. Miritello G, Moro E, Lara R (2011) Dynamical strength of social ties in information spreading. Phys Rev E 83: 045102(R).
7. Stehle´ J, Voirin N, Barrat A, Cattuto C, Colizza V, et al. (2011) Simulation of an SEIR infectious disease model on the dynamic contact network of conference attendees. BMC med 9: 87–101.
8. Vazquez A, Ra´cz B, Luka´cs A, Baraba´si A-L (2007) Impact of non-Poissonian activity patterns on spreading processes. Phys Rev Lett 98: 158702. 9. Iribarren JL, Moro E (2009) Impact of human activity patterns on the dynamics
of information diffusion. Phys Rev Lett 103: 38702.
10. Karrer B, Newman MEJ (2010) Message passing approach for general epidemic models. Phys Rev E 82: 16101.
11. Rocha LEC, Liljeros F, Holme P (2011) Simulated epidemics in an empirical spatiotemporal network of 50,185 sexual contacts. PLOS Comput Biol 7: e1001109.
12. Dodds PS, Watts D (2004) Universal behavior in a generalized Model of contagion. Phys Rev Lett 92: 218701.
13. Dodds PS, Watts DJ (2005) A generalized model of social and biological contagion. J Theor Biol 232: 587–604.
14. Joh RI, Wang H, Weiss H, Weitz JS (2009) Dynamics of indirectly transmitted infectious diseases with immunological threshold. Bull Math Biol 71: 845–862. 15. Crane R, Sornette D (2008) Robust dynamic classes revealed by measuring the
response function of a social system. Proc Natl Acad Sci USA 105: 15649– 15653.
16. Averell L, Heathcote A (2011) The form of the forgetting curve and the fate of memories. J Math Psychol 55: 25–35.
17. Barthe´lemy M, Barrat A, Pastor-Satorras R, Vespignani A (2004) Velocity and Hierarchical Spread of Epidemic Outbreaks in Scale-Free Networks. Phys Rev Lett 92: 178701.
18. Isella L, Stehle´ J, Barrat A, Cattuto C, Pinton J-F, et al. (2011) What’s in a crowd? Analysis of face-to-face behavioral networks. J Theor Biol 271: 166–180. 19. Eckmann J-P, Moses E, Sergi D (2004) Entropy of dialogues creates coherent
structures in e-mail traffic. Proc Natl Acad Sci USA 101: 14333–14337. 20. Holme P (2005) Network reachability of real-world contact sequences. Phys
21. Pan RK, Sarama¨ki J (2011) Path lengths, correlations, and centrality in temporal networks. Phys Rev E 84: 016105.
22. Takaguchi T, Sato N, Yano K, Masuda N (2012) Importance of individual events in temporal networks. New J Phys 14: 093003.