www.atmos-meas-tech.net/8/3069/2015/ doi:10.5194/amt-8-3069-2015
© Author(s) 2015. CC Attribution 3.0 License.
Electron density profiles probed by radio occultation of
FORMOSAT-7/COSMIC-2 at 520 and 800 km altitude
J. Y. Liu1,2, C. Y. Lin1, and H. F. Tsai3
1Institute of Space Science, National Central University, Taoyuan, Taiwan
2Center for Space and Remote Sensing Research, National Central University, Taoyuan, Taiwan 3Department of Earth Sciences, National Cheng Kung University, Tainan, Taiwan
Correspondence to:J. Y. Liu ([email protected])
Received: 1 November 2014 – Published in Atmos. Meas. Tech. Discuss.: 4 February 2015 Revised: 28 June 2015 – Accepted: 14 July 2015 – Published: 3 August 2015
Abstract.The FORMOSAT-7/COSMIC-2 (F7/C2) will ulti-mately place 12 satellites in orbit with two launches with 24– 28.5◦inclination and 520–550 km altitude in 2016 and with 72◦ inclination and 720–750 km altitude in 2018. It would be very useful for the community to construct the global three-dimensional electron density structure by simultane-ously combining the two launch observations for studying ionospheric structure and dynamics. However, to properly construct the global electron density structure, it is essen-tial to know and evaluate differences between the ionospheric electron densities probed by the two launches. To mimic the F7/C2 observations, we examine the electron density probed at the two satellite altitudes 500 and 800 km by means of FORMOSAT-3/COSMIC (F3/C) observations at the parking orbit 500 km altitude and mission orbit 800 km altitude, as well as a corresponding observing system simulation exper-iment (OSSE). Observation and OSSE results show that the sounding geometries by satellite orbiting at 500 and 800 km altitudes can cause the overall differences in the electron den-sity, the F2 peak electron denden-sity, and the F2 peak height of about 18–24, 12–28 %, and 7–19 km, respectively. Results confirm that the discrepancies mainly result from the sound-ing geometry and the grid (contour) bias of the electron den-sity.
1 Introduction
On 15 April 2006, six microsatellites of FORMOSAT-3/COSMIC (F3/C) were launched to the parking orbit of about 516 km altitude and subsequently lifted to the
3070 J. Y. Liu et al.: FORMOSAT-7/COSMIC-2 electron density profiles
Figure 1.The altitude of each F3/C microsatellite from launch to middle of 2007. The red box indicates the time period of the study.
density estimation error has no obvious dependency on ei-ther the solar activity or the orbit altitude. It is essential to know and evaluate the difference between the two electron density profiles retrieved from the sounding geometries of satellites orbiting at 500 and 800 km altitudes for combin-ing the two electron density profiles to construct the global three-dimensional electron density structure. In this paper, we examine the effect of satellite altitude on the Abel inver-sion by firstly comparing the electron density profiles ranging from 100 to 500 km altitude observed by satellites at 500 and 800 km altitude and their differences during the early F3/C mission period. Observing system simulation experiments (OSSEs) by means of the standard F3/C Abel inversion are used to produce above the observation. Cross comparisons among the observation and the OSSE shall have a better un-derstanding on the electron density profiles observed at 520– 550 and 720–750 km altitude for the upcoming F7/C2 mis-sion during both solar minimum and solar maximum.
2 F3/C electron density profiles observed at 500 and 800 km altitude
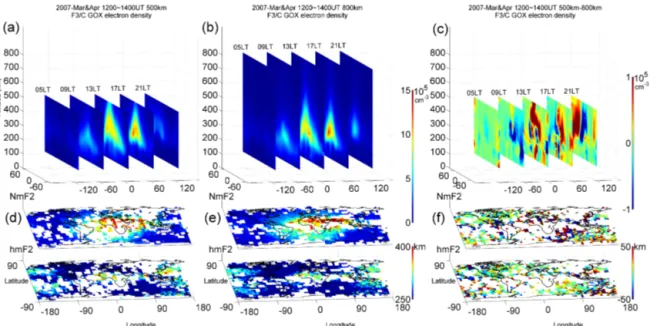
One half of F3/C satellites were orbiting at the parking or-bit 500 km altitude and the other half at the mission oror-bit 800 km altitude in March and April 2007 (Fig. 1). The satel-lites at 500 and 800 km altitude probed 5812 and 5425 elec-tron density profiles during 12:00–14:00 UT in March and April of 2007. During the study period, satellite LEO4 was transferred from 500 to 800 km altitude, and therefore its electron density profiles probed below and above 600 km alti-tude are classified into 500 and 800 km altialti-tude, respectively. The electron density profiles are gridded with 5◦in latitude, 20◦in longitude, and 5 km in altitude and the median of the electron density in each grid is computed. Figure 2 displays that the global electron density N, F2 peak electron den-sityNmF2, and heighthmF2 observed at the 500 and 800 km satellite altitude, and their difference. The longitude cuts in −120, −60, 0, 60, and 120◦ stand for the electron density at 05:00, 09:00, 13:00, 17:00, and 21:00 LT, respectively. It
can be seen that structures of the electron density observed from 500 km satellite altitude (N500)and from 800 km
satel-lite altitude (N800)at 09:00, 13:00, 17:00, and 21:00 LT are
similar, respectively. Since the accuracy in the lower iono-sphere is relatively low, we focus on the electron density in the topside ionosphere (i.e., the region above the F2 peak). It can be seen that theN500is slightly greater (less) thanN800in
the equatorial (off-equator) ionosphere, whileN500is slightly
weaker thanN800in the South Pole region at 09:00 LT.N500
is greater thanN800 in the EIA region at 13:00 LT;N500 is
weaker (greater) thanN800in the northern (southern) EIA
re-gion at 17:00 LT; andN500is weaker thanN800in the
south-ern EIA region at 21:00 LT. The difference between the two electron densitiesN500–N800generally agrees with the above
comparisons and also reveals thatN500is greater thanN800
in the northern EIA at 21:00 LT. The F2 peak electron den-sityNmF2 observed from 500 and 800 km altitude (NmF2500
andNmF2800)displays that the twoNmF2s yield similar
pat-terns andNmF2800is generally greater thanNmF2500in the
northern EIA area. However, due to the data locations be-ing different, the difference of NmF2500–NmF2800 is
diffi-cult to identify. The F2 peak heighthmF2 probed from 500 and 800 km satellite altitude (hmF2500andhmF2800)as well
as their difference illustrated that the twohmF2s are general similar in the low and mid-latitudes. In short, the F3/C elec-tron densities observed from 500 and 800 km satellite altitude are qualitatively similar.
3 Abel OSSE
To carry out Abel OSSEs, we first insert realistic F3/C RO ray path geometries into the corresponding ionosphere com-puted by the International Reference Ionosphere (IRI)-2007 (Bilitza and Reinisch, 2008) to simulate the total electron content (TEC), and then apply the Abel inversion routine of CDAAC (COSMIC Data Analysis and Archival Center) to derive electron density profiles. Figure 3 displays the truth of the electron density, theNmF2, andhmF2 computed by IRI. The truth electron density shows that the EIA is greater in the Northern Hemisphere than that in the Southern Hemisphere, which can be found in NmF2 distributions. The daytime hmF2 reaches the highest altitude in the EIA region, while hmF2 at mid- and high latitudes in nighttime is higher than those in daytime. Figure 4 depicts OSSE electron density, NmF2, andhmF2 observed by satellites at 500 and 800 km al-titude, and their difference. It can be seen thatN500is slightly
weaker thanN800in the South Pole region at 09:00 LT;N500
is greater thanN800in the EIA region at 1300 and 17:00 LT;
andN500is weaker thanN800in the southern EIA region at
21:00 LT. Note that bothN500 andN800 in EIA are greater
in the north than those in the south obtained by the Abel OSSE, which agree with the truth, respectively. It should be mentioned that the difference betweenN500andN800of the
Figure 2.The F3/C electron density,NmF2, andhmF2 observed from 500 and 800 km altitude satellites, and their difference during 12:00– 14:00 UT in March and April of 2007.(a)F3/C electron density observed from 500 km altitude,(b)F3/C electron density observed from 800 km altitude, and(c)their difference.(d)F3/CNmF2 andhmF2 observed from 500 km altitude,(e)F3/CNmF2 andhmF2 observed from 800 km altitude, and(f)their difference.
Figure 3.The OSSE truth. The median of IRI output obtained from 12:00–14:00 UT in March and April of 2007. The electron density distribution,NmF2, andhmF2 are shown from up to down.
thanNmF2800in the northern EIA region; however the
corre-sponding difference ofNmF2500–NmF2800is rather complex.
On the other hand,hmF2500andhmF2800in the low and
mid-latitudes are generally similar.
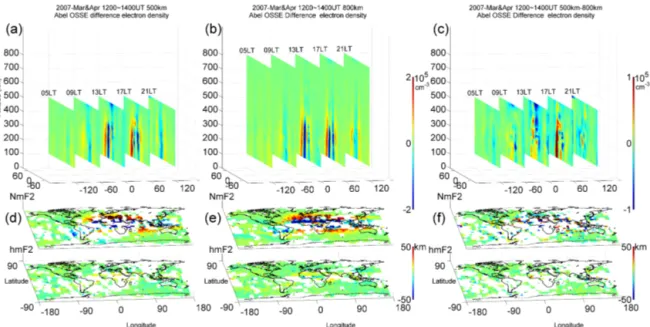
We further find whether there is any systematic error due to the different satellite altitudes of 500 and 800 km by sub-tracting the results of the Abel OSSE from the IRI truth. Similar patterns shown in Fig. 5a and 5b suggest the Abel inversion could result in systematic error in the EIA region, where bothN500andN800underestimate the electron density
in the EIA crests but overestimate in the magnetic equator and/or poleward sides of the EIA crests. Again, we examine the differences of the topside ionosphere retrieved between satellites at 500 and 800 km altitudes (Fig. 5c). The under-estimation ofN500 is more severe than that ofN800 above
F2 peak in the EIA region at 1300 LT andN500is not as
se-vere asN800 above F2 peak in the EIA region at 09:00 and
17:00 LT. On the other hand, the error patterns ofNmF2500
and NmF2800 are similar, which underestimate in the two
EIA crests but overestimate in their poleward sides. It is in-teresting to find that the errors of bothhmF2500andhmF2800
are similar, which show error ofhmF2 being small globally.
4 Discussion and conclusion
The F3/C observation and OSSE show that the electron den-sity, NmF2, and hmF2 probed at 500 and 800 km altitude are similar (Figs. 2a and b and 4a and b). Although the real and IRI ionospheres might be different, the differencesN500–
N800shown in Figs. 2c and 4c are somewhat similar,
espe-cially in the topside ionosphere. Table 1 further reveals that the overall differenceN500–N800of the F3/C observation and
3072 J. Y. Liu et al.: FORMOSAT-7/COSMIC-2 electron density profiles
Table 1.The differences ofN,NmF2, andhmF2 observed at 500 and 800 km altitude.
F3/C Abel OSSE Abel OSSE Abel OSSE 500–800 km 500–800 km 500 km–truth 800 km–truth
1N(%) Solar min 23.5±35.1 18.6±30.9 16.8±33.4 17.4±33.7 Solar max 19.1±31.3 19.1±36.9 18.4±36.1 1NmF2 (%) Solar min 28.0±39.1 14.1±21.3 7.4±9.7 7.6±10.2
Solar max 11.9±16.6 6.3±8.8 6.2±8.2 1hmF2 (km) Solar min 19.3±27.3 7.4±10.4 3.7±5.8 3.4±5.3 Solar max 8.7±11.6 4.8±7.2 4.2±6.2
Figure 4.The Abel inversion OSSE electron density,NmF2, andhmF2 observed from 500 and 800 km altitude satellites, and their difference during 12:00–14:00 UT in March and April of 2007.(a)OSSE electron density observed from 500 km altitude,(b)OSSE electron density observed from 800 km altitude, and(c)their difference.(d)OSSENmF2 andhmF2 observed from 500 km altitude,(e)OSSENmF2 and hmF2 observed from 800 km altitude, and(f)their difference.
cumulated in the two study months, the RO tangent points from the two different satellite orbits, and the grid bias of the electron density ofN500andN800. It can be seen that the
patterns in Figs. 4c and 5c are different, although both rep-resent the differences in the electron density of N500–N800.
This discrepancy might mainly result from the grid (contour) process, since the difference ofN500–N800in Fig. 4c is
ob-tained by gridding (or contouring)N500andN800separately
and then subtracting one from the other, while Fig. 5c is de-rived by subtracting the truth from OSSEN800and the truth
from the OSSE N500 point by point, then carrying out the
contour process on each error, separately, and finally sub-tracting the N800 contoured error from theN500 one.
Nev-ertheless, Figs. 4c and 5c strongly suggest that the sound-ing geometry and the grid (contour) bias of the electron density are the major sources causing the differences in the electron density of N500–N800. On the other hand, the
pat-terns inNmF2500andNmF2800as well as those inhmF2500
andhmF2800 of the F3/C observation and OSSE are
some-what similar (Figs. 2d and e and 4d and e). Table 1 shows that during the solar minimum of 2007, the overall differ-ences NmF2500–NmF2800 (hmF2500–hmF2800) of the F3/C
Figure 5.The Abel inversion OSSE error (OSSE result–truth) electron density,NmF2, andhmF2 observed from 500 and 800 km altitude satellites, and their difference during 12:00–14:00 UT in March and April of 2007.(a)OSSE electron density error observed from 500 km altitude,(b)OSSE electron density error observed from 800 km altitude, and(c)their difference.(d)OSSENmF2 andhmF2 error observed from 500 km altitude,(e)OSSENmF2 andhmF2 error observed from 800 km altitude, and(f)their difference.
Figure 6.The Abel inversion OSSE electron density,NmF2, andhmF2 observed from 500 and 800 km altitude satellites, whose sounding geometries are identical, and their difference during 12:00–14:00 UT in March and April of 2007.(a)OSSE electron density observed from 800 shifted to 500 km altitude,(b)OSSE electron density observed from 800 km altitude, and(c)their difference.(d)OSSENmF2 andhmF2 observed from 800 shifted to 500 km altitude,(e)OSSENmF2 andhmF2 observed from 800 km altitude, and(f)their difference.
Yue et al. (2011) carry out simulations based on F3/C ob-servations using NeQuick model and indicate that the solar activity and the satellite orbit altitude variations will not in-fluence the ratio of the successfully retrieved electron den-sity profiles to the observed occultation events and the rel-ative Abel inversion error of the electron density as well. They also find that in comparing them to the retrieval error
3074 J. Y. Liu et al.: FORMOSAT-7/COSMIC-2 electron density profiles
that the electron density profiles retrieved by the satellite at 500 km tend to be smaller than those at 800 km altitude in the EIA region but are greater than those in the magnetic equator and/or poleward sides of the EIA crests. These dis-crepancies result from the spherical symmetry assumption of Abel inversion in the EIA region (Liu et al., 2010a). By con-trast, Fig. 4 shows that the electron density profiles retrieved by the satellite at 500 km are very different from those at 800 km altitude, especially in the EIA region. This further in-dicates that differences of the sounding geometry at 500 and 800 km altitude satellites could significantly influence the re-trieved electron density profiles by using Abel inversion. It is known that F7/C2 will be ultimately placed during the first launch of six satellites into orbits with 24–28.5◦inclination and 520–550 km altitude, and during the second launch of six satellites with 72◦ inclination and 720–750 km altitude. Since the sounding geometries of the two launches are go-ing to be very different, the electron density profiles probed by the two altitudes shall be different. Therefore, one must take care to construct the three-dimensional electron density structure by merging the retrieved electron density profiles of the two launches.
Table 1 displays the OSSE results: the means of the overall differences N500–N800, NmF2500–NmF2800, and hmF2500– hmF2800in the solar minimum (maximum) are 18.6 (19.1 %),
14.1 (11.9 %), and 7.4 (8.7 km), respectively. The associated values in the F3/C observations, 23.5, 28.0 %, and 19.3 km are greater than those in the OSSE results. The differences of the observations are constantly larger than those of the OSSEs, which might result from the true ionosphere being more structured than the IRI-simulated ionosphere during the study period. Nevertheless, this suggests that the Abel inver-sion routine of CDAAC can be employed to reasonably de-rive electron density profiles from the RO TEC sounded at 520 km F7/C2 satellite altitude. Therefore, the sounding ge-ometry and the contour process are the major bias for con-structing the global three-dimensional electron density struc-ture by merging the retrieved electron density profiles probed by the two F7/C2 launches.
Acknowledgements. This study is supported by the Taiwan Ministry of Science and Technology grant MOST 103-2628-M-008-001. The authors gratefully acknowledge the COSMIC Data Analysis and Archival Center (CDAAC) and Taiwan Analysis Center for COSMIC (TACC) for providing the FORMOSAT-3/COSMIC data.
Edited by: U. Foelsche
References
Bilitza, D. and Reinisch, B.: International reference ionosphere 2007: improvements and new parameters, Adv. Space Res., 42, 599–609, doi:10.1016/j.asr.2007.07.048, 2008.
Hajj, G. A. and Romans, L. J.: Ionospheric electron density profiles obtained with the global positioning system: results from the GPS/MET experiment, Radio Sci., 33, 175–190, doi:10.1029/97RS03183, 1998.
Lee, I. T., Tsai, H. F., Liu, J. Y., Lin, C. H., Matsuo, T., and Chang, L. C.: Modeling impact of FORMOSAT-7/COSMIC-2 mission on ionospheric space weather monitoring, J. Geophys. Res.-Space, 118, 6518–6523, doi:10.1002/jgra.50538, 2013. Lei, J., Syndergaard, S., Burns, A. G., Solomon, S. C., Wang, W.,
Zeng, Z., Roble, R. G., Wu, Q., Kuo, Y.-H., Holt, J. M., Zhang, S. R., Hysell, D. L., Rodrigues, F. S., and Lin, C. H.: Compar-ison of COSMIC ionospheric measurements with ground-based observations and model predictions: preliminary results, J. Geo-phys. Res., 112, A07308, doi:10.1029/2006JA012240, 2007. Liu, J. Y., Lee, C. C., Yang, J. Y., Chen, C. Y., and Reinisch, B. W.,
Electron density profiles in the equatorial ionosphere observed by the FORMOSAT-3/COSMIC and a Digisonde at Jicamarca, GPS Solut., 14, 75–81, doi:10.1007/s10291-009-0150-3, 2010a. Liu, J. Y., Lin, C. Y., Lin, C. H., Tsai, H. F., Solomon, S. C., Sun, Y. Y., Lee, I. T., Schreiner, W. S., and Kuo, Y. H.: Artificial plasma cave in the low-latitude ionosphere results from the radio occulta-tion inversion of the FORMOSAT-3/COSMIC, J. Geophys. Res., 115, A07319, doi:10.1029/2009JA015079, 2010b.
Schreiner, W., Rocken, C., Sokolovskiy, S., Syndergaard, S., and Hunt, D.: Estimates of the precision of GPS radio occultations from the COSMIC/FORMOSAT-3 mission, Geophys. Res. Lett., 34, L04808, doi:10.1029/2006GL027557, 2007.
Yen, N.: FORMOSAT-7/COSMIC-2 progress update and its launch plan, 4th International Radio Occultation Working Group Work-shop, Melbourne, Australia, 2015.
Yue, X., Schreiner, W. S., Rocken, C., and Kuo, Y.-H.: Evaluation of the orbit altitude electron density estimation and its effect on the Abel inversion from radio occultation measurements, Radio Sci., 46, RS1013, doi:10.1029/2010RS004514, 2011.