Understanding global changes of the liver proteome during murine
schistosomiasis using a label-free shotgun approach
Jonatan Marques Campos
a,b, Leandro Xavier Neves
b, Nívia Carolina Nogueira de Paiva
c,
Renata Alves de Oliveira e Castro
d, Ana Helena Casé
b, Cláudia Martins Carneiro
e,
Milton Hércules Guerra Andrade
f, William Castro-Borges
f,⁎
aPrograma de Pós Graduação em Bioengenharia, Universidade Federal de São João del Rei, São João del Rei, MG, Brazil bPrograma de Pós Graduação em Biotecnologia, Universidade Federal de Ouro Preto, Ouro Preto, Minas Gerais, Brazil cNúcleo de Pesquisas em Ciências Biológicas, Universidade Federal de Ouro Preto, Ouro Preto, Brazil
dPrograma de Pós Graduação em Ciências Biológicas, Universidade Federal de Ouro Preto, Ouro Preto, Minas Gerais, Brazil eDepartamento de Análises Clínicas, Universidade Federal de Ouro Preto, Ouro Preto, Minas Gerais, Brazil
fDepartamento de Ciências Biológicas, Núcleo de Pesquisas em Ciências Biológicas, Universidade Federal de Ouro Preto, Ouro Preto, Minas Gerais, Brazil
a b s t r a c t
a r t i c l e
i n f o
Article history: Received 1 February 2016 Received in revised form 3 July 2016 Accepted 11 July 2016
Available online 15 July 2016
Schistosomiasis is an endemic disease affecting over 207 million people worldwide caused by helminth parasites of the genus Schistosoma. In Brazil the disease is responsible for the loss of up to 800 lives annually, resulting from the desabilitating effects of this chronic condition. In this study, we infected Balb/c mice withSchistosoma mansoniand analysed global changes in the proteomic profile of soluble liver proteins. Our shotgun analyses re-vealed predominance of up-regulation of proteins at 5 weeks of infection, coinciding with the onset of egg laying, and a remarkable down-regulation of liver constituents at 7 weeks, when severe tissue damage is installed. Rep-resentatives of glycolytic enzymes and stress response (in particular at the endoplasmic reticulum) were among the most differentially expressed molecules found in the infected liver. Collectively, our data contribute over 70 molecules not previously reported to be found at altered levels in murine schistosomiasis to further exploration of their potential as biomarkers of the disease. Moreover, understanding their intricate interaction using bioinfor-matics approach can potentially bring clarity to unknown mechanisms linked to the establishment of this condi-tion in the vertebrate host.
Significance:To our knowledge, this study refers to thefirst shotgun proteomic analysis to provide an inventory of the global changes in the liver soluble proteome caused bySchistosoma mansoniin the Balb/c model. It also inno-vates by yielding data on quantification of the identified molecules as a manner to clarify and give insights into the underlying mechanisms for establishment of Schistosomiasis, a neglected tropical disease with historical prevalence in Brazil.
© 2016 Elsevier B.V. All rights reserved. Keywords:
Schistosoma mansoni Schistosomiasis Liver biomarkers Label-free Shotgun proteomics
1. Introduction
Schistosomiasis is an endemic disease affecting over 207 million people worldwide[1]. It is considered by the World Health Organization to be the second most important parasitic disease due to its social and economical impact, leading to an estimated 200,000 deaths annually [2]. In Brazil, although levels of prevalence and morbidity have declined over the years, the disease still accounts for 700–800 deaths annually [3]. Therefore, early and sensitive diagnosis as well as the identification of biomarkers of the disease are of major public health interest.
Whilst assessing the course of Schistosomiasis in the human host is a difficult task, the laboratory mouse offers a convenient and fast manner
to understand the underlying mechanisms that leads to, in particular, liver pathology. Previous studies have demonstrated the proteomic al-terations in murine CBA/J strain liver schistosomiasis by means of two-dimensional gel electrophoresis, a classic proteomic approach[4, 5]. A number of differentially proteins have been elucidated including cytokeratin 18 now proposed as a biomarker of the disease [6]. Metabolomic studies have also shed light on key metabolic alterations associated to the disease[7,8].
Here we interrogated quantitatively the soluble liver proteome of Balb/c infected mice using a label-free shotgun analysis. Such global analysis allowed observation of two distinct stages of the infected liver each characterized by 1) up-regulation of constituents coinciding with the onset of egg laying and 2) massive down-regulation of proteins as a testimonial of irreversible liver damage during late hepatosplenic schistosomiasis. Our findings contributed to reveal a further 81 ⁎ Corresponding author.
E-mail address:[email protected](W. Castro-Borges).
http://dx.doi.org/10.1016/j.jprot.2016.07.013 1874-3919/© 2016 Elsevier B.V. All rights reserved.
Contents lists available atScienceDirect
Journal of Proteomics
molecules not previously reported to be differentially expressed in mu-rine schistosomiasis, providing additional data to explore potential bio-markers of the disease. Altogether, our data pave the way to novel molecular insights into the underlying cellular mechanisms required for establishment of the chronic liver pathology caused byS. mansoni.
2. Material and methods
2.1. Ethics statement
The routine procedures for maintenance of theS. mansonilife cycle were reviewed and approved by the local Ethics Committee on Animal Experimentation,‘Comissão de Ética no Uso de Animais (CEUA)’, Universidade Federal de Ouro Preto (UFOP), protocol no. 2011/55.
2.2. Mice infection and experimental groups
Forty female Balb/c mice aged 30 days and of approximately 20 g weight were anesthetised using a combination of ketamine hydrochloride and xylazine, administered intraperitoneally at 8 mg/kg and 4 mg/kg, respectively. Subsequently, the animals were separated into four groups of 10 animals each. Two of these groups had their animals infected by S. mansonilarvae (LE strain) at a dose of 200 cercariae/animal, through active penetration via their previously shaved abdominal skin[9]. The remaining animals were submitted to a similar procedure, in which the cercarial suspension was replaced by tap water; these represented the two control groups. Infected and control animals were weighted and then euthanised at the 5th and 7th weeks post infection, to provide biological material from both splenic and hepatosplenic schistosomiasis, respectively. In the two occasions, approximately 700μL of blood was drawn by cardiac puncture prior to perfusion of the hepatic portal system using saline citrate solution (0.85% NaCl, 0.75% sodium citrate), essentially as described[10]. Livers and spleens were collected, weighed and then washed in phosphate buffered solution (PBS 0.01 M pH 7.2). Liver sections of approximately 0.5 cm2were stored in 3.7% buffered-formalin
pH 7.2 for subsequent histological analyses. The remaining sections were frozen at−80 °C for proteomic studies.
2.3. Distinguishing acute from chronic phase schistosomiasis in the murine model
To distinguish between acute and chronic phase schistosomiasis in the mouse model, a number of parameters were evaluated. The onset of oviposition was investigated by parasitological examination of faeces of all infected animals from 35th to 50th days post infection. The per-centage ratiosliver-to-body weightandspleen-to-body weight(% organ/ body) were calculated to assess the level of hepatosplenomegaly, as suggested by[11]. Global and differential leukocyte counts were also obtained. These parameters alongside the histological analyses allowed us to differentiate acute from chronic liver disease.
2.4. Histological analysis
Liver sections werefixed in 3.7% buffered formalin pH 7.2 and em-bedded in paraffin. Tissue sections of approximately 4μm thick were obtained using a microtome followed by staining the slides with hema-toxylin & eosin (HE) and Masson's Trichrome. Quantitative evaluations of the number of inflammatory cells were performed in the hepatic perivascular region from control and infected animals.
2.5. Sample preparation
Soluble liver proteins were obtained from 100 mg of tissue. Firstly, the frozen sections were subjected to a maceration step in liquid nitro-gen and resuspension of the ground material in 1 mL 25 mM Tris-HCl pH 7.5 containing 1× protease inhibitor cocktail (Sigma Aldrich, St.
Louis, USA). The samples were homogenized by sonication (Branson Sonifier 250) using 5 cycles of 20 pulses each in an ice bath. The resulting suspension was centrifuged at 50,000 ×gfor 2 h, at 4 °C followed by recovery of the supernatant containing the soluble proteins. Protein content was assessed using PIERCE™BCA Protein Assay Kit (Thermo Scientific, Rockford, USA).
2.6. In solution digestion
Thirty microgram aliquots of soluble liver proteins obtained from pooled samples of three animals were reduced using 2 mM dithiothre-itol (Sigma Aldrich) in 100 mM ammonium bicarbonate at 56 °C, for 15 min. Proteins were alkylated in 4.5 mM iodoacetamide (Sigma Al-drich) for 15 min in the dark. After alkylation the samples were diluted 1:1 in 100 mM ammonium bicarbonate and digested at 37 °C for 12 h using Sequencing Grade Modified Trypsin (Promega, Madison, USA) at a ratio of 25:1(protein/trypsin). Trypsin activity was stopped by addi-tion of 4% (v/v) ultra-pure glacial acetic acid (J.T. Baker, Center Valley, USA). Peptide mixtures were cleaned up using a Strata C18-E cartridge (55μm, Phenomenex, Macclesfield, UK) and dried in aspeed vacuum equipment for sequential analyses by mass spectrometry.
2.7. LC-MS/MS
Three micrograms of peptides were separated on a UltiMate® 3000 nano UHPLC system (Thermo Scientific, Bremen) set up with an Acclaim PepMap100 C18 Nano-Trap Column (75μm i.d. × 2 cm, 3μm, 100 Å; Thermo Scientific) in line with an Acclaim PepMap100 C18 RSLC capil-lary column (75μm i.d. × 15 cm, 2μm, 100 Å; Thermo Scientific). Pep-tides were previously washed with 2% acetonitrile/0.05% trifluoroacetic acid for 3 min and separated at 40 °C using a non-linear solvent gradient, A (0.1% formic acid) and B (80% acetonitrile/0.1% formic acid). The gradient varied from 4–30% solvent B in 120 min and 30–55% at 40 min. Finally, the gradient changed from 55 to 90% sol-vent B in 10 min and afinishing step in 4% solvent B for 10 min. Spectra scans were acquired in Q-Exactive™mass spectrometry instrument
(Thermo Scientific), coupled to nano UHPLC system via a
nanoelectrospray ion source. The instrument operated in 2.8 kV, posi-tive mode, resolution of 70,000 at range of 300–2000m/z, maximum in-jection time of 100 ms and target value of 3e6ions. Up to 12 most
intense precursors ions with charge state≥2 were isolated from a 2m/ zwindow and fragmented via higherenergy collisional dissociation -HCD (collision energy of 30 V). MS/MS spectra were acquired with res-olution of 17,500 with maximum injection time of 150 ms and target value of 2e5ions. Dynamic exclusion was set to 60 s.
2.8. Data processing
the option of a second peptide was used to reduce loss of co-eluting peptides.
The Skyline software was used to validate a set of proteins revealed as upregulated in both infected groups by MaxQuant. The proteins cytokeratins 8 and 18, calreticulin, endoplasmin and L-lactate dehydro-genase were validated using the MS1filtering tool and data analysis fea-tures available on Skyline 3.5 [14] (freely downloaded at http:// proteome.gs.washington.edu/software/skyline). Initially, a comprehen-sive spectral library was built in Skyline with all peptide-spectrum matches assigned by Andromeda at a cut-off score of 0.95. All tryptic peptides used for quantification in Skyline obeyed the following criteria: 7–16 amino acids in length; absence of both missed cleavages and me-thionine residues; no PTM other than cysteine carbamidomethylation was accepted. The extracted ion-chromatograms were obtained within a 5 min window and multiply-charged peptides had only the most in-tense ion analysed.
2.9. Statistical analysis
In order to evaluate the reproducibility achieved among the various chromatographic separations a correlation statistics (Spearman's) test was performed for each of the three biological replicates from control and infected animals. Only runs displaying correlation coefficients rang-ing from 0.85 to 1 were included in this study. Data on relative abun-dance obtained through MaxQuant® software (maxLFQ) were analysed by Multiple-t-test using GraphPad Prism 6.00, San Diego, Cali-fornia, USA. Proteins exhibiting at least two maxLFQ data among the triplicates were considered for statistical analysis. A volcano plot was produced using the maxLFQ ratio (infected/control) against all p-values obtained for the identified proteins to assess their pattern of up- or downregulation. Among these, only the ones that exhibited significance (p≤0.05) were considered statistically different comparing control and infected animals.
2.10. Protein categorization and protein-interaction network
Protein annotation were obtained from UniProtKB and categorized by Gene Ontology process (GO) based on the molecular function (MF), biological process (BP), and cellular component (CC). The STRING v10.0 database (http://string-db.org) was used to generate protepro-tein network maps to visualize possible interactions for proprotepro-teins of in-terest[15].
3. Results
3.1. Establishment of acute and chronic schistosomiasis in the murine model
The use of different approaches to differentiate acute from chronic schistosomiasis in the murine model, allowed us to obtain biological material from two distinct stages of the disease. The monitoring of ovi-position by parasitological examinations showed a significant increase in the number of eggs present in the faeces of infected animals. As shown in Supplemental Fig. 1, eggs were scarcely detected up to 40 days of infection. In contrast, afive-fold increase in the number of de-tected eggs was observed on the 45th day post infection, with that num-ber increasing to a 100% on the 50th day. The percentage ratios liver-to-body weightandspleen-to-body weightalso revealed two distinct stages of the disease comparing 5 and 7 weeks post infection. Whilst a pro-nounced increased in the spleen was observed at the 5th week, a very small but significant increase in the liver weight of infected animals was detected in the same period. In stark contrast, at the 7th week post infection both liver and spleen were largely increased in the infect-ed animals, Supplemental Fig. 2. Histopathological and morphometric analyses revealed inflammatory infiltrates in the perivascular region of
the liver for both time points, with a pronounced increase (approx. 100%) in the number of cells at 7 weeks of infection, Supplemental Fig. 3.
3.2. There is a significant change in soluble liver proteome of mice infected with S. mansoni
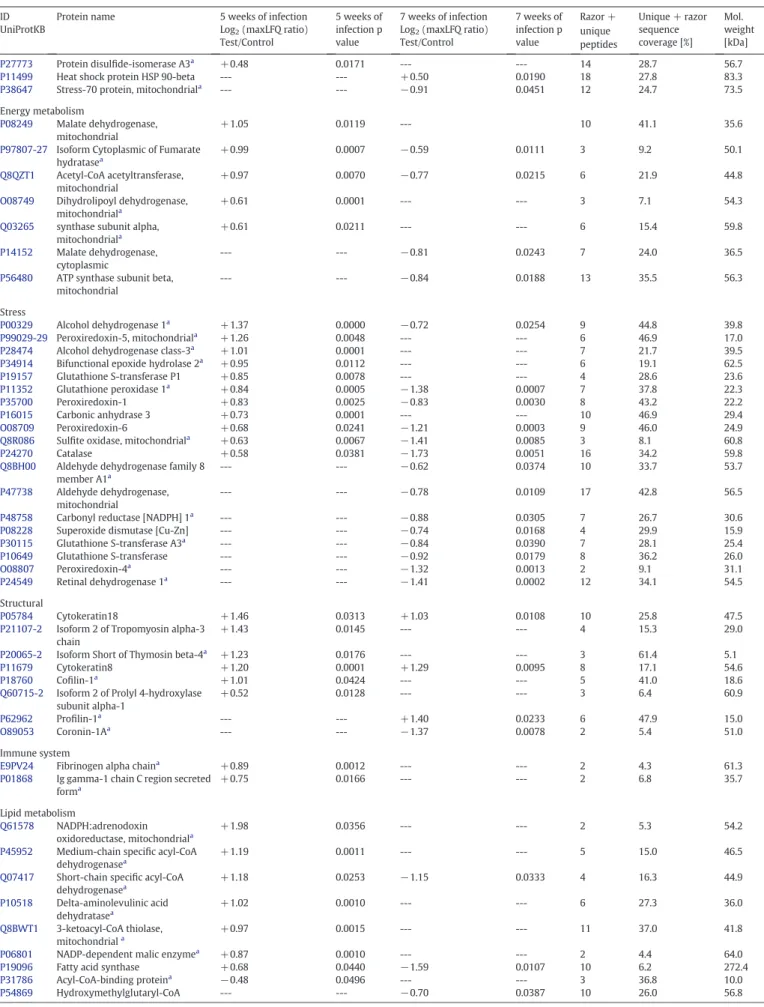
Our shotgun proteomic analysis allowed confident identification of 764 soluble liver proteins using the Maxquant® as the searching algo-rithm, Supplementary Table 1. The reproducibility of the biological trip-licates obtained from control and infected livers was assessed by a Spearman correlation, using LFQ intensity data. As shown in Supple-mental Fig. 4, correlation coefficients ranged from 0.92 to 0.98 for con-trol mice and from 0.87 to 0.92 for infected animals, attesting for the intrinsic homogeneity of the soluble preparations further subjected to comparisons. Then, by applying stringent criteria for measuring the rel-ative abundance of liver proteins from control and infected animals, we were able to quantify respectively, 174 and 164 molecules that exhibit-ed either up or downregulation of expression at 5 and 7 weeks post in-fection,Fig. 1and Supplementary Table 2. The liver soluble proteome of mice at the 5th week of infection revealed a total of 93 proteins signifi -cantly upregulated (p≤0.05) and only one protein significantly down-regulated, Fig. 1A. The vast majority of up-regulated molecules represented 53.4% of the quantifiable proteins found in this group. A contrasting pattern of protein expression was observed in 7th week in-fected mice. In those animals, only 10 proteins appeared upregulated whilst 51 were downregulated, totaling 61 altered proteins, representing 37.2% of the quantifiable proteins in this group,Fig. 1B. This marked change in protein profile comparing splenic and hepatosplenic schistosomiasis corroborates with our histologicalfi nd-ings. The hepatic parenchyma of the 5th week infected animals displayed a reduced number of only immature eggs and the initial re-cruitment of an inflammatory infiltrate,Fig. 1C. In contrast, an equiva-lent hepatic section, from the 7th week infected animal, is dominated by an intense granulomatous inflammation surrounding eggs present at much later stages of development,Fig. 1D.
3.3. Few protein categories remains significantly expressed in chronic liver schistosomiasis
All differentially expressed proteins (p≤0.05) were classified ac-cording to their biological functions (GO), in 17 distinct categories. At the 5th week post infection, from the 94 proteins significantly altered in the liver, over 70% were classified in the following categories: amino acid metabolism (19); stress (11); chaperone (10); lipid metab-olism (8); carbohydrate metabmetab-olism (7), structural (6), and signaling (6),Fig. 2A andTable 1. Glutamate dehydrogenase 1 (+2.40 fold) and Carbamoyl-phosphate synthase (+2.39 fold) were the two enzymes showing the highest fold increase in the amino acid metabolism catego-ry. Alcohol dehydrogenase 1 (+2.59 fold) and Peroxiredoxin-5 (+2.39) were abundant representatives of stress proteins. Among the quantified chaperones, calreticulin showed the highest increase (+2.33 fold). In the lipid metabolism category, NADPH: adrenodoxin oxidoreductase (+3.94 fold) and medium-chain acyl-CoA dehydroge-nase (+2.28 fold) merited attention. In the same category, acyl-CoA binding protein represented the only molecule significantly downregu-lated at the 5th post infection. L-lactate dehydrogenase A chain (+2.28 fold) and Pyruvate carboxylase (+2.16 fold) were the two major repre-sentatives within carbohydrate metabolism. In the group of structural proteins, cytokeratin 18 (+2.76 fold), isoform 2 of tropomyosin alpha-3 chain (+2.70 fold) and cytokeratin 8 (+2.30 fold) exhibited high expression levels. Within signaling, two isoforms of 14-3-3 pro-teins, calumenin and phosphatidylethanolamine-binding protein displayed over 2 fold increase in expression.
structural (3), chaperones (3), amino acid metabolism (1), signaling (1) and translation (1), Fig. 2B and Table 1. Structural proteins and chaperonins were the most upregulated at 7 weeks of infection. Three structural proteins that increased in abundance were profilin-1(+2.63 fold), cytokeratin 8 (+2.45 fold) and cytokeratin 18 (+2.04 fold). Chaperones constituted another class of proteins that persisted at in-creased levels up to the 7th week of infection. These included calreticulin (+2.25 fold), endoplasmin (+1.90 fold) and HSP 90-beta (+1.41 fold). Four other proteins showed significantly increased
abun-dance, these were gamma-glutamyltransferase (+9.16 fold –
aminoacid metabolism), lactate dehydrogenase (+1.63 fold– carbohy-drate metabolism), inositol monophosphatase 1(+1.28 fold– signal-ing) and elongation factor 2 (+1.43 fold–translation).
3.4. Five liver proteins remained significantly upregulated during splenic and hepatosplenic schistosomiasis
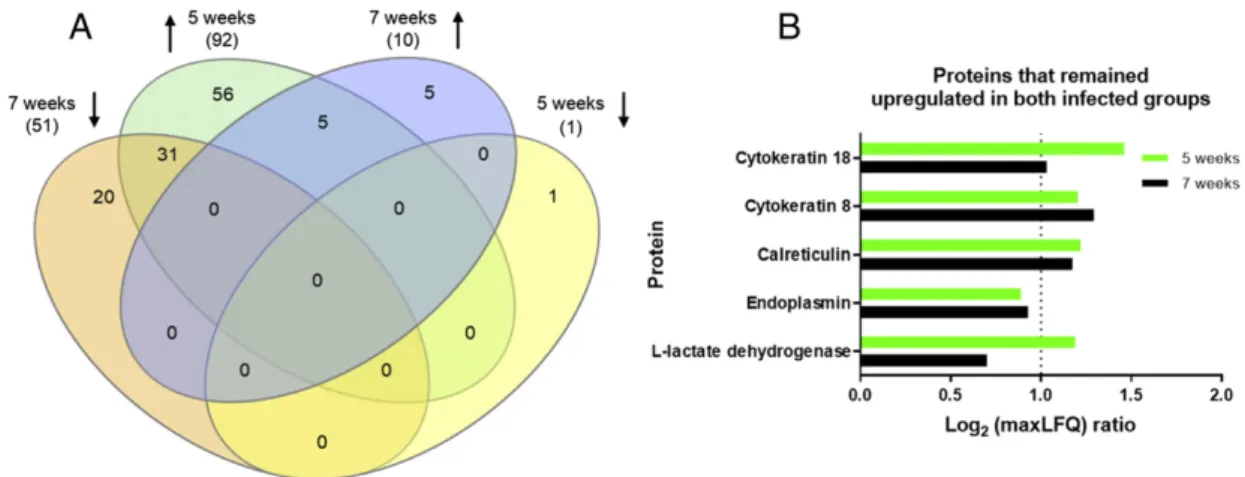
All proteins significantly altered in the liver of mice at the 5th and 7th week of infection, found to be up or downregulated, were examined using a Venn diagram in order to ease visualization of unique proteins found at each stage of the disease and those that were shared,Fig. 3A. From a total 92 proteins upregulated at 5 weeks of infection, 56 proteins are uniquely upregulated at this stage whilst another 31 proteins exhib-ited downregulation after 7 weeks of infection. At 7th week of infection, 51 proteins were downregulated of which 20 proteins were identified solely at this stage of the disease. Only 10 proteins were upregulated at the 7th week of infection, of whichfive were uniquely found at this stage (γ-glutamyltransferase; heat shock protein HSP 90-beta; profilin-1; inositol monophosphatase-1 and elongation factor-2). The remainingfive proteins maintained increased expression levels from the 5th week of infection onwards. These were represented by cytokeratin 8, cytokeratin 18, calreticulin, endoplasmin and L-lactate dehydrogenase,Fig. 3B. The persistently increased levels of thesefive proteins, during early and late chronic infection, were again confirmed
and validated through another mass-spectrometric approach provided by the Skyline algorithm (Supplemental Fig. 5).
3.5. Protein interaction network
The three molecules (calreticulin, endoplasmin and L-lactate dehy-drogenase) found at persistent high levels at the 5th and 7th week of in-fection, were selected for protein interaction network using the STRING algorithm. Further insights into novel interactors were gained by requesting the extra addition of the 20 most likely partners. KEGG path-way analysis of the resulting network revealed molecules involved in protein processing in the endoplasmic reticulum displaying the most prominent protein hubs (red nodes),Fig. 4. Other cellular pathways in-cluded antigen presentation, amino acid and carbohydrate metabolism.
4. Discussion
Here we aimed to quantitatively identify the alterations in the solu-ble liver proteome fromS. mansoniinfected-mice (Balb/c strain) using a large scale sequencing approach. In complement to previous studies, which pioneered similar investigation through use of 2-D electrophore-sis and MALDI-TOF/TOF analyelectrophore-sis for protein identification[4,6], here we made use of highly sensitive proteomic tools to expand the list of pro-teins playing specific roles in the murine model of liver schistosomiasis. Using stringent criteria of quantitation at the peptide level, we were able to confidently register minor variations in protein abundance com-paring infected and non-infected livers. As previously reported, two dis-tinct stages of the disease in the mouse model are of relevance. Firstly, splenomegaly develops without appreciable increase in the liver and, at the chronic phase, exacerbated hepatosplenomegaly is often ob-served[4,11]. The latter is also accompanied by intestinal disease due to the inflammation caused by parasite eggs[16]. These two distinct stages differ among various mice strains particularly concerning their timing and percentage of animals that end up exhibiting both disease states[5].
In this context, wefirst established the periods in which splenomeg-aly and hepatosplenomegsplenomeg-aly would be best distinguished in the Balb/c strain. We have chosen 5 weeks of infection to investigate the proteomic alterations seen during the splenic phase as parasite eggs in the faeces were lower, the spleen was over 100% large and the liver-to-body ratio had just significantly differed from non-infected mice. In stark con-trast, at 7 weeks post infection in this model, eggs were abundantly found in the faeces and both spleen-to-body and liver-to-body ratios greatly differed from control animals. These preliminary data on the characterization of the two stages of the disease were then corroborated by our histologicalfindings which demonstrated major in situ differ-ences in their inflammatory processes.
Large-scale protein analyses allow us to make a comparative measure-ment of many proteins simultaneously[17]. Identification of proteins present under varying dynamic ranges are greatly facilitated by increased resolution of chromatographic separations in parallel to high accuracy of mass analyzers[18,19]. Simultaneously, label-free proteomic approaches have been optimized to allow detection of small changes in protein abundance [20,21]. Here, we employed a label-free quantification method provided by the MaxQuant® algorithm[12,13]. A volcano plot allowed the observation that the majority of the identified liver proteins expressed at the splenic phase of the disease (5 weeks post infection) were upregulated. In total, 93 proteins exhibited significantly higher levels, 30 of which showing a minimum of 2 fold increase.
Table 1
Proteins significantly altered in the liver at the 5th and 7th week of infection.
ID UniProtKB
Protein name 5 weeks of infection Log2(maxLFQ ratio) Test/Control
5 weeks of infection p value
7 weeks of infection Log2(maxLFQ ratio) Test/Control
7 weeks of infection p value
Razor + unique peptides
Unique + razor sequence coverage [%]
Mol. weight [kDa]
Amino acid metabolism
P26443 Glutamate dehydrogenase 1,
mitochondrial +1.27 0.0003 – – 14 29.9 61.3
Q8C196 Carbamoyl-phosphate synthase, mitochondrial
+1.26 0.0017 −0.82 0.0066 62 50.1 164.6
O09173 Homogentisate 1,2-dioxygenase +1.11 0.0274 −0.75 0.0161 6 22.0 50.0
P11725 Ornithine carbamoyltransferase, mitochondrial
+1.09 0.0007 −1.05 0.0178 6 17.2 39.8
O35423-2 Serine–pyruvate aminotransferase,
mitochondriala +1.04 0.0180
−1.39 0.0013 6 19.9 43.5
P05202 Aspartate aminotransferase, mitochondrial
+0.93 0.0132 −0.65 0.0474 11 24.7 47.4
O09173 Homogentisate 1,2-dioxygenase +0.91 0.0462 --- --- 6 22.0 50.0
Q8QZR5 Alanine aminotransferase 1a +0.91 0.0059 −0.88 0.0202 5 11.7 55.1
Q8VBT2 L-serine dehydratase/L-threonine deaminasea
+0.90 0.0421 −1.82 0.0043 3 15.3 34.6
Q78JT3 3-Hydroxyanthranilate 3,4-dioxygenase
+0.86 0.0301 −1.23 0.0110 5 21.7 32.8
O09172 Glutamate–cysteine ligase
regulatory subunita +0.84 0.0023 --- --- 2 10.2 30.5
P50431 Serine hydroxymethyltransferase,
cytosolica +0.79 0.0000 --- --- 7 16.1 52.6
Q8CHT0 Delta-1-pyrroline-5-carboxylate
dehydrogenasea +0.68 0.0041
−1.39 0.0157 8 18.3 61.8
P49429 4-hydroxyphenylpyruvate
dioxygenase +0.66 0.0062
−0.80 0.0072 10 32.1 45.1
P05201 Aspartate aminotransferase, cytoplasmic
+0.65 0.0033 −0.68 0.0474 8 25.4 46.2
P29758 Ornithine aminotransferase,
mitochondriala +0.62 0.0489 --- --- 5 15.3 48.4
Q71RI9-2 Isoform 2 of
Kynurenine–oxoglutarate transaminase 3a
+0.59 0.0012 --- --- 3 11.7 47.3
O35490 Betaine–homocysteine S-methyltransferase 1
+0.59 0.0047 --- --- 9 31.9 45.0
P35492 Histidine ammonia-lyasea +0.43 0.0364 --- --- 4 7.80 72.3
P21981 Protein-glutamine gamma-glutamyltransferase
--- --- +3.20 0.0006 13 27.0 77.1
P16460 Argininosuccinate synthase --- --- −0.63 0.0261 12 28.2 46.6
Q8VCN5 Cystathionine gamma-lyasea --- --- −0.81 0.0026 7 24.9 43.6
P50247 Adenosylhomocysteinase --- --- −0.91 0.0296 11 26.2 47.7
Q8VC12 Urocanate hydratasea --- --- −1.93 0.0002 9 18.6 74.6
Carrier
P02089 Hemoglobin subunit beta-2 +1.19 0.0042 −1.28 0.0158 4 22.4 15.9
P07724 Serum albumin +1.02 0.0006 --- --- 26 45.7 68.7
P02088 Hemoglobin subunit beta-1 +0.94 0.0222 −1.29 0.0245 11 83.0 15.8
Carbohydrate metabolism
P06151 L-lactate dehydrogenase A chain +1.19 0.0005 +0.70 0.0387 10 28.3 36.5
Q05920 Pyruvate carboxylase,
mitochondriala +1.11 0.0301
−0.68 0.0435 15 14.6 129.7
Q8VC30 Bifunctional ATP-dependent +0.86 0.0030 −0.96 0.0123 6 17.1 59.7
P16858 Glyceraldehyde-3-phosphate
dehydrogenasea +0.81 0.0084 --- --- 8 32.4 35.8
P97328 Ketohexokinasea +0.76 0.0074 --- --- 2 10.7 32.8
P09411 Phosphoglycerate kinase 1a +0.75 0.0181 --- --- 8 28.5 44.6
P40142 Transketolasea +0.67 0.0004 --- --- 6 14.1 67.6
Q64442 Sorbitol dehydrogenasea --- --- −0.88 0.0127 9 32.2 38.2
O70475 UDP-glucose 6-dehydrogenasea --- --- −1.34 0.0031 2 4.7 54.8
Chaperones
P14211 Calreticulin +1.22 0.0050 +1.17 0.0093 9 31.5 48.0
Q64433 10 kDa heat shock protein,
mitochondriala +0.89 0.0137
−0.63 0.0226 4 45.1 11.0
P20029 78 kDa glucose-regulated protein +0.89 0.0056 --- 19 33.9 72.4
P08113 Endoplasmina +0.89 0.0030 +0.93 0.0043 16 24.8 92.5
P08003 Protein disulfide-isomerase A4 +0.87 0.0036 --- --- 5 11.3 72.0
P63038 60 kDa heat shock protein, mitochondrial
+0.81 0.0061 --- --- 13 25.1 61.0
P63017 Heat shock cognate 71 kDa protein +0.73 0.0264 --- --- 15 31.9 70.9
Q61316 Heat shock 70 kDa protein 4 +0.72 0.0283 --- --- 6 10.0 94.1
P80318 T-complex protein 1 subunit
Table 1(continued)
ID
UniProtKB Protein name 5 weeks of infectionLog2(maxLFQ ratio) Test/Control
5 weeks of infection p value
7 weeks of infection Log2(maxLFQ ratio) Test/Control
7 weeks of infection p value
Razor + unique peptides
Unique + razor sequence coverage [%]
Mol. weight [kDa]
P27773 Protein disulfide-isomerase A3a +0.48 0.0171 --- --- 14 28.7 56.7
P11499 Heat shock protein HSP 90-beta --- --- +0.50 0.0190 18 27.8 83.3
P38647 Stress-70 protein, mitochondriala --- --- −0.91 0.0451 12 24.7 73.5
Energy metabolism
P08249 Malate dehydrogenase, mitochondrial
+1.05 0.0119 --- 10 41.1 35.6
P97807-27 Isoform Cytoplasmic of Fumarate
hydratasea +0.99 0.0007
−0.59 0.0111 3 9.2 50.1
Q8QZT1 Acetyl-CoA acetyltransferase, mitochondrial
+0.97 0.0070 −0.77 0.0215 6 21.9 44.8
O08749 Dihydrolipoyl dehydrogenase,
mitochondriala +0.61 0.0001 --- --- 3 7.1 54.3
Q03265 synthase subunit alpha,
mitochondriala +0.61 0.0211 --- --- 6 15.4 59.8
P14152 Malate dehydrogenase,
cytoplasmic ---
---−0.81 0.0243 7 24.0 36.5
P56480 ATP synthase subunit beta, mitochondrial
--- --- −0.84 0.0188 13 35.5 56.3
Stress
P00329 Alcohol dehydrogenase 1a +1.37 0.0000 −0.72 0.0254 9 44.8 39.8
P99029-29 Peroxiredoxin-5, mitochondriala +1.26 0.0048 --- --- 6 46.9 17.0
P28474 Alcohol dehydrogenase class-3a +1.01 0.0001 --- --- 7 21.7 39.5
P34914 Bifunctional epoxide hydrolase 2a +0.95 0.0112 --- --- 6 19.1 62.5
P19157 Glutathione S-transferase P1 +0.85 0.0078 --- --- 4 28.6 23.6
P11352 Glutathione peroxidase 1a +0.84 0.0005 −1.38 0.0007 7 37.8 22.3
P35700 Peroxiredoxin-1 +0.83 0.0025 −0.83 0.0030 8 43.2 22.2
P16015 Carbonic anhydrase 3 +0.73 0.0001 --- --- 10 46.9 29.4
O08709 Peroxiredoxin-6 +0.68 0.0241 −1.21 0.0003 9 46.0 24.9
Q8R086 Sulfite oxidase, mitochondriala +0.63 0.0067 −1.41 0.0085 3 8.1 60.8
P24270 Catalase +0.58 0.0381 −1.73 0.0051 16 34.2 59.8
Q8BH00 Aldehyde dehydrogenase family 8
member A1a ---
---−0.62 0.0374 10 33.7 53.7
P47738 Aldehyde dehydrogenase, mitochondrial
--- --- −0.78 0.0109 17 42.8 56.5
P48758 Carbonyl reductase [NADPH] 1a --- --- −0.88 0.0305 7 26.7 30.6
P08228 Superoxide dismutase [Cu-Zn] --- --- −0.74 0.0168 4 29.9 15.9
P30115 Glutathione S-transferase A3a --- --- −0.84 0.0390 7 28.1 25.4
P10649 Glutathione S-transferase --- --- −0.92 0.0179 8 36.2 26.0
O08807 Peroxiredoxin-4a --- --- −1.32 0.0013 2 9.1 31.1
P24549 Retinal dehydrogenase 1a --- --- −1.41 0.0002 12 34.1 54.5
Structural
P05784 Cytokeratin18 +1.46 0.0313 +1.03 0.0108 10 25.8 47.5
P21107-2 Isoform 2 of Tropomyosin alpha-3
chain +1.43 0.0145 --- --- 4 15.3 29.0
P20065-2 Isoform Short of Thymosin beta-4a +1.23 0.0176 --- --- 3 61.4 5.1
P11679 Cytokeratin8 +1.20 0.0001 +1.29 0.0095 8 17.1 54.6
P18760 Cofilin-1a +1.01 0.0424 --- --- 5 41.0 18.6
Q60715-2 Isoform 2 of Prolyl 4-hydroxylase subunit alpha-1
+0.52 0.0128 --- --- 3 6.4 60.9
P62962 Profilin-1a --- --- +1.40 0.0233 6 47.9 15.0
O89053 Coronin-1Aa --- --- −1.37 0.0078 2 5.4 51.0
Immune system
E9PV24 Fibrinogen alpha chaina +0.89 0.0012 --- --- 2 4.3 61.3
P01868 Ig gamma-1 chain C region secreted
forma +0.75 0.0166 --- --- 2 6.8 35.7
Lipid metabolism
Q61578 NADPH:adrenodoxin
oxidoreductase, mitochondriala +1.98 0.0356 --- --- 2 5.3 54.2
P45952 Medium-chain specific acyl-CoA
dehydrogenasea +1.19 0.0011 --- --- 5 15.0 46.5
Q07417 Short-chain specific acyl-CoA
dehydrogenasea +1.18 0.0253
−1.15 0.0333 4 16.3 44.9
P10518 Delta-aminolevulinic acid
dehydratasea +1.02 0.0010 --- --- 6 27.3 36.0
Q8BWT1 3-ketoacyl-CoA thiolase,
mitochondriala +0.97 0.0015 --- --- 11 37.0 41.8
P06801 NADP-dependent malic enzymea +0.87 0.0010 --- --- 2 4.4 64.0
P19096 Fatty acid synthase +0.68 0.0440 −1.59 0.0107 10 6.2 272.4
P31786 Acyl-CoA-binding proteina −0.48 0.0496 --- --- 3 36.8 10.0
P54869 Hydroxymethylglutaryl-CoA --- --- −0.70 0.0387 10 26.0 56.8
Table 1(continued)
ID
UniProtKB Protein name 5 weeks of infectionLog2(maxLFQ ratio) Test/Control
5 weeks of infection p value
7 weeks of infection Log2(maxLFQ ratio) Test/Control
7 weeks of infection p value
Razor + unique peptides
Unique + razor sequence coverage [%]
Mol. weight [kDa]
synthase, mitochondriala
Nucleotide metabolism
P25688 Uricasea +1.40 0.0024 --- --- 11 36.6 35.0
P00375 Dihydrofolate reductasea +1.23 0.0020 --- --- 2 13.9 21.6
Q01768 Nucleoside diphosphate kinase B +0.60 0.0029 --- --- 6 35.5 17.4
Carbon metabolism Q8R0Y6 Cytosolic
10-formyltetrahydrofolate dehydrogenasea
+0.85 0.0001 −1.05 0.0064 25 39.5 98.7
Other processes
O88587-2 CatecholO-methyltransferasea +1.59 0.0108 --- --- 2 14.9 24.7
O08795-2 Glucosidase 2 subunit betaa +1.18 0.0082 --- --- 4 8.8 58.8
O88587 CatecholO-methyltransferasea +0.83 0.0026 --- --- 2 14.9 24.7
P52196 Thiosulfate sulfurtransferasea +0.70 0.0488 −0.53 0.0176 9 35.4 33.5
Q64105 Sepiapterin reductasea --- --- −0.87 0.0335 4 24.1 27.9
Protease
P10605 Cathepsin Ba +1.10 0.0108 --- --- 5 18.9 37.3
Signaling
P61982 14-3-3 protein gammaa +1.38 0.0006 --- --- 3 17.4 28.3
O35887 Calumenin +1.37 0.0090 --- --- 5 20.0 37.1
P63101 14-3-3 protein zeta/delta +1.20 0.0195 --- --- 7 39.6 27.8
P70296 Phosphatidylethanolamine-binding
protein 1a +1.06 0.0171
−0.51 0.0332 6 57.8 20.8
P11276 Fibronectina +0.84 0.0009 --- --- 4 2.3 272.5
Q64374 Regucalcina +0.81 0.0313 −1.11 0.0032 15 61.2 33.4
O55023 Inositol monophosphatase 1a --- --- +0.36 0.0087 2 7.2 30.4
Translation
Q91VI7 Ribonuclease inhibitor +1.03 0.0002 --- --- 5 16.4 49.8
P99027 60S acidic ribosomal protein P2a +0.69 0.0057 --- --- 4 53.0 11.7
P60843 Eukaryotic initiation factor 4A-Ia +0.67 0.0010 --- --- 5 16.7 46.2
P52760 Ribonuclease UK114a +0.58 0.0013 −1.79 0.0058 6 65.2 14.3
P58252 Elongation factor 2 --- --- +0.52 0.0171 12 16.7 95.3
Transcription
P02301 Histone H3.3Ca +0.87 0.0071 --- --- 2 11.8 15.3
O35737 Heterogeneous nuclear
ribonucleoprotein Ha +0.85 0.0208
−1.13 0.0011 3 11.1 49.2
P62806 Histone H4a +0.54 0.0078 --- --- 3 29.1 11.4
Transport
Q68FD5 Clathrin heavy chain 1a +1.08 0.0099 --- --- 9 8.1 191.6
The identified proteins were classified according to their biological function using Gene ontology (GO) and UniProtKB databases. Log2(maxLFQ) ratio≥1 corresponds to a 2-fold increase in abundance. (+) indicates increase in abundance whereas (−) indicates decrease in abundance. (—) indicates protein not identified/quantified in a particular group.
aNovel proteins found at altered levels in the Balb/c model of schistosomiasis. Protein names were listed as recommended by UniProt Knowledgebase
–UniProtKB.
Gene ontology categorization revealed many of these proteins in-volved in various cellular processes such as metabolism, stress, structur-al maintenance, immune response, and signstructur-aling. It is worth emphasizing that the 5th week post infection in the Balb/c model is characterized by the presence of mainly immature eggs in the liver pa-renchyma around which a granulomatous inflammation, induced by egg-released antigens, had just been triggered. At this point, spleno-megaly has been established and the liver of infected Balb/c mice re-vealed very active at up-regulating the levels of several molecules. Among the quantified proteins at this stage the urea cycle constituents were quite prominent indicating the need to detoxify ammonia into urea as a result of an increase in amino acid metabolism[22,23]. Such
might explain the consequent increase in anaerobic metabolism in the hepatic tissue. A testimonial of that important metabolic alteration is the observedN2-fold increase in abundance of lactate dehydrogenase. In fact, metabolomic investigations have revealed increased levels of lactate in the liver of 5 week-infected Balb/c mice[7].
As the infection progresses to the chronic phase, fully developed eggs are likely to become more competent at releasing parasite antigens in the liver tissue leading to a pronounced inflammation and conse-quently to major hepatotoxicity[26,27]. Indeed, the soluble liver prote-ome at 7 weeks post infection, was largely dominated by down-regulation of proteins. It is worth emphasizing that our stringent criteria for protein quantification probably excluded most of the proteins uniquely expressed by inflammatory cells, as they were not detected in the control samples or their corresponding levels were too low to be accurately quantified. Therefore, we believe the down-regulation of proteins seen at the chronic phase is predominantly a response of hepa-tocytes to the infection. Among the 61 proteins significantly altered, only 10 proteins exhibited up-regulation, these included chaperonins and structural proteins. Calreticulin and endoplasmin, two known con-stituents involved in protein folding at the endoplasmic reticulum, alongside the cytosolic HSP90-βwere found at high levels. Two other proteins of interest glutamineγ-glutamyltransferase and L-lactate de-hydrogenase, also showed higher expression in the hepatosplenic phase of the disease. Cytokeratins (K8 and K18) and profilin-1, a known regulator of cytoskeleton organization[28,29]are representa-tives of structural proteins that remained at high abundance, reaching N2 fold increase in chronic murine schistosomiasis.
It is of note that cytokeratins (K8 and K18), calreticulin, endoplasmin and L-lactate dehydrogenase were the onlyfive proteins found in this study to remain at high levels (N2 fold increase as judged by MaxQuant) during splenic and hepatosplenic schistosomiasis. Cytokeratins are con-stituents of intermediatefilaments, often occurring in pairs comprising of type I and type II cytokeratins[30,31]. Aside from their structural function these molecules have been shown to perform key roles in sig-naling, stress response, apoptosis and cell migration[32,33]. The specific tissue distribution of K8 and K18 keratins has instigated their potential use as biomarkers of liver disorders[34,35]. In fact, K18 is differentially expressed in the livers ofS. mansoni -infected animals and its presence in serum has been evaluated as a potential marker of infection by this parasite[6].
The remaining three proteins exhibiting persistent high levels in the two stages of the disease, calreticulin, endoplasmin and L-lactate dehy-drogenase were then selected as entries to build up a protein interaction network using the STRING algorithm. Analysis of the 20 most highly connected partners allowed easy observation of two major cellular pro-cesses operating in the diseased liver tissue. Firstly, a stress response in the endoplasmic reticulum (ER) is evident as in parallel to calreticulin and endoplasmin (labeled as Hsp90b1 in the network)[36,37], further additional 15 interactors made up a high confidence network composed mostly of chaperones. Possibly, this is a result of high demand in protein quality control in that compartment with consequent recovery of misfolded proteins or their destination to degradation via ERAD[38, 39]. Corroborating our experimental data, major players in the response to hypoxia, such as hypoxia up-regulated protein 1 (Hyou1), protein di-sulfide-isomerase A3, protein disulfide-isomerase A4 and prolyl-4 hy-droxylase (P4hb), the last three differentially identified in our study, showed up as strong interactors in the network. In fact, enolase 1 (eno1) a known target gene of the response to hypoxia[40,41]made up the missing link between the endoplasmic reticulum constituents and the increase in glycolytic enzymes in the cytosol, including lactate dehydrogenase. The metabolic alterations seen in the liver during chronic schistosomiasis could ultimately lead to prohibitive low levels of intra-hepatic ATP, hence contributing to irreversible organ failure and to foreseeable death of the vertebrate host.
It is important to emphasize that the proteomic alterations observed in our investigation are in good agreement with those previously
reported by Manivannan et al.[5], in which a 2D-DIGE approach was employed. However, considering the commonalities observed, fold al-terations are not directly comparable as the former study relied on quantification based on protein spot volume and only changes exhibitingN2fold increase or decrease in expression were reported. Moreover, a different mouse strain was used in that study and most of theirfindings are related to proteomic alterations observed by compar-ing non-infected animals with those exhibitcompar-ing the pre hepatosplenic schistosomiasis. Composing the list of proteins that exhibited fold dis-crepancies between these two studies are some molecules involved in amino acid metabolism and stress response, such as glutamate dehy-drogenase, carbamoyl phosphate synthase and glutathione S-transfer-ase P1.
We believe the novel set of proteins presented in this shotgun anal-ysis greatly expanded our understanding on the establishment of liver disease caused byS. mansoni. In parallel, it opened up new perspectives for searching biomarkers that could aid in early diagnosis to favor treat-ment and prevent the chronic and often irremediable complications of this condition.
5. Conclusions
In this work we conducted a quantitative shotgun proteomic analy-sis of the liver soluble proteome ofS. mansoni-infected Balb/c mice dur-ing splenic and hepatosplenic schistosomiasis. Our data revealed the former stage dominated by up-regulation of molecules at the 5th post infection, coincident with the onset of oviposition. In stark contrast, the proteome of chronically infected liver revealed predominantly down-regulation of molecules with few classic representatives, in-volved in endoplasmic reticulum stress and anaerobic metabolism, maintained at persistent high levels.
Supplementary data to this article can be found online athttp://dx. doi.org/10.1016/j.jprot.2016.07.013.
Authors' contributions
JMC, LXN, NCNP, RAOC performed the experiments. All the listed au-thors designed the experiments and analysed the data. JMC, LXN and WCB wrote the manuscript.
Conflicts of interest
None declared.
Transparency document
TheTransparency documentassociated with this article can be found, in the online version.
Funding sources
This work wasfinancially supported by‘Fundação de Amparo à Pesquisa do Estado de Minas Gerais’(FAPEMIG, grant number APQ-02660-10) and‘Coordenação de Aperfeiçoamento de Pessoal de Nível Superior’(CAPES–grant number 170/2012). Complementary research fundings were also obtained from UFOP (grant numbers: 23109.006271/2014-70 and 23109.003753/2015-59). JMC was a recip-ient of a CAPES scholarship for the funding of his MSc degree in Biotechnology.
References
[1] Y. Lu, et al., Identification and profiling of circulating antigens by screening with the sera from schistosomiasis japonica patients, Parasit Vectors 5 (2012) 115. [2] D. Wichmann, et al., Diagnosing schistosomiasis by detection of cell-free parasite
[3] F.R. Martins-Melo, et al., Trends in schistosomiasis-related mortality in Brazil, 2000– 2011, Int. J. Parasitol. 44 (14) (2014) 1055–1062.
[4] M. Harvie, T.W. Jordan, A.C. La Flamme, Differential liver protein expression during schistosomiasis, Infect. Immun. 75 (2) (2007) 736–744.
[5] B. Manivannan, et al., Proteomic changes at 8 weeks after infection are associated with chronic liver pathology in experimental schistosomiasis, J. Proteome 75 (6) (2012) 1838–1848.
[6] B. Manivannan, et al., Identification of cytokeratin 18 as a biomarker of mouse and human hepatosplenic schistosomiasis, Infect. Immun. 79 (5) (2011) 2051–2058. [7] J. Wu, et al., Metabolic changes reveal the development of schistosomiasis in mice,
PLoS Negl. Trop. Dis. (2010) 4(8).
[8] C.I. Balog, et al., Metabonomic investigation of humanSchistosoma mansoni infec-tion, Mol. BioSyst. 7 (5) (2011) 1473–1480.
[9] S.R. Smithers, R.J. Terry, The infection of laboratory hosts with cercariae of Schistosoma mansoniand the recovery of the adult worms, Parasitology 55 (4) (1965) 695–700.
[10] R.H. Duvall, W.B. DeWitt, An improved perfusion technique for recovering adult schistosomes from laboratory animals, Am.J.Trop. Med. Hyg. 16 (4) (1967) 483–486.
[11]G.S. Henderson, et al., Two distinct pathological syndromes in male CBA/J inbred mice with chronicSchistosoma mansoniinfections, Am. J. Pathol. 142 (3) (1993) 703–714.
[12] J. Cox, M. Mann, MaxQuant enables high peptide identification rates, individualized p.p.b.-range mass accuracies and proteome-wide protein quantification, Nat. Biotechnol. 26 (12) (2008) 1367–1372.
[13] J. Cox, et al., Accurate proteome-wide label-free quantification by delayed normali-zation and maximal peptide ratio extraction, termed MaxLFQ, Mol. Cell. Proteomics 13 (9) (2014) 2513–2526.
[14]B. Schilling, et al., Platform-independent and label-free quantitation of proteomic data using MS1 extracted ion chromatograms in skyline: application to protein acet-ylation and phosphoracet-ylation, Mol. Cell. Proteomics 11 (5) (2012) 202–214. [15]D. Szklarczyk, et al., STRING v10: protein-protein interaction networks, integrated
over the tree of life, Nucleic Acids Res. 43 (Database issue) (2015) D447–D452. [16] B. Manivannan, et al., Differential patterns of liver proteins in experimental murine
hepatosplenic schistosomiasis, Infect. Immun. 78 (2) (2010) 618–628.
[17]M. Mann, et al., The coming age of complete, accurate, and ubiquitous proteomes, Mol. Cell 49 (4) (2013) 583–590.
[18] Q. Hu, et al., The Orbitrap: a new mass spectrometer, J. Mass Spectrom. 40 (4) (2005) 430–443.
[19] N. Nagaraj, et al., System-wide perturbation analysis with nearly complete coverage of the yeast proteome by single-shot ultra HPLC runs on a bench top Orbitrap, Mol Cell Proteomics 11 (3) (2012) M111 013722.
[20] D. Chelius, P.V. Bondarenko, Quantitative profiling of proteins in complex mixtures using liquid chromatography and mass spectrometry, J. Proteome Res. 1 (4) (2002) 317–323.
[21]K.A. Neilson, et al., Label-free quantitative shotgun proteomics using normalized spectral abundance factors, Methods Mol. Biol. 1002 (2013) 205–222.
[22] C. Spanaki, A. Plaitakis, The role of glutamate dehydrogenase in mammalian ammo-nia metabolism, Neurotox. Res. 21 (1) (2012) 117–127.
[23]L. Jin, et al., Glutamate dehydrogenase 1 signals through antioxidant glutathione peroxidase 1 to regulate redox homeostasis and tumor growth, Cancer Cell 27 (2) (2015) 257–270.
[24] K.J. Nytko, et al., Regulated function of the prolyl-4-hydroxylase domain (PHD) ox-ygen sensor proteins, Antioxid. Redox Signal. 9 (9) (2007) 1329–1338.
[25] H. Boulahbel, R.V. Duran, E. Gottlieb, Prolyl hydroxylases as regulators of cell metab-olism, Biochem. Soc. Trans. 37 (Pt 1) (2009) 291–294.
[26] M.H. Abdulla, et al., Proteomic identification of IPSE/alpha-1 as a major hepatotoxin secreted bySchistosoma mansonieggs, PLoS Negl. Trop. Dis. 5 (10) (2011), e1368. [27] W. Mathieson, R.A. Wilson, A comparative proteomic study of the undeveloped and
developedSchistosoma mansoniegg and its contents: the miracidium, hatchfluid and secretions, Int. J. Parasitol. 40 (5) (2010) 617–628.
[28] M. Pae, G.R. Romeo, The multifaceted role of profilin-1 in adipose tissue infl amma-tion and glucose homeostasis, Adipocyte 3 (1) (2014) 69–74.
[29]F. Bordeleau, et al., Keratin 8/18 regulation of cell stiffness-extracellular matrix in-terplay through modulation of rho-mediated actin cytoskeleton dynamics, PLoS One 7 (6) (2012), e38780.
[30]J. Schweizer, et al., New consensus nomenclature for mammalian keratins, J. Cell Biol. 174 (2) (2006) 169–174.
[31] R. Moll, M. Divo, L. Langbein, The human keratins: biology and pathology, Histochem. Cell Biol. 129 (6) (2008) 705–733.
[32] T. Busch, et al., Keratin 8 phosphorylation regulates keratin reorganization and mi-gration of epithelial tumor cells, J. Cell Sci. 125 (Pt 9) (2012) 2148–2159. [33] C.M. Alam, et al., Keratin 8 modulates beta-cell stress responses and
normoglycaemia, J. Cell Sci. 126 (Pt 24) (2013) 5635–5644.
[34] N.O. Ku, et al., Keratin 8 and 18 mutations are risk factors for developing liver dis-ease of multiple etiologies, Proc. Natl. Acad. Sci. U. S. A. 100 (10) (2003) 6063–6068. [35] P.A. Coulombe, M.B. Omary,‘hard’and‘soft’principles defining the structure, func-tion and regulafunc-tion of keratin intermediatefilaments, Curr. Opin. Cell Biol. 14 (1) (2002) 110–122.
[36] J. Khalife, et al., Cloning of the gene encoding aSchistosoma mansoniantigen homol-ogous to human Ro/SS-A autoantigen, Mol. Biochem. Parasitol. 57 (2) (1993) 193–202.
[37]Z. Yang, et al., Upregulation of heat shock proteins (HSPA12A, HSP90B1, HSPA4, HSPA5 and HSPA6) in tumour tissues is associated with poor outcomes from HBV-related early-stage hepatocellular carcinoma, Int J Med Sci 12 (3) (2015) 256–263.
[38] A. Stolz, D.H. Wolf, Endoplasmic reticulum associated protein degradation: a chaper-one assisted journey to hell, Biochim. Biophys. Acta 1803 (6) (2010) 694–705. [39] L. Dara, C. Ji, N. Kaplowitz, The contribution of endoplasmic reticulum stress to liver
diseases, Hepatology 53 (5) (2011) 1752–1763.
[40] G.L. Semenza, et al., Hypoxia response elements in the aldolase A, enolase 1, and lac-tate dehydrogenase A gene promoters contain essential binding sites for hypoxia-inducible factor 1, J. Biol. Chem. 271 (51) (1996) 32529–32537.