Mónica Luís Pereira Rodrigues
Licenciatura em Ciências de Engenharia do Ambiente
Dissolved Organic Nitrogen behaviour
during denitrification with suspended and
attached biomass
Dissertação para obtenção do Grau de Mestre em Engenharia do Ambiente, perfil Engenharia Sanitária
Orientador: Professora Doutora Leonor Miranda Monteiro do Amaral,
Professora Auxiliar FCT/UNL
Co-
orientador: Engª Diana Teixeira D’Aguiar Norte Brandão, TU Delft
Jurí:
Presidente e Arguente: Prof. Doutor António Pedro de Macedo Coimbra Mano Vogais: Prof. Doutora Rita Maurício Rodrigues Rosa
Prof. Doutora Leonor Miranda Monteiro do Amaral
i
Mónica Luís Pereira Rodrigues
Licenciatura em Ciências de Engenharia do Ambiente
Dissolved Organic Nitrogen behaviour
during denitrification with suspended and
attached biomass
Dissertação para obtenção do Grau de Mestre em Engenharia do Ambiente, perfil Engenharia Sanitária
Orientador: Professora Doutora Leonor Miranda Monteiro do Amaral,
Professora Auxiliar FCT/UNL
Co-
orientador: Engª Diana Teixeira D’Aguiar Norte Brandão, TU Delft
Jurí:
Presidente e Arguente: Prof. Doutor António Pedro de Macedo Coimbra Mano Vogais: Prof. Doutora Rita Maurício Rodrigues Rosa
Prof. Doutora Leonor Miranda Monteiro do Amaral
iii
Dissolved Organic Nitrogen behaviour during denitrification with suspended and
attached biomass
© Copyright em nome de Mónica Luís Pereira Rodrigues, da FCT/UNL e da UNL
v
Acknowledgments
First I would like to thank to Diana Brandão for all of her support and availability in this
project, for her precious teachings and most of all for her friendship.
To all of the amazing PhD and MSc students that worked with me, those long days and
nights, in the water lab at TU Delft. A special thanks to Xuedong, Dara, Hale, Evren,
Zhongbo, Mohamed, Daniel and Vincent.
To UNESCO-IHE for giving me the possibility to work in their laboratories. To all the great
students that I was lucky to meet, thank you for receiving me as one of you.
To my friends in The Netherlands, thank you. The ones that I met in Nijmegen and the ones
that I met in Delft, all of you, in a certain way, contributed to this final report.
A special thanks to Sophie, Mohaned, and the amazing small group from Wijnhaven for their
true friendship and support every day.
To everyone from the De Botte Bijl, for being so much more than a home to me and for
including me in your own family.
A todos os professores da FCT/UNL que deram o seu contributo na minha formação, em especial à Professora Doutora Leonor Amaral pela oportunidade de integrar este projecto e por toda a sua orientação não só nesta dissertação mas também ao longo destes anos.
A todos os meus amigos que ao longo destes anos contribuíram directa ou indirectamente para a realização deste trabalho.
Em especial ao Alcides Amaro, que me desafiou a ingressar no ensino superior, por toda a presença constante e amizade demonstrada ao longo destes anos.
À Sara Godinho, André Barbosa, Filipa Mesquita por toda a vossa amizade, carinho e apoio desde sempre.
À Catarina Chemetova, grande amiga e companheira de guerra em todo este percurso.
Finalmente, à minha família que esteve sempre comigo na minha educação e formação. À Baguera e ao Joy por todos os momentos de felicidade. Em especial à minha mãe, o pilar da
vii “It is not enough to be busy.
So are the ants. The question is: What are we busy about?”
ix
Resumo
Numa estação de tratamento de água residual o azoto orgânico dissolvido (DON) representa uma fracção importante de N no efluente final. Este trabalho tem por objectivo a análise do
DON ao longo do processo de desnitrificação, com biomassa suspensa e fixa.
Para tal, foram feitos ensaios experimentais de desnitrificação com lamas activadas e
suportes (kaldnes) de filme biológico. Para os ensaios com kaldnes foram utilizadas duas velocidades de mistura diferentes para a avaliação da sua influência nas concentrações de DON. Em todos os ensaios as concentrações de COD e DOC foram avaliadas. As concentrações de DON no efluente original e durante os processos de desnitrificação com
kaldnes foram comparadas.
As concentrações de DON variam entre 0.1 e 1.9 mg/l durante os processos de desnitrificação. A comparação feita entre as concentrações de DON no efluente original e as medições de DON durante os ensaios confirma que DON tem uma percentagem significativa (aproximadamente 20%) de N no efluente final. Os resultados obtidos indicam que DON tem uma variação constante ao longo do processo de desnitrificação.
Palavras-chave: Água residual, azoto orgânico dissolvido, desnitrificação, lamas activadas,
xi
Abstract
In a wastewater treatment plant (WWTP) dissolved organic nitrogen (DON) represents an
important fraction of N in the final effluent. The purpose of this study was to analyze DON
changes along denitrification with suspended and attached biomass.
Denitrification batch experiments were carried out with activated sludge and biological
(kaldnes) carriers. In the batch tests with kaldnes it was used two different mixing velocities
to evaluate its influence in DON concentrations. For the batch tests were evaluated COD and
DOC concentrations. A comparison of the fate of DON during a denitrification process and
the original effluent DON concentration was made.
DON determinations oscillate in a range from 0.1 to 1.9 mg/l during a denitrification test. The
comparison between DON determinations and the original effluent confirm that DON has a
significant portion (about 20%) of the effluent N. The results obtained indicate that DON has
a constant behavior along the denitrification process.
Key words: wastewater, dissolved organic nitrogen, denitrification, activated sludge, kaldnes
xiii
Table of Contents
1. Introduction ... 1
1.1. General context ... 1
1.2. Quality standards for wastewater discharge ... 3
2. Thesis Objective ... 5
3. Literature Review ... 7
3.1. Nitrogen cycle ... 7
3.2. Nitrogen in wastewater treatment ... 8
3.3. DON – Definition and Characterization ... 10
3.4. Adverse effects ... 11
3.5. Measurement techniques ... 13
3.6. Removal techniques ... 16
4. Materials and Methods ... 19
4.1. Experimental SET-UP ... 19
4.2. Batch tests with activated sludge ... 19
4.3. Batch tests with kaldnes carriers ... 22
4.4. Preparation of solutions ... 26
4.5. Analytical measurements ... 26
5. Results and discussion ... 29
5.1. Batch tests with activated sludge ... 29
5.2. Batch tests with kaldnes carriers ... 33
6. Conclusions ... 43
7. Recommendations... 45
Appendixes ... 53
I.I. NOx concentrations along the denitrification tests ... 55
I.II. Chemical Oxygen Demand along the denitrification tests ... 59
I.III. Dissolved Organic Carbon along the denitrification tests ... 65
I.IV. Dissolved Organic Nitrogen along the denitrification tests ... 71
Appendix II. Kaldnes cariers specifications ... 75
xv
List of Figures
Figure 3.1 – Nitrogen cycle. ... 7
Figure 4.1 – Activated sludge aeration ...20
Figure 4.2 – Denitrification batch test with activated sludge ...20
Figure 4.3 – Separation of kaldnes carriers from the feeding solution ... 23
Figure 4.4 – Denitrification batch test with kaldnes carriers ... 25
Figure 5.1 – Inorganic nitrogen concentrations over time during activated sludge tests a, b and c. ...29
Figure 5.2 – Comparison between the NOx concentrations and dissolved organic nitrogen concentrations in the activated sludge tests a, b and c. ...32
Figure 5.3 – Inorganic nitrogen concentrations over time during the low velocity kaldnes tests a, b and c. ...34
Figure 5.4 – Comparison between the NOx concentrations and chemical oxygen demand concentrations in the low velocitykaldnes test a...36
Figure 5.5 – Comparison between the NOx concentrations and dissolved organic nitrogen concentrations in the low velocity kaldnes tests a, b and c. ...37
Figure 5.6 – Inorganic nitrogen concentrations over time during high velocity kaldnes tests a, b and c. ...38
Figure 5.7 – Comparison between the NOx concentrations and dissolved organic nitrogen concentrations in the high velocity kaldnes tests a, b and c. ...40
Figure 5.8 – Original effluent organic nitrogen concentrations. ...42
Figure I.1– Variation of NOx concentration along activated sludge tests a, b and c. ...55
Figure I.2 – Variation of NOx concentration along the low velocity kaldnes carriers tests a, b and c. ...56
Figure I.3 – Variation of NOx concentration along the high velocity kaldnes carriers tests a, b and c. ...57
Figure I.4 – Comparison between the NOx concentrations and chemical oxygen demand concentrations in the activated sludge tests a, b and c. ...59
Figure I.6 – Comparison between the NOx concentrations and chemical oxygen demand
concentrations in the low velocity kaldnes carriers tests a, b and c. ...61
Figure I.7 – Comparison between the NO3 concentrations and chemical oxygen demand
concentrations in the low velocity kaldnes carriers tests a, b and c. ...62
Figure I.8 – Comparison between the NOx concentrations and chemical oxygen demand
concentrations in the high velocity kaldnes carriers tests a, b and c. ...63
Figure I.9 – Comparison between the NO3 concentrations and chemical oxygen demand
concentrations in the high velocity kaldnes carriers tests a, b and c. ...64
Figure I.10 – Comparison between the NOx concentrations and dissolved organic carbon
concentrations in the activated sludge tests a, b and c. ...65
Figure I.11 – Comparison between the NO3 concentrations and dissolved organic carbon
concentrations in the activated sludge tests a, b and c. ...66
Figure I.12 – Comparison between the NOx concentrations and dissolved organic carbon
concentrations in the low velocity kaldnes carriers tests a, b and c. ...67
Figure I.13 – Comparison between the NO3 concentrations and dissolved organic carbon
concentrations in the low velocity kaldnes carriers tests a, b and c. ...68
Figure I.14 – Comparison between the NOx concentrations and dissolved organic carbon
concentrations in the high velocity kaldnes carriers tests a, b and c. ...69
Figure I.15 – Comparison between the NO3 concentrations and dissolved organic carbon
concentrations in the high velocity kaldnes carriers tests a, b and c. ...70
Figure I.16 – Comparison between the NO3 concentrations and dissolved organic nitrogen
concentrations in the activated sludge tests a, b and c. ...71
Figure I.17 – Comparison between the NO3 concentrations and dissolved organic nitrogen
concentrations in the low velocity kaldnes carriers tests a, b and c. ...72
Figure I.18 – Comparison between the NO3 concentrations and dissolved organic nitrogen
concentrations in the high velocity kaldnes carriers tests a, b and c. ...73
xvii
List of tables
Table 1.1 – Regulations for Total Nitrogen and future limits ... 3
Table 3.1 – Methods for total dissolved nitrogen analysis. ...15
Table 4.2 – Composition of the Synthetic Wastewater ...22
Table 4.3 – Composition of Buffer Solution ...22
Table 5.1 – SDNR for activated sludge tests ...30
Table 5.2 – SDNR for kaldnes tests with velocity 1 ...35
Table 5.3 – SDNR for kaldnes high velocity tests ...39
Table II.1 – Characteristics of the kaldnes (k1) carrier. ...75
xix
Abbreviators
BNR Biological nutrient removal
C2H9NaO5 Sodium Acetate Trihydrate
CO2 Carbon dioxide
COD Chemical oxygen demand
DCAA Dissolved combined amino acids
DFAA Dissolved free amino acids
DHAA Dihaloacetic acids
DIN Dissolved inorganic nitrogen
DO Dissolved oxygen
DOC Dissolved organic carbon
DOM Dissolved organic matter
DON Dissolved organic nitrogen
EPS Extracellular polymeric substances
H2O2 Hydrogen peroxide
H2SO4 Sulfuric acid
HNP Harnaschpolder
HSO4- Hydrogen sulphate
K2HPO4 Dipotassium phosphate
K2SO4 Potassium sulfate
N Nitrogen
N2 Nitrogen gas
Na2HPO4 Disodium phosphate
NaH2PO4.2H2O Sodium dihydrogen phosphate
NaNO3 Sodium nitrate
NDMA N-nitrosodimethylamine
NH3 Ammonia
NH4+ Ammonium
NO2 Nitrite
NO3- Nitrate
S2O82- Peroxodisulfate ion
SAT Solution of sodium acetate trihydrate
SDNR Specific denitrification rates
TDN Total dissolved nitrogen
THM Trihalomethanes
TiO2 Titanium dioxide
TKN Total Kjeldahl nitrogen
TN Total nitrogen
TOC Total organic carbon
TSS Total suspended solids
VSS Volatile suspended solids
1
1.
Introduction
1.1.General context
As an element that occurs naturally, nitrogen is a limiting nutrient for growth and
reproduction of living organisms (Pagilla et. al., 2011). Causing an increase in
worldfood production and a decrease in hunger, nitrogen fertilizer has been an
essential component of the Green Revolution (Howarth, 2004).
The human activities are changing nitrogen natural cycle, increasing the levels of total
dissolved nitrogen in many surface waters through wastewater discharges, agricultural
runoff, and NOx deposition (Vitousek et. al., 1997).
Although nitrogen is essential for living organisms, in extreme concentrations, often in
nitrate form, presents a problem of growing concern for water-quality (Burgin and
Hamilton, 2007). In excessive concentrations it holds severe threats to human health
and to ecological functioning of both terrestrial and aquatic ecosystems, especially
coastal marine ecosystems (Howarth, 2004).
Nitrogen pollution has a direct consequence in acidifying soils and waters, leading
coastal marine ecosystems to eutrophication and loss of biodiversity in a variety of
terrestrial and aquatic ecosystems (Howarth, 2004). Nowadays, eutrophication and
other adverse effects are growing problems in many identified regions (Arnaldos and
Pagilla, 2010).
Effluent discharged from municipal wastewaters and the stormwater runoff from
urbanized areas, are an important antropogenic nitrogen source (Pehlivanoglu-Mantas
and Sedlak, 2006). Due to the concerns related with the adverse effects of nitrogen,
the installation of nitrification/denitrification systems at numerous municipal wastewater
treatment plants (WWTP) was conducted (Pehlivanoglu-Mantas and Sedlak, 2004).
With the intent to protect the receiving water many municipal wastewater treatment
facilities are facing the challenge of eliminating nitrogen and phosphorus to much lower
effluent concentrations so that the eutrophication problem in surface waters decreases.
To achieve these low values of nitrogen removal, biological nutrient removal (BNR)
processes are pushed to their limits in order to transform ammonium, nitrate and nitrite
The Water Framework Directive (2000), in the European Union, and the Environmental
Protection Agency, in the United States have the intent to achieve very low nutrient
levels, basically a discharge of total nitrogen (TN) below 3 mg/l (Arnaldos and Pagilla,
2010).
The majority of nitrogen discharged by WWTP is identified in most systems as being
nitrate and ammonia. Dissolved organic nitrogen (DON), another important form of
nitrogen, typically accounts for less than 10% of the nitrogen in the wastewater effluent
(Pehlivanoglu-Mantas and Sedlak, 2004). However, when total TN has to be reduced
to very low levels effluent DON becomes more important (Pagilla et. al., 2006). Then
with the successful removal of inorganic nitrogen DON becomes the majority fraction in
the final effluents (from 56 to 95% of TON in secondary effluents) (Sattayatewa et. al.,
2009).
DON, in a practical sense, can be defined as that portion of organic nitrogen that
passes through 0.45 micrometer (μ) membrane filters (Randtke et. al., 1978).
Finally, DON is present in the total dissolved nitrogen (TDN) together with the inorganic
species. Where TDN is (Lee and Werterhoff, 2005):
TDN = NO3- + NO2- + NH3+/NH4+ + DON
With more stringent effluent limits for TN, the concern of WWTP for the DON portion of
the effluent nitrogen is increasing. Since DON is a precursor of potent carcinogenic
nitrogenous disinfection byproducts (which are secondary products originated from
drinking or waste water disinfection and may pose health risks (US EPA, 2013)), such
as nitrosamines, nitromethanes and N-nitrosodimethylamine (NDMA), has also led to
emerging concerns over the discharge of DON in effluents from wastewater or
agricultural sources (Bratby et. al., 2008).
Considering biological process effluents, the present dissolved organic matter (DOM)
composed of soluble organic carbon and nitrogen may have microbial origin rather than
the original organic substrates (Pagilla et. al., 2008). Another concern is the shear force
in a stable structure of biofilm, in a BNR process. The shear force (detachment force
resulting from liquid flow and particle–particle collision (Liu and Tay, 2002)) leads to
extracellular polymeric substances (EPS) production and its accumulation through
biological shear stress. In denitrification processes the shear force can cause impact,
3
From a wastewater treatment perspective it is essential to understand the
transformations and fate of DON through a BNR treatment. The study of DON in a
denitrification process is important to provide knowledge in the effluent quality, while
aiming to achieve effluent limits for discharge.
1.2.Quality standards for wastewater discharge
Nutrient targets are largely a means to an end to manage water quality or achieve
conservation objectives for a particular site. Therefore, with the European Water
Framework Directive for the effluent there will be a change in, among others, nitrogen
concentrations (Boelee, 2010).
Table 1.1 – Regulations for Total Nitrogen and future limits. (Adapted from Boelee, 2010)
Current Applicable from 2015 upfront
N (mg/l) 10 2.2
The current regulations for total nitrogen in wastewater treatment plant effluents are
also in the United States approaching 5 mg/l or less to control eutrophication and
hypoxia conditions in estuaries and bays. Though, with the current development in
removal techniques, is possible to achieve a high inorganic removal, and consequently
DON presence is maintained being the major nitrogen form (>50%) of the TDN effluent.
So the challenge is now constituted by the residual DON, which makes part of about
one-third to one-half of the effluent TN. To respect the discharge limits and meet a very
low N, water quality criteria may be challenging and not economically sustainable,
unless there is the development of new methods to address the fate and
biodegradability of effluent DON (Simsek et. al., 2013).
Thus, with the goals of lower TN effluent concentrations, in Europe and in the United
States, the contribution of effluent organic nitrogen has currently gaining an increased
5
2.
Thesis Objective
The purpose of this research is to evaluate the variation of DON concentration during
the process of denitrification of suspended and attached biomass. In order to achieve
such purpose, denitrification batch experiments were carried out with activated sludge
and biological carriers. A second objective was to evaluate the effect of shear stress on
DON variation, for which different mixing velocities were used during denitrification
batch tests with attached biomass. In both tests, the denitrification process was
characterized through inorganic and organic nitrogen measurements, as well as COD,
7
3.
Literature Review
3.1.Nitrogen cycle
Nitrogen gas (N2) is part of 78% of Earth’s atmosphere and is a key element for
proteins and cells (US EPA, 2010). It is the fourth most common chemical in living
tissues, behind oxygen, carbon and hydrogen (Vitousek, 1997). The nitrogen that is
present as molecular N2in the atmosphere and dissolved in the world’s oceans, which
is the majority of N on earth, only becomes reactive and biologically available to plants
and algae through the process of bacterial nitrogen fixation, fixation by lightning and
volcanic activity, and fixation from industrial activities including the manufacturing of
inorganic nitrogen fertilizer and the combustion of fossil fuel (Howarth, 2004).
Thus, plants (and all organisms) must wait for the nitrogen to be “fixed”, that is, getting
to bond from the air with hydrogen or oxygen to from inorganic compounds, mainly
ammonia (NH3) and nitrate (NO3-), that they can use (Vitousek, 1997).
The major transformations of nitrogen are nitrogen fixation, nitrification, denitrification,
anammox, and ammonification and the transformation of nitrogen into its many
oxidation states is key to productivity in the biosphere (Vitousek et. al., 2002).
The biological conversion of ammonia/ammonium to nitrate is called nitrification.
Nitrification is a two-step process. The first part up to nitrite (NO2-) is conducted by NH3
-(Adapted from Bungay and Bungay, 2009)
oxidizers or primary nitrifiers, whereas the second step is carried out by NO2--oxidizers
or secondary nitrifiers (Bock et. al., 1986). The reactions are generally coupled and
proceed rapidly to the nitrate form; therefore, NO2- levels at any given time are usually
low. These bacteria only perform their work strictly in the presence of free dissolved
oxygen (DO). Nitrification occurs only under aerobic conditions at DO levels of 1.0 mg/l
or higher (The water planet company, 2013).
Denitrification is the biological reduction of oxidized nitrogen compounds like nitrate or
nitrite to gaseous nitrogen compounds and it can be assimilatory and/or dissimilatory
(Cortez et. al., 2010). Assimilatory denitrification involves the reduction of nitrate or
nitrite to NH4‐N for use in biomass synthesis when NH4‐N is not otherwise available.
Most references to biological denitrification for nitrogen removal refer to dissimilatory
denitrification in which nitrate/nitrite is the ultimate electron acceptor in the bacteria cell
respiratory electron transport chain for the oxidation of various organic and inorganic
substrates (US EPA, 2010).
The reactions are carried out by denitrifiers, using N2O as an intermediate of
denitrification which can be release in high quantities, when low-oxygen environments
with sufficient NO3- and metabolizable organic carbon are present conditions. These
predominantly heterotrophic microorganisms are facultative anaerobes that are able to
use NO3- in place of oxygen as an electron acceptor in respiration to handle with
low-oxygen or anaerobic conditions (Wrage et. al., 2001).
The denitrification process involves the transfer of electrons from electron donor (i.e.,
carbon substrate as acetate) to the electron acceptor (i.e., oxygen, NO2- or NO3-); and
the main factors affecting denitrification processes are identified as: the nature and
amount of organic matter, nitrate concentration, aeration status (presence of dissolved
oxygen), pH and temperature (Lin et. al., 2009).
3.2.Nitrogen in wastewater treatment
As seen before, in section 1.1, nitrogen is an essential element but in excess poses
severe threats to human health and to the ecological functioning, pointing out its
principal contribution to eutrophication (Howarth, 2004). The negative impacts of
eutrophication, as algae and phytoplankton growth which lead to harmful algal blooms,
9
Eutrophication may also cause risks to human health, as from consumption of shellfish
contaminated with algal toxins or direct exposure to waterborne toxins. Particularly, it
can create problems in drinking water sources. As well excess levels of nitrates, above
the maximum contaminant level, in drinking water can cause numerous negative health effects due to the body’s conversion of nitrate to nitrite (US EPA, 2010).
Due to these reasons is important to limit nitrogen contamination. One way to minimize
this impact is to reduce nitrogen levels in WWTP effluent. Thus, the elimination of
nitrogen compounds is a fundamental aspect of wastewater treatment.
To eliminate nitrogen compounds, are applied BNR processes which are designed to
oxidize NH3-N to NO3-N and/or NO2-N, and reduce these compounds to N2 by
biological denitrification (WERF, 2008). Hence, nitrogen removal occurs in two
sequential processes: nitrification and denitrification (US EPA, 2009).
A wastewater treatment contains one or more of the following processes: preliminary,
primary, secondary, and tertiary treatment. The removal of grit, which removes dense
inert particles and screening to remove tattered clothing and other large debris, is the
preliminary treatment. Primary treatment entails gravity settling tanks to remove
settleable solids, including settleable organic solids. Secondary treatment follows
primary treatment in most WWTP and employs biological processes to remove colloidal
and soluble organic matter (US EPA, 2009).
BNR can be accomplished by a variety of treatment configurations using suspended
growth, attached growth, or combined systems (US EPA, 2009).
Currently, activated sludge is the most widely used treatment in BNR. Activated sludge
consists of biological flocs that are matrices of microorganisms, nonliving organic
matter, and inorganic materials (Wang et. al., 2009). It is a biological process that
utilizes microorganisms to convert organic and certain inorganic matter from
wastewater into cell mass, oxidizing the organic substances in the presence of oxygen
for bio-oxidation and nitrification reactions, or in the absence of oxygen for
denitrification reaction (Marx et. al., 2010).
A conventional activated sludge treatment for nitrogen removal includes several
phases with different oxygen concentrations, first there is an aerobic reactor (where
nitrification occurs) followed by a anoxic reactor (where denitrification occurs), or may
employ only one reactor in which alternating aerobic and anoxic phases are achieved
In conventional WWTP nitrogen removal is mostly achieved with pre-denitrification
(Vocks et. al., 2005). BNR can also be achieved by post-denitrification treatment such
as denitrification filters (US EPA, 2010). To attain the intended low TN concentrations,
in post-denitrification units and external carbon source is always added (Corona et. al.,
2013). Since without it the denitrification rate is expected to be low which demands an
increase reactor volume to obtain a complete N-removal (Vocks et. al., 2005).
To enhance nitrification and denitrification a suspended carrier technology is currently
used (Lin et. al., 2009). Among several other processes, the moving bed biofilm
process is becoming increasingly popular (Ødegaard et. al., 2000). It was developed
adopting the best from both activated sludge process and the biofilter processes
(Ødegaard, 1999). This process uses freely floating carriers that can be made of
different materials, shapes and sizes (Lin et. al., 2009). These carriers provide surface
area for bacteria attachment that grows into a biofilm (Chu and Wang, 2011). During
the moving bed biofilm reactor operation, the carriers are kept in constant circulation
(Weiss et. al., 2005). Contrary to most biofilm reactors the whole reactor volume is
active, as does the activated sludge reactor (Ødegaard, 1999).
Nitrification and denitrification processes in a WWTP can remove 80 to 95% of
inorganic N, but the removal of organic nitrogen is typically much less efficient. Organic
nitrogen may even be released in secondary treatment by microorganisms either
through metabolism or upon death and lysis (US EPA, 2009).
This research is going to focus in this aspect: the fate of DON concentration during the
process of denitrification.
3.3.DON
–
Definition and CharacterizationIn a general description DON is that subset of the dissolved organic matter (DOM) pool
that contains N. Comparing to dissolved organic carbon (DOC) research into DON has
lagged far behind of the larger pool of DOC. The lack of more developments in DON
research is consequence of the substantial analytical challenges inherent to it. DON
concentrations are substantially lower than DOC concentrations, multiple chemical
analyses are required for a single DON determination and inorganic N removal is a
nightmarish undertaking. To measure DON concentrations, it is first necessary to
11
fraction, composed of ammonium (NH4+), NO3- and NO2- and an organic fraction (DON),
the composition of which is largely unknown (Bronk, 2002).
Westerhoff and Mash (2002) mention that the exact structural composition of organic
nitrogen is still debatable, primarily due to analytical limitations and its incorporation
into a wide range of molecular weights. Nevertheless Berman and Bronk (2003) identify
the better-characterized constituents of the DON pool as urea, DFAA (dissolved free
amino acids), DCAA (dissolved combined amino acids) and proteins, nucleic acids,
amino sugars, and humic substances.
As said, much of the DON pool still remains uncharacterized chemically. Operationally,
components of the DON pool have been divided into high molecular weight (HMW,
usually >1 kDa) and low molecular weight (LMW) compounds. HMW DON includes
proteins (such as enzymes, modified bacterial wall proteins, DCAA, nucleic acids –
DNA and RNA) and humic like substances that have a relatively low N content. There
is the added complication that some LMW and HMW DON compounds may be loosely
held or adsorbed to humic substances (Berman and Bronk, 2003).
DON is considered, by Leenheer et. al. (2007), being primarily composed of degraded
amino sugars, peptides and porphyrins.
Numerous N-containing compounds have been detected in wastewater effluents,
including urea, aminoacids, LMW amines and chelating agents. In spite of this, the sum
of identified compounds commonly accounts for less than 10% of the total DON
present in wastewater effluents (Pehlivanoglu-Mantas and Sedlak, 2008).
3.4.Adverse effects
In many freshwater, marine, coastal, and estuarine environments a significant
proportion of the TN pool (excluding N2) is often associated with the DON fraction.
Indeed, in many natural waters, DON concentrations are much higher than those of the
total dissolved inorganic nitrogen (DIN) fraction, consisting of NH4+, NO3–and NO2– (Berman and Bronk, 2003).
The contribution of DON to the TN content of highly treated (as in nitrified and
denitrified processes) wastewater effluent is relatively high and significant for
watershed protection plans because mostly the plans for total maximum daily load
potential from inorganic nitrogen to cause eutrophication (Pehlivanoglu-Mantas and
Sedlak, 2004).
As seen in section 1.1 and 3.2, eutrophication is known to be caused by the availability
of excess nutrients, as N, in the water bodies such as lakes and rivers, which leads to
low DO conditions and impacts severely estuaries and coastal waterways worldwide
(Howarth and Marino, 2006).
Wastewater-derived DON has an important contribution to anthropogenic nitrogen
inputs in the water bodies; however there is a lack of information about the
bioavailability of wastewater-derived DON. The existing literature data about
wastewater-derived organic nitrogen consists mostly of research conducted in the
1970s (Pehlivanoglu-Mantas and Sedlak, 2006).
It is stated and accepted that DIN is bioavailable to most aquatic microbes (counting
also with bacteria and phytoplankton), though DON is related to a lower bioavailability,
in particular to phytoplankton (Filippino et. al., 2011). Nevertheless, recent research
has shown that a variety of DON compounds are directly bioavailable to natural
plankton communities (reviewed in Berman and Bronk 2003; Mulholland and Lomas
2008).
As reviewed in Pehlivanoglu-Mantas and Sedlak (2006), DON compositions most likely
to influence the variability in its bioavailability in natural waters. Where heterotrophic
bacteria and/or marine and freshwater algae have a direct uptake of free amino acids
urea and nucleic acids. Other forms of DON, such as humic substances, are less easily
used to support growth of algae in N-limited systems.
Different components of DON are considered indeed bioavailable to microorganisms
(including phytoplankton, cyanobacteria, and bacteria) living in estuaries, either directly
or after physical, chemical, and biologically-mediated reactions in the receiving waters
and during transport along an estuarine gradient (Mulholland et. al., 2007). Mulholland
et. al. (2007) also points out the possibility of organic material change with
photochemical reactions and readily convert recalcitrant (resistant to biological
transformations) compounds into reactive material. Biologically non-reactive DON
through photochemical reactions can release biologically available nitrogen and also
convert DON to inorganic nutrients such as nitrite and ammonium.
13
Sedlak (2004, 2006) demonstrated, although most DON is recalcitrant, approximately
10% of the wastewater-derived DON was available to algae in the absence of bacteria,
whereas the bioavailable fraction increased to 60% in the presence of bacteria.
Bacteria in the cycling of wastewater-derived organic nitrogen potentiate DON
bioavailability and with bacteria, approximately 25% of the DON is labile and becomes
available for algae growth. Also, with Pehlivanoglu-Mantas and Sedlak research, there
was the identification of potent carcinogenic nitrogenous disinfection by-products, such
as nitrosamines, nitromethanes and NDMA and their resistance to biodegradation in
receiving streams, and therefore of concern for downstream drinking water treatment
.
Pehlivanoglu-Mantas et. al. (2004) makes clear that although disinfection of water
offers protection against waterborne infectious diseases, it also increases the risk of
other diseases such as cancer due to the formation of disinfection by-products. The
presence of DON in wastewater effluent is of a high relevance for indirect potable
wastewater reuse. Whether this reuse is intentional or not wastewater-derived ON may
serve as disinfection by-products precursor during wastewater disinfection or possible
drinking water treatment with chlorine disinfection (Pehlivanoglu-Mantas, 2004; Lee et.
al., 2007; Krasner et. al., 2009). Besides disinfection by-products, Pehlivanoglu-Mantas
points out that various different organic compounds, including humic substances,
amino acids, and proteins, have been shown to form trihalomethanes (THMs) and
dihaloacetic acids (DHAAs) upon chlorination and therefore it is likely that chlorination
of organic compounds in wastewater effluent could result in the production of similar
by-products.
Moreover, the process efficiency of chlorination and decholorination can be affected by
wastewater-derived DON (Pehlivanoglu-Mantas et. al., 2004).
3.5.Measurement techniques
The study of DON has its challenge and difficulty in the determination of
concentrations. The lack of sensitive and precise techniques to quantify total DON
concentrations and several of the known DON constitutes makes it a slow and complex
process.
To measure total DON concentrations, presently, the majority of the methods depend
on the TDN concentration and on the subtraction of the DIN concentrations, previously
analytical errors of three analyses TDN, NH4+, NO3– and NO2–(Berman and Bronk, 2003). TN is composed of organic nitrogen, ammonia nitrogen, nitrite and nitrate. The
relationships are shown below:
Total Nitrogen = Organic Nitrogen + Ammonia Nitrogen + Nitrate + Nitrite
Total Kjeldahl Nitrogen = Organic Nitrogen + Ammonia Nitrogen
Total Nitrogen = TKN + Nitrate + Nitrite
Thus, the DON determination’s accuracy relies strongly on how accurate are the
methods used to determine each inorganic species and also is dependent on the
fraction of DIN in TDN. For DON determination there are three sequential steps, where
first the measurement of the inorganic nitrogen concentrations is made, after the TDN
concentration and finally there is the subtraction of both concentration values (Lee and
Westerhoff, 2005).
To measure TDN, not being possible to measure it directly, it is necessary a
preparatory digestion step, either chemical or by combustion (Vandenbruwane et. al.,
2007). Also, it is necessary a previous sample treatment, where a filtration usually
through 0.45μ membrane filters is made (Bratby et. al., 2008). There is the conversion
of DON and DIN to a single inorganic species (for example NO3-) and finally DON is the
concentration difference (Westerhoff and Mash, 2002):
DON = TDN – DIN
DON = TDN – [NO2-] – [NO3-] – [NH4+]
There are three general types of digestion methods; the wet chemical oxidation (as
persulfate oxidation), photolytic oxidation and high-temperature combustion
(Westerhoff and Mash, 2002; Lee and Westerhoff, 2005). See Table 3.1 for more
details.
Total Kjeldahl Nitrogen (TKN) is the oldest method used (Vandenbruwane et. al.,
2007), where there is the conversion of all DON in ammonia and its subtraction from
the TKN. However it has, generally, a low precision (method detection limit of 0.1-0.2
mgN/L) and the flaw of an incomplete oxidation of some nitrogenous compounds (Lee
and Westerhoff, 2005).
15
Table 3.1 – Methods for total dissolved nitrogen analysis. (Adapted from Westerhoff and Mash, 2002).
Method Description Species
measured Observations
Kjeldahl
nitrogen
Digestion (at 182–210°C) of sample in
H2SO4 in the presence of a catalyst
(usually Hg) and a salt (typically
K2SO4)
NH4+, HSO4
-Azide, azine, azo, hydrazone, nitro, nitroso, oxime,
and semicarbozone are unreactive functional
groups. DON is converted and measured by
titration, colorimetry or ion-selective electrode
(APHA, 2005); high ammonia concentrations
decrease the sensitivity and precision
(Pehlivanoglu and Sedlak, 2006)
Dumas
method
Combustion in CO2,reduction of NOx
followed by CO2 removal
Volumetric
quantity
of N2 produced
Dry, solid samples required
Alkaline
persulfate
oxidation
Autoclave digestion under alkaline
conditions in the
presence of S2O8
2-NO3
-Interference by organic carbon concentrations
greater than 150 mg/l and with analytical ranges
from 0.03 to 5.00 mg-N/L (Patton and Kryskalla,
2003)
Microwave digestion under
alkaline conditions in the
presence of S2O8
2-Proteins problematic; antipyrine
non-quantifiable
Boiling digestion under
alkaline conditions in the
presence of S2O8
2-EDTA and antipyrine not efficiently oxidized
UV digestion under alkaline
conditions in the presence of S2O82- Hetercyclic compounds show low recovery
Pyrolysis
oxidation High temperature oxidation at1100 C
NO, NO2- and
N2
Pyrazole and azoxy compounds recovery poor;
poor recovery of azo, nitro and nitroso
compounds
High
temperature
catalytic
oxidation
High temperature oxidation at 680 C
in the presence of acatalysis NO, NO2
- and
N2
Does not oxidize always certain recalcitrant forms
of organic nitrogen. Low values when compared to
the persulfate digestion method, possible
consequence of recalcitrant compounds as urea
(Pehlivanoglu and Sedlak, 2006)
Photooxidative
degradation
UV-oxidation, typically assisted by the
presence of an oxidizing agent (S2O82-
or H2O2)
NO3
-Bigger disadvantage is inconsistency (Bronk et.
al., 2000). Bronk et. al. (2000) verifies it with the
UV method performed on different UV machines
and within the same machine with different UV
lamps.
UV-oxidation in the presence of TiO2
or TiO2/Pt catalyst
NO2-, NO3- and
3.6.Removal techniques
While advanced treatments of wastewaters have not historically considered DON
removal as a major goal, as previously seen, it has been gaining an increased
importance (Chen et. al., 2010).
Now, WWTP that are planning to achieve very low nutrients levels need do consider
methods for the removal of effluent fractions hitherto not taken into account (Arnaldos
and Pagilla, 2010).
Due to the small percentage of compounds that are known to compose DON (less than
10%) and the rest being vary heterogeneous, there is the need to investigate tertiary
technologies that will target DON specifically (Urgun-Demirtas et. al., 2008).
Previous studies have evaluated the removal of DON in the effluent and the
effectiveness of these processes. In the study of Randtke and Mccarty (1977)
physical-chemical processes were tested for DON removal in the Palo Alto, California effluent.
The Palo Alto facility effluent had a DON concentration, in bench scale tests, of 1.3
mg/l (WERF, 2008). It was used chemical treatment for DON removal and typically,
chemical precipitation is obtained through the use of lime or a metal salt such as
aluminum sulfate or ferric chloride (US EPA, 2009). There was a 33% of removal with
lime, 28% with 200-300 mg/l alum, and 40% with 200-300 mg/l ferric chloride. For
cation and anion exchange less than 13%. About 71% of the effluent DON was
removed with activated carbon adsorption (WERF, 2008).
Nevertheless, Pehlivanoglu-Mantas and Sedlak (2008) showed through solid-phase
extraction that the unidentified DON was relatively hydrophilic and due to this
characteristic, DON is notlikely to be removed by adsorption onto activated carbon.
Activated carbon is most effective at removing less polar material. Molecules of higher
polarity tend to be less absorbable, bind water more tightly, and are more soluble
(Bratby et. al., 2008). On the contrary, aluminum coagulation has been proved to
remove nitrogenous organic compounds present in molasses wastewaters (Dwyer et.
al., 2009) and surface waters (Lee and Westerhoff, 2006).
For aluminum coagulation and lime softening Chen et. al. (2011) obtained until 25% of
DON and DOC removal. Especially due to the low specific ultraviolet absorption values
(<2 L/mg-m), there is a poor DON adsorption onto aluminum floc (coagulation) or
17
In Arnaldos and Pagilla (2010) study, for aluminum coagulation using a dose
correspondent to 3.2 mg Al (III)/L, was achieved a maximum DON removal of 69%.
This percent removal represents the fraction of effluent DON amenable to removal by
enhanced coagulation and microfiltration.
Also, in Lee and Westerhoff (2006) study the removal of DON in drinking water, with
aluminum sulfate coagulation was of 5 to 40% depending on the dosage of aluminum
sulfate and cationic polymer.
Even though the majority of the DON has LMW, microfiltration or nanofiltration may not
be very useful in removing wastewater-derived DON due to the fouling problems often
encountered in these filtrations (Pehlivanoglu-Mantas and Sedlak 2008). Also, as
reviewed in Bratby et. al. (2008), Muller (2006) with an industrial case of study,
reported that for a WWTP with a flow of of gallons per day (0.13 m3/s), the capital
cost of a membrane plant (microfiltration or ultrafiltration followed by reverse osmosis)
for effluent DON removal would be up to about $ . Annual operating costs would
be approximately $ . If a granular activated carbon treatment system were to be
implemented, operating costs would increase to $ per year.
There are other possible methods for DON removal, as Chen et. al. (2011) refer DON
seems to be partially removed with in-situ biological treatment using soil systems or
rivers. There is the demonstration of Amy and Drewes (2007) with soil-aquifer
treatment achieve DON removals from 50 to 75%, with effluents from Mesa wastewater
reclamation plant (WRP) and Tucson WRP (Bratby et. al., 2008).
The removal of natural organic matter (NOM) was extensively studied through chemical coagulation or precipitation. Aquatic NOM has its major composition of ‘humic substances’ (Arnaldos and Pagilla, 2010). As 90% of the wastewater effluent DON may also be composed of humic substances (Pehlivanoglu-Mantas and Sedlak, 2008), the
removal of DON can be investigated to be the same coagulant addition as those used
in NOM removal (Arnaldos and Pagilla, 2010).
Nevertheless, the efficiency of enhanced coagulation depends largely on the water or
wastewater characteristics and constituents. The fractions of DON and NOM with a
HMW are generally easier to remove, thus the LMW fractions are generally more
difficult to remove, tending to be more recalcitrant. The effluent wastewater-derived
DON has a LMW in general, being so difficult to remove to a great extent by
its removal difficult (Brabty et. al., 2008). Likewise, in Bratby et. al. (2008) study there is
the reference of DON removal to about 31%, through enhanced coagulation, the initial
19
4.
Materials and Methods
This chapter describes the set-up used for the batch experiments, the analytical
methods and the used materials.
4.1.Experimental SET-UP
The experimental part consisted of two types of denitrification batch tests: with
suspended biomass and attached biomass. Both types of batch tests were carried out
in a 20 L reactor, where anoxic conditions were provided with introduction of N2 gas in
the system, when necessary. A dissolved oxygen (DO) probe was connected in
recirculation with the reactor to control the absence of oxygen. The activated sludge (in
the case of suspended biomass tests) or the biological carriers and treated effluent (in
the case of attached biomass tests) were mixed at a constant speed, through a static
mixer.
The Harnaschpolder (HNP) WWTP is one of the largest WWTP in Europe, designed for
inhabitant equivalents. It is located in the border of Rijswijk and Delft and
treats in average 255 000 m3 of waste water per day. The treatment process starts with
a bulky waste removal, followed by a pre‑sedimentation tank, an active sludge tank
(biological treatment), a post‑sedimentation tank and sludge treatment. For the
denitrification tests the activated sludge and treated effluent were collected from HNP
WWTP.
4.2.Batch tests with activated sludge
For the batch tests with suspended biomass, activated sludge from the HNP WWTP
was used.
Batch test preparation
1. The collection of the activated sludge was made at the HNP WWTP in the previous
day of the test and transported to the laboratory.
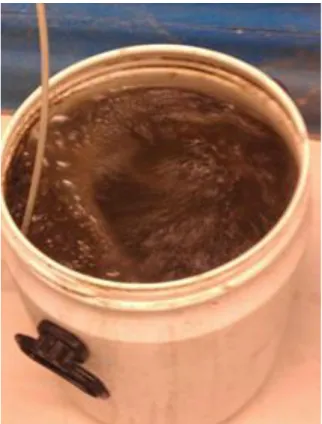
2. The sludge was aerated for at least one hour, in order to deplete all biodegradable
Figure 4.1 – Activated sludge aeration
Batch test
1. The activated sludge was introduced in the reactor and N2 gas is provided in case
21
2. A constant speed of 43 rpm was set, through a static mixer.
3. When DO concentration of 0 mg/l was achieved, NO3 concentration was measured.
4. In the case that NO3 would not be 0 mg/l, Sodium Acetate Trihydrate (C2H9NaO5)
solution (SAT) was added to the reactor in order to denitrify all NO3 existent in the
activated sludge. The amount of added SAT was calculated in order to provide a
COD concentration according to the following equation:
COD = 2.86xNO3 + 1.71xNO2 + DO
5. When a NO3 concentration of 0 mg/l was achieved, samples were taken for DON
determination.
6. SAT was added to the reactor in order to provide COD enough to denitrify the initial
NO3 concentration of 10 mg/l.
7. After 10 minutes of SAT addition (to guarantee homogenization) a sample was
collected for new measurement of COD and DON determination.
8. Sodium nitrate (NaNO3) solution was added to the reactor to achieve an initial
concentration of 10 mg/l NO3.
9. After 10 minutes (to guarantee homogenization of SAT), a sampling collection with
a frequency of 4 min started.
10.Each sample consisted of:
10.1.One 50 ml flask, which was left in the fridge at 2ºC, for later measurement of
biomass.
10.2.Three 100 ml flasks which were kept in dry ice for 3.5 minutes, for a fast cool down, and afterwards into a fridge at 2ºC.
11.The pH and temperature were measured along the test through a portable meter.
12.Extra samples were collected during the test once in a while and immediately
measured for NO3 to make sure when the denitrification was finished.
Samples treatment
1. Samples that were conserved in the fridge were centrifuged (Sorvall ST16R,
Sysmex, The Netherlands) by order of collection for seven minutes at 1200 rpm.
2. After centrifugation, the samples were decanted and frozen for later measurement
of NO3-; NH4+ and NO2.
3. Before measurement the samples were melted at room temperature and filtered by
membrane filtration through 1.2 μm pore size followed by 0.45μm.
4. Part of the filtrate was immediately measured for NO3-; NH4+ and NO2, and part was
5. Part of the acidified sample was conserved in the fridge for DOC measurement and
part was frozen for later DON determination.
4.3.Batch tests with kaldnes carriers
The batch tests with attached biomass were performed with secondary effluent from
the HNP WWTP and with kaldnes biological carriers, for attached growth.
Before initiating the batch tests with attached biomass, the kaldnes carriers were fed
with synthetic wastewater for 90 days, in order to create a biofilm that could perform
denitrification.
Feeding of biological carriers for biofilm growth
Synthetic wastewater was prepared by adding organic carbon, nitrate, phosphorus,
micronutrients and a buffer solution (for pH regulation) to tap water. Table 4.1 and 4.2
present the composition of synthetic wastewater and buffer solution, respectively.
Table 4.1 – Composition of the Synthetic Wastewater
Synthetic Wastewater (10L)
C2H9NaO5 34.16g
NaNO3 2.91g
K2HPO4 0.173g
Trace solution 150.6ml
Intermediary solution 0.1ml
Table 4.2–Composition of Buffer Solution
Ingredient Concentration [g/l]
Na2HPO4 3.46
NaH2PO4.2H2O 1.93
The kaldnes were fed everyday with synthetic wastewater for a period of 90 days
before the first kaldnes test. For further information about the preparation of the
23
Batch test preparation
To evaluate the influence of mixing velocity in DON concentration, the batch tests with
attached biomass were carried out at two different mixing velocities: velocity 1 with 43
rpm, and velocity 2 with 108 rpm. Velocity 2 was selected to be 2.5 times higher than
velocity 1. A higher velocity difference was not possible due to static mixer restrictions.
1. The collection of the secondary effluent was made at the HNP WWTP in the same
day of the test and transported to the laboratory.
2. The effluent was mixed to ensure its homogeneity and measured for NO3-, NO2 and
NH4+.
3. Three samples were collected for DON determination.
4. The first sample was immediately frozen, the second was filtrated by 1.2 μm pore
size and frozen and the third sample was filtrated through 1.2 µm, followed by
0.45 µm pore size and frozen.
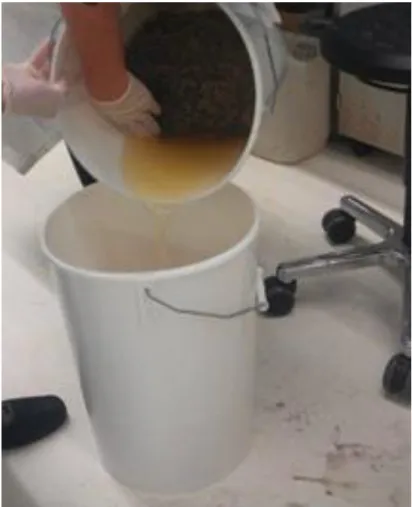
5. The kaldnes carriers were separated from the feeding solution through the use of a
metallic sieve, Figure 4.3.
Kaldnes washing
1. The kaldnes was transferred to a bucket where 10 L of demineralized water were
afterwards discharged for washing of the kaldnes.
2. The kaldnes and demineralized water were mixed at velocity 1 through a static
mixer and a bucket bottom discharge was opened in order to continuously flush the
washing water out of the system. The aim of washing the kaldnes was to assure the
elimination of feeding solution remaining.
3. The washing is repeated for 9 times.
4. At the 9th washing a sample of 100 ml was collected, filtered by 0.45 µm pore size
for measurement of TN in triplicate. This step was made to make sure that all
accumulated TN of the feeding solution was eliminated.
Solids measurment
1. 200 kaldnes units were collected before starting each test with low rpm for
measurement of total suspended solids (TSS) and total volatile solids (VSS). The
kaldnes units were stored in flasks containing demineralized water and kept in the
fridge until further sonication.
Batch test
1. The batch test reactor was filled with 8 L of kaldnes and a metallic net was used
inside the reactor in order to keep all kaldnes submerged during the test.
Otherwise, the water level decreases in the reactor, due to sampling, would lead to
accumulation of kaldnes on the top of the reactor.
2. A constant speed of 43 rpm or 108 rpm was set, through a static mixer.
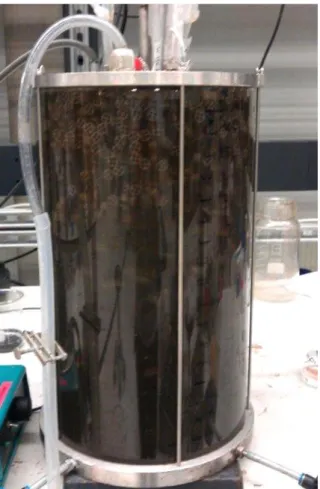
3. The secondary effluent was introduced in the reactor and N2 gas was provided in
case that DO was not 0 mg/l, Figure 4.4.
4. When DO concentration of 0 mg/l was achieved, NO3 concentration was measured.
5. In the case that NO3 is not 0 mg/l, SAT is added to the reactor in order to denitrify
all NO3 existent in the activated sludge. The amount of added SAT was calculated
in order to provide a COD concentration according to the following equation:
COD = 2.86 x NO3 + 1.71 x NO2 + DO
6. When a NO3 concentration of 0 mg/l was achieved, samples were taken to
measured COD and DON determination.
7. SAT is added to the reactor in order to provide COD enough to denitrify the initial
25
8. After 10 minutes of SAT addition (to guarantee homogenization), a sample was
collected for new measurement of COD and DON determination.
9. NaNO3 solution was added to the reactor to achieve an initial concentration of 10
mg/l NO3.
10.A sampling collection with a frequency of 4 minutes starts immediately.
Figure 4.4 – Denitrification batch test with kaldnes carriers
11.Each sample consisted of:
11.1. One 180 ml flask, which was kept in dry ice for 3.5 minutes, for a fast cool
down, and afterwards into a fridge at 2ºC.
12.The pH and temperature were measured at the beginning and end of the test
through a portable meter.
13. Extra samples were collected during the test once in a while and immediately
measured for NO3- to make sure when the denitrification test was finished.
Samples treatment
1. Samples that were conserved in the fridge were filtrated by order of collection by
2. Samples were melted at room temperature; part of the sample was immediately
measured for NO3-, NO2 and NH4+ and part was acidified to pH 2 with hydrochloric
acid.
3. Part of the acidified sample was conserved in the fridge for DOC measurement and
part was frozen for later DON determination.
4.4.Preparation of solutions
NaNO3 [30.35g/l]
Sodium nitrate is dried in the oven at 105ºC for 24h.
15.175g of dried NaNO3 are dissolved in 500ml of demineralized water.
The dissolved solution is transferred to a volumetric flask and demineralized water is
added in order to obtain a final solution of 500ml.
SAT [100g/l]
25g of sodium acetate trihydrate are dissolved in a beaker with demineralized water.
The dissolved solution is transferred to a volumetric flask and demineralized water is
added in order to obtain a final solution of 250ml.
4.5.Analytical measurements
For the determination of the denitrification curves, NO3-, NO2 and NH4+ were measured
through MERCK cuvette tests (Darmstadt, Germany). The MERCK tests are based on
colorimetric tests according to standard methods (APHA, 2005).
For purposes of DON determination, NO2 and NH4+ were measured by Hach Lange
cuvette tests (Dusseldorf, Germany) and NO3- absence was checked through ion
chromatographic method with the use of DIONEX ICS - 1000 Ion Chromatography
System, with an AS-DV auto sampler unit.
DON concentration was determined by subtracting the inorganic nitrogen (NO3-, NO2
and NH4+) to TDN (TN measured after filtration through 0.45 µm pore size). TN was
measured through persulfate digestion according to standard methods (APHA, 2005)
COD concentration was measured using Merck kits (Darmstadt, Germany) and DOC
was measured using water extraction total organic carbon measurement method with
27
The TSS and VSS concentration for the activated sludge was performed as described
in the standard methods (APHA, 2005).
The assessment of the TSS and VSS concentration on the kaldnes biological carriers
was performed as follows: the attached biomass was removed from the 200 biological
carriers by putting them in a flask with demineralized water that was placed in an
ultrasonic bath (Branson 5510) for six hours. After the biological carriers were rinsed
with demineralized water, a sample of the water containing the biomass of the kaldnes
was collected. This sample was used to measure TSS and VSS according to standard
methods (APHA,2005).
TSS and VSS were calculated according to standard methods and considering the
specific surface area of the type of kaldnes carriers used, and the number of kaldnes
29
5.
Results and discussion
This chapter contains the results of the batch experiments performed for suspended
and attached biomass. These results are discussed and compared with literature.
This chapter is divided in two types of batch tests: with activated sludge (section 5.1)
and kaldnes carriers (section 5.2).
The section 5.2 is divided in results obtained with low and high mixing velocity.
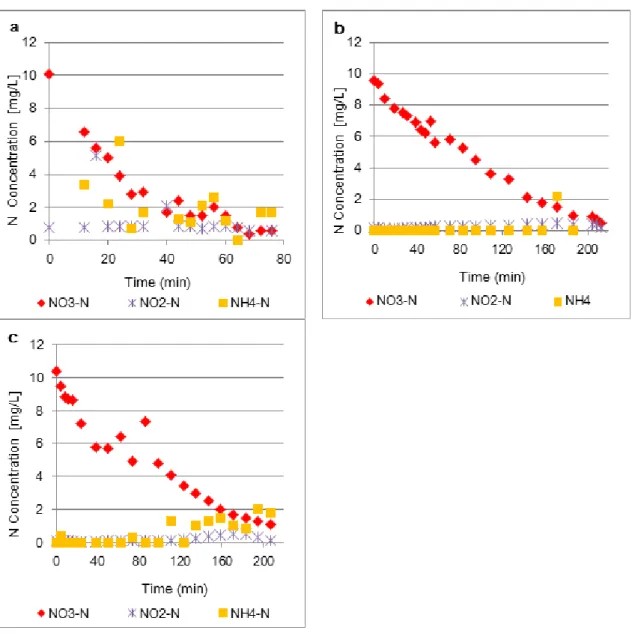
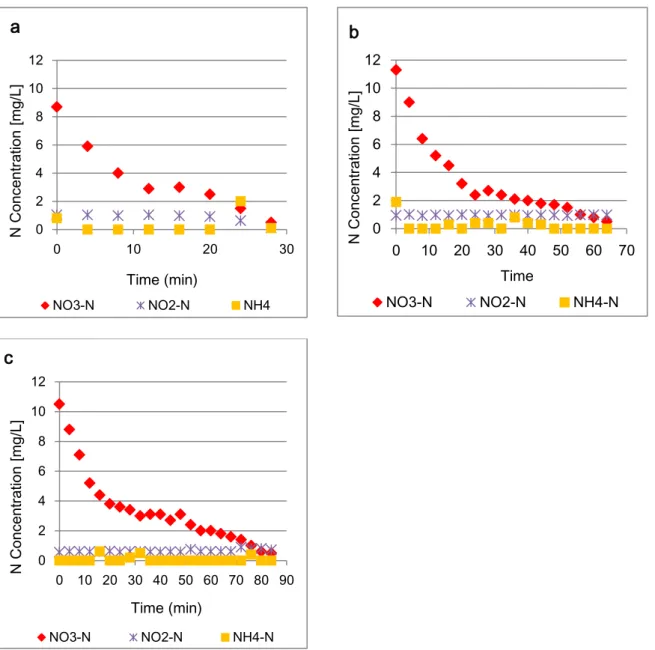
5.1.Batch tests with activated sludge
The concentrations of NO3-, NO2 and NH4+during the three tests of activated sludge are
shown in Figure 5.1.
The concentrations of NO2 remained most of the time close to 0 mg/l which agrees with
the general consideration that the reduction rate of nitrite is higher than nitrate
reduction rate and high enough so nitrite accumulation will not occur during the
denitrification process (Wilderer et. al., 1987). Concentrations of NH4+ were mainly
close to zero as well, which was expected since the activated sludge was aerated
before the tests, resulting in nitrification of the remaining NH4+.
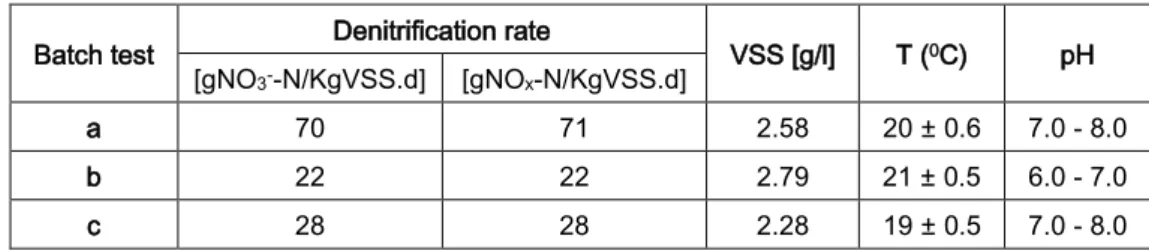
Table 5.1 shows the calculated NOx–N specific denitrification rates (SDNR), obtained
for the three activated sludge tests.
Table 5.1 – SDNR for activated sludge tests
Batch test Denitrification rate VSS [g/l] T (0C) pH
[gNO3--N/KgVSS.d] [gNOx-N/KgVSS.d]
a 70 71 2.58 20 ± 0.6 7.0 - 8.0
b 22 22 2.79 21 ± 0.5 6.0 - 7.0
c 28 28 2.28 19 ± 0.5 7.0 - 8.0
The denitrification efficiency from each batch test was assessed by the specific
denitrification rate. For the first activated sludge test (test a), the calculated SDNR was
70 gNO3--N/(KgMLVSS.d), which is in the range of 40 to 420 gNO3--N/(KgMLVSS.d)
observed for pre-anoxic tanks in full scale installations (Metcalf and Eddy, 2004) or
close to the range of 72 to720 gNO3--N/(KgMLVSS.d), observed for anoxic batch tests
(Ekama et. al., 1986).
For the last two tests of activated sludge (b and c), the SDNR are 22 and 28 gNO3-
-N/(KgMLVSS.d). Assuming that VSS/TSS is usually 70%, such SDNR correspondent
to 11 to 42 g N/(KgMLVSS.d), observed by Gerberet. al. (1986) in denitrification batch
tests under anoxic conditions, which cover the values obtained for tests b and c of
activated sludge.
Acetate or methanol addition are indicated in the literature by Henze et. al. (1994) and
Dold et. al. (2008) as producing the maximum SDNRs in BNR processes. Regarding
the use of acetate, Cherchi et. al. (2009) observed variable SDNR which were
attributed to different sludge sources and environmental factors that affect biological
processes (as pH and temperature). The temperature and pH observed for the three tests with activated sludge were in the range of 19 to 21ºC and 6 to 8, respectively. The big difference between the first test and the last two might be related to the specificities
31
The graphs of NOx concentrations during denitrification for the activated sludge tests a,
b and c, are presented on appendix I (Figure I.I).
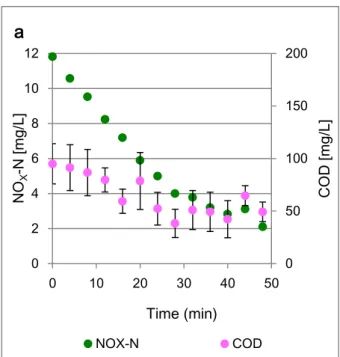
Denitrification is mainly accomplished by heterotrophic bacteria and is strongly
dependent on the availability of organic carbon, which serves as an energy source and
electron donor of the denitrification process (Lin et. al., 2009). Organic carbon can be
expressed as the chemical oxygen demand (COD) to N ratio, also named as COD/N
(Peng et. al., 2007), which is the carbon-use-to-nitrate-consumption ratio (Cherchi et.
al., 2009). As common procedure, denitrification tests are evaluated in terms of C/N
ratio, which indicates the amount of carbon used (acetate in the current case) for the
removal of nitrate (Dold et. al., 2008).
COD and DOC concentration are expected to decrease along with the decrease of NO3
or NOx. However, the resultant concentrations did not show a clear decrease for any of
the three tests (graphs are shown in appendix I.II and I.III). Instead, small variations
occurred within a constant interval which could be the result of a measurement error.
For this reason, the COD oxidized through these batch tests could not be accounted to
quantify the ratio of COD:NO3- of the activated sludge tests.
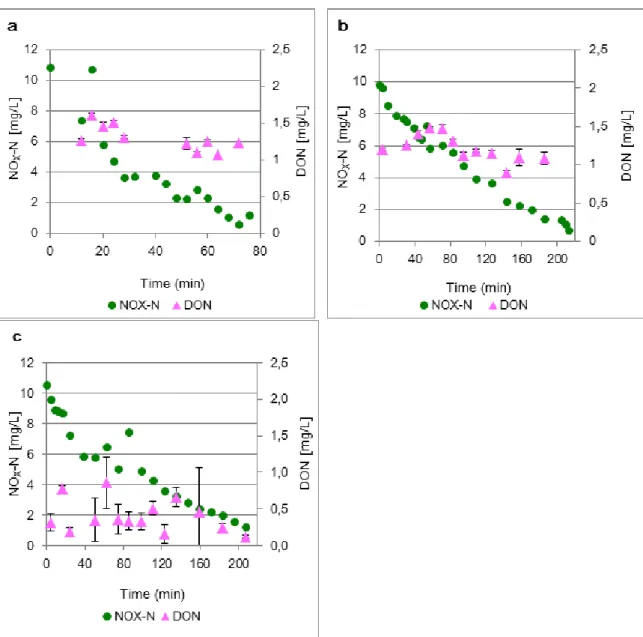
Figure 5.2 presents the results for the concentrations of DON and NOx-N in the three
tests. The vertical bars in the graphs present the standard deviation obtained from
three DON results, calculated from the subtraction of a single measurement of
Figure 5.2 – Comparison between the NOx concentrations and DON concentrations in the activated sludge
tests a, b and c.
As observed in Figure 5.2, the concentrations of DON vary within 0.1 to 1.6 mg/l.
Looking at the tests a, b and c it is observed that DON tends to be constant with
denitrification.
DON concentrations observed during the batch tests very between 0.1 to 1.6 mg/l. The
measured DON values are comparable with the values obtained by Makinia et. al.
(2011). The author measured organic nitrogen in an activated sludge batch test before
and after four hours of anoxic conditions (initial and final values) and Makina et. al.
(2011) observed a decrease of DON (called as CON by the author) from 5 to 2 mg/l.
However, in this study several measurments are done during the denitrification of 10
33
Several other authors have made previous DON determinations. DON concentration
ranges of 0.7 to 1.8 mg/l (Liu et. al. 2012) and 0.7 to 2.1 mg/l (Pehlivanoglu-Mantas
and Sedlak, 2008) in treated wastewater; of 1.0 to 2.5 mg/l for trickling filter effluent
(Evans et. al., 2004; Murthy et. al., 2006; Pagilla et. al., 2006) and 1 to 2 mg/l for
activated sludge plants (Pagilla et. al. 2011).
Comparing the DON levels between tests, the last test shows much smaller
concentrations with a maximum of 0.86 mg/l. This difference could be attributed to a
different type of sludge, which contained originally a very low concentration of DON.
5.2.Batch tests with kaldnes carriers
The results of the batch tests with attached biomass are shown for the two studied
velocities: velocity 1 and 2.
The objective of different mixing velocities was to induce different shear stress
conditions in the biomass. The increase of shear stress may lead to an increase of
biological stress which can result in the production of EPS, and consequently, to the