INTER-RELATION BETWEEN SOYBEAN YIELD
AND SOIL COMPACTION UNDER DEGRADED
PASTURE IN BRAZILIAN SAVANNAH
(1)Rienni de Paula Queiroz(2), Edson Lazarini(3), Marcio Lustosa Santos(4), Morel de Passos e Carvalho(5) & Cristiano Santos(6)
SUMMARY
The Cerrado (Brazilian Savannah) plays an important economic and financial role in the nation, since the pastures of this biome feed cattle for half of the domestic bovine meat productivity, and its agricultural fields produce a third of the country’s grain. The variability and spatial dependence between the soil physical attributes and soybean yield were evaluated in a crop rotation planted on a degraded brachiaria pasture, on a dystroferric Red Latosol of an experimental farm of the State University of São Paulo (UNESP), in the 2005/2006 growing season. The linear and spatial correlations between these attributes were also studied, to determine conditions that would allow increased agricultural productivity. In the above pasture area, a grid was installed with 124 plots, spaced 10.0 x 10.0 m and 5.0 x 5.0 m apart, in a total area of 7,500 m2. From the linear and spatial point of
view, the high grain yield can be explained by the number of grains per plant and soil macroporosity. The high variability observed for most soil properties indicated that the crop - livestock integration system results in environmental heterogeneity of the soil.
Index terms: soil conservation, crop rotation, pasture management, Glycine max
(L.) Merrill, spatial variability.
(1) Trabalho extraído da Tese de Doutorado. Received for publication in August 18, 2010 and approved in March 17, 2011. (2) Professora do Ensino Básico, Técnico e Tecnológico. Coordenação de Agropecuária. Instituto Federal de Educação, Ciência e
Tecnologia de Mato Grosso do Sul, Campus de Nova Andradina, Rodovia MS 473, km 23 Fazenda Santa Bárbara, Caixa Postal 144, CEP 79750-000 Nova Andradina (MS). E-mail: rienni.queiroz@ifms.edu.br
(3) Professor Universitário, Departamento de Fitotecnia, Tecnologia de Alimentos e Socioeconomia, Faculdade de Engenharia,
Universidade Estadual Paulista, Campus de Ilha Solteira, Avenida Brasil, 56, Cx. Postal 31, 15385-000, Centro, Ilha Solteira, São Paulo, Brasil. e-mail: lazarini@agr.feis.unesp.br
(4) Professor do Ensino Básico, Técnico e Tecnológico. Direção de Ensino e Pós-Graduação. Instituto Federal de Educação,
Ciência e Tecnologia de Mato Grosso do Sul. E-mail: marcio.santos@ifms.edu.br
(5) Professor Universitário, Departamento de Fitossanidade, Engenharia Rural e Solos, Faculdade de Engenharia, Universidade
Estadual Paulista – USP. Campus de Ilha Solteira, Av. Brasil 56, Caixa Postal 31, CEP 15385-000 Ilha Solteira (SP). E-mail: mpcarva53@yahoo.com.br
(6) Acadêmico do curso de Agronomia da Universidade do Estado de Mato Grosso, Campus de Tangará da Serra MT, e-mail:
RESUMO: INTER-RELAÇÃO ENTRE A PRODUTIVIDADE DA SOJA E A COMPACTAÇÃO DO SOLO SOB PASTAGEM DEGRADADA DO CERRADO BRASILEIRO
As pastagens cultivadas do Cerrado brasileiro são responsáveis pela metade da produtividade da carne bovina destinada à alimentação da população, enquanto as culturas agrícolas o são pela terça parte de sua produtividade de grãos, desempenhando importante papel econômico-financeiro para o país. Dessa forma, no ano agrícola 2005/2006, na Fazenda de Ensino e Pesquisa da Faculdade de Engenharia de Ilha Solteira – FEIS/UNESP, foram estudadas a variabilidade e a dependência espacial entre atributos físicos do solo e a produtividade da soja, quando rotacionados após a pastagem degradada com Brachiaria, sobre um Latossolo Vermelho distroférrico. Também foram estudadas correlações lineares e espaciais entre esses atributos, apurando condições que proporcionassem aumento da produtividade agrícola. Para isso, na área com a referida pastagem instalou-se uma malha contendo 124 pontos amostrais, com espaçamentos de 10,0 x 10,0 e de 5,0 x 5,0 m entre eles, numa área total de 7.500 m2. Dos pontos de vista linear e espacial, a elevada produtividade de
grãos de soja pode ser explicada em razão do número de grãos por planta e da macroporosidade do solo. A alta variabilidade obtida na maioria dos atributos do solo denotou que a integração lavoura-pecuária é um sistema que proporciona heterogeneidade do ambiente físico do solo.
Termos de indexação: conservação do solo, rotação de culturas, manejo da pastagem, Glycine max (L.) Merrill, variabilidade especial.
INTRODUCTION
Crop-livestock integration is a good option to improve and diversify agricultural production, to increase the profits of both agriculture and animal husbandry and complement mineral fertilization in the system, by the use of animal manure as well as crop residues (Pitol, 1996). In this system, pasture quality is improved by applying soybean residues, while at the same time pasture desiccation results in straw formation with a high C:N ratio, which is essential for soybean under no-tillage (Broch et al.,1997).
According to Machado & Weismann (2007), the Crop - Livestock Integration system can be used with a view to the recovery of pastures and of the physical properties of soils in agricultural areas. A widely used practice in integrated systems is forage intercropping with annual crops.
In general, the physical properties of a soil in natural state, under native vegetation, are good, with adequate soil permeability, structure, density and porosity for a normal plant growth and development. Under these conditions, the soil volume explored by the roots is relatively great. When the soil is subjected to agricultural use, the physical properties are altered, generally deteriorating its quality for plant development (Andreola et al., 2000).
Studies of Baeumer & Bakermans (1973) and Douglas et al. (1980) demonstrated that the no-tillage system increased soil density and microporosity in the surface layers of the soil profile. The values of
total porosity and macroporosity were reduced, mostly by adoption of no tillage systems (Andreola et al., 2000). The differences, however, are usually more evident in the layers near the surface, decreasing with soil depth (Douglas et al., 1980). The soil physical properties related to crop yield can be divided into two categories: The first is related to properties directly involved with plant development, e.g., water, oxygen, root penetration resistance, and temperature, which affect several physiological processes, such as photosynthesis and leaf and root growth. The second category comprises indirectly involved properties, such as soil texture, aggregation, porosity and density, which affect crop yield by the influence on soil water retention, aeration, temperature, and root penetration resistance (Silva & Nogueira Junior, 2001).
It has been demonstrated that the type of agricultural exploration influences some soil physical properties (Albuquerque et al., 1995; Andreola et al., 2000). Crops under rotation and no-tillage system, including species with an aggressive root system and different quantities of phytomass, can modify the soil physical and chemical properties, leading to improvements in crop yield (Santos & Tomm, 1999; Albuquerque et al., 2001).
Few studies have investigated the relations between soil spatial variability and crop productivity. Some results are even contradictory, possibly because the aspects involved in this interaction require further research (Souza, 1992).
Crop-livestock integration, associated with the no-tillage system, changes the soil structure, interfering with the physical characteristics of the surface layer and affecting crop yields. The effects of this system on soybean and pasture yield are highly dependent of the local or seasonal conditions, with controversial results. In this situation, in a soil management system of precision agriculture, the limitations of crop productivity and environmental protection can be identified, characterized and managed adequately in time and space. The characterization of spatial variability of the soil physical and chemical properties, associated to other statistical methods of decision-taking, can contribute to an economic and ecologically sustainable agriculture.
This study was performed on a dystroferric Red Latosol under degraded pasture of the Brazilian Savannah, with the purpose of analyzing the variability and characterizing the spatial dependence of soybean yield on the soil physical properties, as well as to study the linear and spatial correlations among these properties, with a view to increase the agricultural productivity.
MATERIAL AND METHODS
The study was conducted in an irrigated area (central pivot), on an experimental farm of the Faculdade de Engenharia de Ilha Solteira (FEIS) of the Universidade Estadual Paulista /UNESP on the Campus Ilha Solteira, in Selvíria, state of Mato Grosso do Sul, (latitudes 20°18’05" S and 20°18’28" S, longitudes 52°39’02" W and 52°40’28" W, 335 of altitude). The average annual rainfall is 1300 mm, average temperature 23.7°C, climate type Aw (Koeppen), characterized as humid tropical, with rainy summers and dry winters. The soil, where the experimental grid was installed, classified by Demattê (1980) and reclassified according to the Brazilian Soil Classification System (Embrapa, 1999), is a typical dystroferric Red Latosol with argillaceous texture A
moderate hypo-dystrophic alic, kaolinitic ferric, very deep and moderately acid.
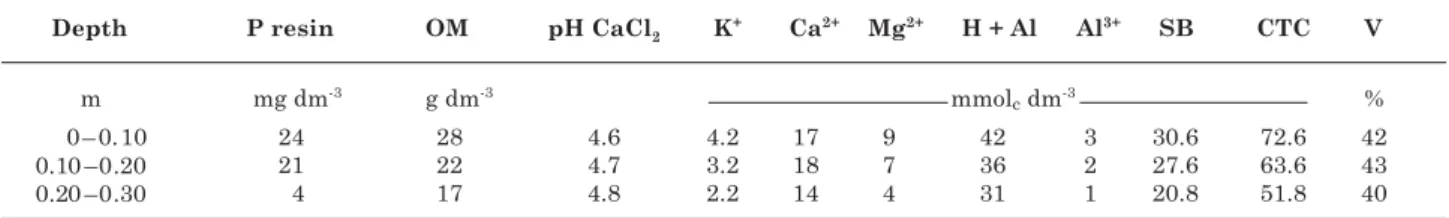
The experimental area had been used for at least 20 years as pasture of Brachiaria decumbens (Staft.). Therefore, aiming to characterize it initially, that is, before preparing the soil and installing the experimental grid, the soil compaction and fertility state were determined. Soil compaction was evaluated using a Tension Table and fertility with a screw auger, by which the composite samples were stratified in three layers (0–0.10; 0.10–0.20 and 0.20–0.30 m).
Regarding soil tillage, the soil was decompacted with a subsoiler and limed. Subsoiling was performed in April 2005 and liming in August 2005. Soybean, cultivar BRS 133 with semi-early cycle, was sown in November 2005, after brachiaria desiccation by the herbicide glyphosate, at a dosage of 1.8 kg ha-1 of active
ingredient. Cultural treatments were applied according to recommendations for the main cash crops of São Paulo State (Fahl et al., 1998), and the crop harvested around mid-March 2006. The spacing between rows was 0.45m, with a final density of 20 plants per meter. In addition, according to the same recommendations of Embrapa (2001) for soybean, the seeds were treated with Dorosal fungicide (1 mL kg-1
of seed) and inoculated with Bradyrhizobium japonicum, and 250 kg ha-1 of NPK (08-28-16) was
applied as fertilizer.
The directions x and y of the Cartesian coordinate system of a set of soybean crops established on two agricultural terraces were defined. For this purpose, a common optical level was used, performing a global staking of the experimental grid after acidity correction, fertilization and pasture desiccation.
The experimental grid was composed of five transections (length 110.0 m), spaced 10.0 m apart, containing 55 sampling points (10.0 x 10.0 m). However, the large grid was over-layered with smaller spaces (1.67 x 5.0 m; 5.0 x 5.0 m and 5.0 x 10.0 m), to detail the study of spatial dependence data in smaller spacing. Therefore, the total number of plots was 124, in a total area of 7500 m2.
Soil and plant properties were evaluated, all separately collected at each sampling point of the experimental grid. The soil properties were macroporosity (MA) and microporosity (MI) and the plants properties average plant height (PH), mean
insertion height of the first pod (FP), average number of pods per plant (NP), average number of grains per plant (NG), 1000 grain weight (GW), and grain yield (GY).
The soil properties were calculated from samples collected around the marks that indicate the sampling points in the field. These soil samples with undisturbed structure were taken for MA and MI analysis. Three soil layers were sampled, namely: a) 0–0.10, 0.10–0.20 and 0.20–0.30 m. The soil macroporosity and microporosity were obtained by the Tension Table Method (Embrapa, 1979, 1997).
The plant properties were also obtained and calculated from samples collected around the sampling points. The samples were originated from harvesting all plants; all plots consisted of four 1.60 m-rows. Since plot length and width were the same, the evaluated area of each plot was 2.56 m2. The average plant
height and insertion height of the first pod in the plant were evaluated. The average number of pods per plant and of grains per plant had no specific measure. The 1000 grain weight and the grain yield were obtained. For each evaluated property, an initial descriptive data analysis was applied by classical statistics, using SAS (Schlotzhauer & Littell, 1997) to calculate means, standard deviation, variance, variation coefficient, kurtosis and asymmetry. Then the frequency distribution of the properties was analyzed. For this purpose, to test the hypothesis of normality or lognormality of the data, the Shapiro & Wilk (1965) test was used at 1 %.
A correlation matrix was calculated for linear regressions for all possible combinations, by taking all evaluated properties in pairs (soil and plant), in an attempt to select the properties with highest linear correlation, trying to identify those for which cross-semivariograms and consequent co-kriging could be used. Also, for all evaluated soil layers together, multiple linear regression was performed for the dependent plant variations and independent soil variations, aiming to select those, in each case, with the best relations between cause and effect, based on the increase in the determination coefficient. For this purpose, Microsoft Excel and SAS were used.
Each evaluated property was analyzed by geostatistical methods, with semivariogram calculation based on hypothetical intrinsic stationarity assumptions to assess the spatial variability and dependence, using Gamma Design Software (GS+, 2004). A simple semivariogram was adjusted to all evaluated properties of the plants (GY, FP, PH, NP, NG, GW) and soils (MA1, MA2, MA3, MI1, MI2, MI3). Afterwards, cross-semivariograms were adjusted between the properties: a) plant x plant, b) plant x soil and c) soil x soil, aiming to define the pairs with better representativeness, to know which property, known as secondary variable, showed better explanatory spatial correlation to the property known as primary variable. The simple and cross-semivariograms were adjusted according to the models, by an initial selection of: a) the lowest sum of squared deviations (RSS); b) the highest spatial coefficient of determination (r2) and c) the best indicator of spatial dependence (ISD). The model that represented the best adjustment was chosen based on cross-validation, as well as the neighborhood size definition that provided the best kriging and/or co-kriging grid. To each property, the nugget (Co), range (Ro) and level (Co+C) (GS+, 2004) effect was related. According to Robertson (1998), spatial dependence was considered: a) weak for ISD ≤ 25 %; b) medium for 25 % < ISD ≤ 75 %, and c) strong for ISD > 75 %.
Cross-validation is a tool destined to evaluate alternative models of simple and cross semivariograms, for kriging and co-kriging, respectively. For this purpose, with the ideal number of neighbors, kriging and co-kriging maps were obtained by interpolation for the analysis of spatial dependence and interdependence among the evaluated properties.
RESULTS AND DISCUSSION
A descriptive analysis of the evaluated properties on a Dystroferric Red Latosol in Selvíria (MS) was performed, where the variation coefficient of soybean GY was particularly high (30.4 %) (Table 3) These data were higher than found by Johann et al., (2004) and Amado et al., (2007) with medium and high variability (23 and 24 %), respectively. On the other hand, the variability of the other plant properties wasw low for PH and GW (6.9 and 6.2 %), medium for FP and NP (11.6 and 19.1 %) and high for NG (20.8 %). The variability of MA was especially high, varying from 51.7 to 55.6 % in the different layers (MA1, MA2, MA3). These data agreed with results of Carvalho et al., (2002) and Souza et al., (2004), who studied a dystrophic and dystroferric Red Latosol, and found values of 39 % and 31 %, respectively. However, they differ from findings of Souza (2001), Mesquita et al. (2003) and Secco et al. (2005), who studied a dystrophic Red Latosol and Red-Yellow Latosol, and reported 16,
20 and 25 %, respectively (Table 3). For MI, variability was low, with a variation coefficient of 8.6-9.4 %, confirming results of Carvalho et al. (2002), Mesquita et al. (2003), Johann et al. (2004), Secco et al. (2005), and Santos et al. (2006).
Of the evaluated plant properties, the frequency distribution of all variables (PH, FP, NP, NG, and GW), except for GY, which was a lognormal type, was normal, i.e., the respective measures of main tendency will represent average values. The coefficients of positive asymmetry were between 0.056 and 0.251, as well as the negative between -0.245 and -0.125. The positive kurtosis coefficients were between 0.420 and 0.630, and the negative between -0.030 and -0.519. Of the soil properties, the frequency distribution of MI3 was normal and of the other soil variables (MA1, MA2, MA3, MI1, and MI2) uncertain. The positive asymmetry coefficients were between 0.032 and 0.525 and the negative between -0.091 and -0.333. The positive kurtosis coefficients were between 0.143 and 0.676 and the negative between -0.200 and -1.107. However, regardless of these coefficients, all were significant at 5 % probability by the normality test of Shapiro & Wilk (1965), once the respective probability varied between 0.066 and 0.609 (Table 3).
For this purpose, the normal frequency distribution, obtained for most properties of this study, was, classified according to the property by the following authors: a) GY (Santos et al., 2005; Marins, 2006; Carvalho et al., 2006; Freddi et al., 2006; Santos et al., 2006), b) MA (Mesquita et al., 2003; Souza et al., 2004) and c) MI (Carvalho et al., 2002, 2003, Mesquita et al., 2003, Souza et al., 2004).
The median of the GY was 3,097.00 kg ha-1
(Table 3), lower than reported by Secco et al., (2004), who found 3,373.0 kg ha-1. The soybean yield was
10 % above the national average, which was 2809 kg ha-1 in the 2006/2007 growing season
(Embrapa, 2006). On the other hand, the average values of the other plant properties were below the national average. The average values of MA (MA1 of 0.056 m3 m-3, MA2 of 0.054 m3 m-3 and MA3 of
0.061 m3 m-3) and MI (MI1 of 0.370 m3 m-3, MI2 of
0.372 m3 m-3 and MI3 of 0.384 m3 m-3) were very
similar in the three soil layers. (Table 3). It was concluded that the evaluated layers were compacted, representing a limiting factor to obtain maximum soybean yields, impaired by deficient root growth as well as by the consequent nutrient uptake deficiency. The reason was that the MA and MI values were beyond those considered ideal for a soil, from the agronomical point of view. The reference values proposed by Kiehl (1979) for macroporosity, whose function is soil aeration, would be 0.17 m3 m-3 and for
microporosity, responsible for water storage, 0.33 m3 m-3.
In the range of correlation properties of the plant (Table 4), the regression equation of GY= f(NP) was adjusted to the potential model, with a high determination coefficient (0.792**). The variability in GY can be explained by 7.92 % of the data variability of the NG. For [GY= f(FP) and GY= f(NG)], GY varied linearly with FP (r = -0.337**) as well as with NG (r = 0.812**). Regarding the soil properties (MA and MI), a significant linear correlation was verified between GY x MA1 (r = 0.295**), GY x MA3
Table 3. Initial descriptive analysis of some attributes of soybean yield and soil (dystroferric Red Latosol)
(1) GY: soybean grain yield; PH: plant height; FP: insertion height of the first pod ; NP: number of pods per plant; NG: number of
(r = 0.262**) and MI1 (r = -0.204). Direct correlations were found in the first and second pairs, indicating that with increasing soil macroporosity, soybean yields tend to increase. This fact was presented in a theoretically coherent form in table 3, based on the average value of MA1 of 0.056 m3 m-3 and MA3 of
0.061, near the critical limit of 0.100 m3 m-3 indicated
by Khiel (1979). This way, an increase in macroporosity in the evaluated soil layers may result in better aeration of the root system, leading to yield increase. On the other hand, for GY x MI the correlation was inverse, indicating that an increase
in MI (0.370 m3 m-3) will decrease the soybean GY,
probably because of the lower root respiration caused by soil compaction.
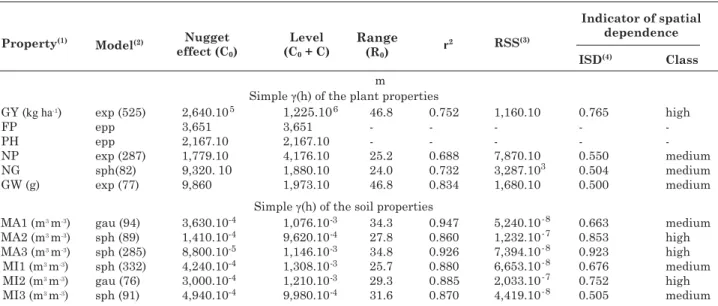
Regarding the parameters of the simple semivariograms adjusted to the soybean yield and some physical properties (Table 5), spatial dependence was confirmed for all properties except FP and PH, with a pure nugget effect. Therefore, regarding MA in the distinct layers (MA1 and MA3), the coefficients of spatial determination were the highest, considering the best semivariographic adjustments, in agreement with Beutler et al. (2006) and Souza et al. (2001). The
Table 4. Equations and regression coefficients for attributes of soybean yield and soil (dystroferric Red Latosol)
(1) GY: soybean grain yield; FP: insertion height of the first pod; NP: number of pods per plant; NG: number of grains per plant;
MA and MI, from 1 to 3, are respectively macroporosity, microporosity in the evaluated layers. (2) **: significant at 1%, *
significant at 5%; r: linear correlation coefficient.
Table 5. Parameters of the simple semivariograms adjusted to some properties of soybean yield and soil (dystroferric Red Latosol)
(1) GY: soybean grain yield, FP: mean insertion height of the first pod, PH: plant height, NP: number of pods per plant, NG:
number of grains per plant, GW: 1000 grain weight; MA and MI, from 1 to 3, are respectively the macroporosity and microporosity of the soil collected in the valuated layers. (2) sph: spherical, exp: exponential, gau: gaussian, and epp: pure nugget effect; number
MA in the different layers was adjusted to the Gaussian (MA1) and spherical models (MA2 and MA3), ranging between 27.8 and 34.8 m, exceeding the values between 16.2 and 27.2 m found by Souza et al. (2001).
For GY, the r2 value found was 0.752, in agreement
with Freddi et al. (2006), who reported values from 0.598 to 0.798, and in contrast to Santos et al. (2005); Santos et al. (2006) and Reichert et al.(2008), reporting highest values of 0.868, 0.958 and 0.99, and Carvalho et al. (2006) and Reichert et al. (2008), who had found a r2 value of 0.89 for PH and range of 11.38 m, adjusted
to the exponential model, differing from the pure nugget effect found in this study.
The other plant attributes adjusted to the spherical model (NP, GW and NG) with ranges varying from 24.0 to 46.8 m. Regarding the ISD, the highest value found for GY (7.65 %) agreed with Santos et al. (2005) with a value of 50.1 %, and disagreed with Santos et al. (2006), Carvalho et al. (2006) and Freddi et al. (2006), who reported 73.1, 80.0 and 82.1 %, respectively. The five best cross-validations were established for MA and MI , whose correlation
coefficients varied between 0.796 and 0.567. For most properties, the magnitude of coefficient b was around 1, considered ideal according to GS+ (2004).
In the kriging maps of soybean and soil attributes (Figure 1), GY had the highest values (3,279-4,279 kg ha-1), mostly in the southwest, southeast and
north regions. In the northeast region, yield varied from 1,944 to 2,945 kg ha-1. For NG, similarity was
noticed in the spatial behavior, with highest values between 39.7–43.7 (southwest, southeast and north) and 78.2–86.6 (northeast), respectively. Regarding the soil attributes, an inverse and high similarity with the spatial behavior of MA was observed for MI in the different layers, with the following highest values: MI1 (0.408-0.370 m3 m-3), MI2 (0.419–0.385 m3 m-3)
and MI3 (0.410–0.380 m3 m-3). At the sites where MI
was lower, between 0.320 and 0.363 m3 m-3 (dark
halos), MA values were high (0.070–0.108 m3 m-3)
(Figure 1 c,d,e,f,g,h).
In terms of the performance of cross-semivariograms (Figure 2), the highest value of the spatial determination coefficient was obtained for the attributes MA2=f(MI2), evidencing that 89.9 % of the
spatial variability of the MA data could be explained by the spatial variability of MI. On the other hand, for the second [GY=f(MA1)], 71.9 % of the spatial variability of the GY data could be explained by MA. In agriculture, this co-kriging is highly important, once it can estimate the spatial variability of the GY from MA and MI with high statistical significance and this way, locate homogeneous zones for soybean management. This means that in the future, e.g., the spatial variability of soybean GY, for a same experimental location, can be estimated from the determination of the respective MA.
The range is important for the interpretation of semivariograms, indicating the distance up to where the plots are correlated to each other, in other words, points located in an area whose rayis the range, are more similar to each other than points separated by larger distances (Vieira et al., 1983; Carvalho et al., 2002). The values for the range of the spatial dependence in the cross semivariograms were between 25.8 m GY=f(NG) and 71.0 m GY=f(MI1). The correlation values were satisfactory. Regarding the GY, the models fit well to the field data with correlation
coefficient from 0.55 to 0.72, respectively. According to Milani et al. (2006) and Amado et al. (2007), the spatial variability of soybean yield had marked spatial dependence classified as weak to moderate, with values between 17.3 and 60.4 %, as reported by Cambardella et al. (1994).
From the edaphic point of view, co-kriging was best for the property MA2=f(MI2), which evidenced that 89.9 % of the spatial variability of MA could be explained in relation to MI, with an inverse correlation, that is, as MA increased MI decreased in the soil. Also in this case, it may be concluded that from the MA data, the soybean grain yield (GY) can be estimated and zones can be defined for the crop grown in the experimental area.
It was verified that where lower MI values were mapped the MA values were higher, consequently increasing the GY values, justifying the use of yield maps as tool to decision taking, referring to local management. Conservation practices can be recommended for zones where the MA3 values were higher, aiming to increase the grain yield.
CONCLUSIONS
1. The soybean yield, with medium variability, was considered high for national standards. However, the variability in most soil physical attributes was high, indicating that Crop - Livestock Integration is a system that generates heterogeneity in the environment.
2. The soybean grain yield could be explained by a linear mathematical model, regarding the number of grains per plant and soil macroporosity in the soil surface layer (0–0.10 m), but adjusts to the inverse linear model for soil microporosity in the soil surface layer (0–0.10 m).
3. In general, no random variation was observed in the evaluated attributes, following clearly defined patterns, with spatial dependence ranging from 24.0 to 46.8 m.
4. From the spatial point of view, the soil macroporosity in the 0.20–0.30 m layer is a good indicator of the physical quality of the evaluated soil for soybean grain production.
LITERATURE CITED
ALBUQUERQUE, J.A.; SANGOL, L.M. & OLSZEVSKI, N. Efeitos da integração lavoura-pecuária nas propriedades físicas do solo e características da cultura do milho. R. Bras. Ci. Solo, 25:717-723, 2001.
AMADO, T.J.C.; PONTELLI, C.B.; SANTI, A.L.; VIANA, J.H.M. & SULZBACH, L.A.S. Variabilidade espacial e temporal da produtividade de culturas sob sistema plantio direto. Pesq. Agropec. Bras., 42:1101-1110, 2007.
ANDREOLA, F.; COSTA, L.M. & OLSZEVSKI, N. Influência da cobertura vegetal de inverno e da adubação orgânica e, ou, mineral sobre as propriedades físicas de uma terra Roxa estruturada. R. Bras. Ci. Solo, 24:857-865, 2000. BAEUMER, K. & BAKERMANS, W.A.P. Zero-tillage. Adv.
Agron., 25:77-121, 1973.
BEUTLER, A.N.; CENTURION, J.F.; CENTURION, M.A.P.C. & SILVA, A.P. Efeito da compactação da produtividade de cultivares de soja em Latossolo Vermelho. R. Bras. Ci. Solo, 30:787-794, 2006.
BROCH, D.L.; PITOL, C. & SPERA, S.T. Influência de doses de fósforo e uso de calcário e gesso sobre o rendimento da soja em plantio direto sobre pastagem de Braquiária decumbens. R. Plantio Direto, 38:17-18, 1997.
CAMBARDELLA, C.A.; MOORMAN, T.B.; NOVAK, J.M.; PARKIN, T.B.; KARLEN, D.L.; TURCO, R.F. & KONOPKA, A.E. Field-scale variability of soil properties in central Iowa soils. Soil Sci. Soc. Am. J., 58:1501-1511, 1994.
CARVALHO, G.J.; CARVALHO, M.P.; FREDDI, O.S. & MARTINS, M.V. Correlação da produtividade do feijão com a resistência à penetração do solo sob plantio direto. R. Bras. Eng. Agr. Amb., 10:765-771, 2006.
CARVALHO, M.P.; SORATTO, R.P. & FREDDI, O.S. Variabilidade espacial de atributos físicos em um Latossolo Vermelho distrófico sob preparo convencional em Selvíria, estado de Mato Grosso do Sul. Acta Sci., 24:1353-1361, 2002. CARVALHO, M.P.; TAKEDA, E.Y. & FREDDI, O.S. Variabili-dade espacial de atributos de um solo sob videira em vitó-ria Brasil (SP). R Bras. Ci. Solo, 27:695-703, 2003. DAMPNEY, P.M.R. & MOORE, M. Precision agriculture in
England: current practice and research-based advice to farmers. In: INTERNATIONAL CONFERENCE ON PRECISION AGRICULTURE, 4., St. Paul, 1998. Proceedings… St. Paul, American Society of Agronomy, 1998. p.661-673.
DEMATTÊ, J.L.I. Levantamento detalhado dos solos “Campus experimental de Ilha Solteira”. Piracicaba, ESALQ/USP, 1980. 44p.
DOUGLAS, J.T.; GOSS, M.J. & HILL, D. Measurements of pores characteristics in a clay soil under ploughing and direct drilling, including use of a radioactive tracer (144ce) technique. Soil Tillage Res., 1:11-8, 1980.
EMPRESA BRASILEIRA DE PESQUISA AGROPECUÁRIA -EMBRAPA. Integração agropecuária. Capturado em 02 jan. 2001. Online. Disponível na Internet.http:// www.cpao.embrapa.br/pesquisa/integracao/index.html EMPRESA BRASILEIRA DE PESQUISA AGROPECUÁRIA
-EMBRAPA. Centro Nacional de Pesquisa do Solo. Manual de métodos de análise do solo. 2.ed. Rio de Janeiro, 1979. EMPRESA BRASILEIRA DE PESQUISA AGROPECUÁRIA -EMBRAPA. Centro Nacional de Pesquisa do Solo. Sistema brasileiro de classificação de solos. Rio de Janeiro, 1999. 412p.
EMPRESA BRASILEIRA DE PESQUISA AGROPECUÁRIA – EMBRAPA. Centro Nacional de Pesquisa do Solo. Manual de métodos de análise de solo. 2.ed. Brasília, 1997. 212p. EMPRESA BRASILEIRA DE PESQUISA AGROPECUÁRIA -EMBRAPA. Integração agropecuária. Capturado em 02 jan. 2001. Online. Disponível na Internet.http:// www.cpao.embrapa.br/pesquisa/integracao/index.html EMPRESA BRASILEIRA DE PESQUISA AGROPECUÁRIA
-EMBRAPA. Tecnologias de produção de soja – região central do Brasil - 2007. Londrina, Embrapa Soja, 2006. 225p.
FAHL, J.I.; CAMARGO, M.B.P.; PIZZINATTO, M.A.; BETTI, J.A.; MELO, A.M.T.; DEMARIA, I.C. & FURLANI, A.M.C. Instruções agrícolas para as principais culturas agronômicas. 6.ed. Campinas, Instituto Agronômico de Campinas, 1998. 396p. (Boletim, 200)
GS+: Geostatistics for Environmental Sciences. 7.ed. Michigan, Gamma Design Software, 2004. 159p.
JOHANN, J.A.; OPAZO, M.A.; SOUZA, E.G. & ROCHA, J.V. Variabilidade espacial dos atributos físicos do solo e da produtividade em um Latossolo Bruno distrófico da região de Cascavel, PR. R. Bras. Eng. Agríc. Amb., 8:212-219, 2004.
KIEHL, E.J. Manual de edafologia: Relações solo-água. São Paulo, Agronômica Ceres, 1979. 264p.
MACHADO, L.A.Z. & WEISMANN, M. Estabelecimento de forrageiras perenes em consórcio com a cultura da soja. In: SIMPÓSIO INTERNACIONAL EM INTEGRAÇÃO LAVOURA-PECUÁRIA, Curitiba, 2007. Anais... Curitiba, Universidade Federal do Paraná, 2007.
MARINS, A. C. Métodos de estimação da função semivariância aplicados a dados simulados e reais de produtividade da soja e de atributos físicos de um Latossolo. Cascavel, Universidade Estadual do Oeste do Paraná,2006. 140p. (Tese de Mestrado)
MESQUITA, M.G.B.; MORAES, S.O. & CORRENTE, J.E. Caracterização estatística de variáveis físicas do solo. Acta Sci., 25:35-44, 2003.
MILANI, L.; SOUZA, E.G.; URIBE-OPAZO, M.A.; GABRIEL FILHO, A.; JOHANN, J.A. & PEREIRA, J.O. Unidades de manejo a partir de dados de produtividade. Acta Sci. Agron., 28:591-598, 2006.
MOLIN, J.P. Agricultura de precisão, parte I: O que é e estado da arem sensoriamento. Eng. Agríc., 17:97-107, 1997. PITOL, C. O milheto na integração agricultura-pecuária. Inf.
Agron., 76:8-9, 1996.
REICHERT, J.M.; DARIVA T.A.; REINERT, D.J. & SILVA, V.R. Variabilidade espacial de Planossolo e produtividade de soja em várzea sistematizada: Análise geoestatística e análise de regressão. Ci. Rural, 38:981-988, 2008. ROBERTSON, G.P. GS+: Geostatistics for the environmental
sciences. Plainwell, Gamma Design Software, 1998. 152p. SANTOS, H.P. & TOMM, G.O. Rotação de culturas para trigo, após quatro anos: efeitos na fertilidade do solo em plantio direto. Ci. Rural, 29:259-265, 1999.
SANTOS, M.L.; CARVALHO, M.P.; RAPASSI, R.M.A.; MURAISHI, C.T.; MALLER, A. & MATOS, F.A. Correlação linear e espacial entre produtividade de milho (Zea mays L.) e atributos físicos de um Latossolo Vermelho distroférrico sob plantio direto do Cerrado Brasileiro. Acta Sci., 28:313-321, 2006.
SANTOS, P.A.; CARVALHO, M.P.; FREDDI, O.S.; KITAMURA, A.E.; FREITAS, E.E. & VANZELA, L.S. Correlação linear e espacial entre o rendimento de grãos do feijoeiro e a resistência mecânica à penetração em um Latossolo Vermelho distroférrico. R. Bras. Ci. Solo, 29:287-295, 2005.
SCHLOTZHAUER, S.D. & LITTELL, R.C. SAS: System for elementary statistical analysis. 2.ed. Cary, SAS, 1997. 441p.
SECCO, D.; DA ROS, C.O.; SECCO, J.K. & FIORIN, J.E. Atributos físicos e produtividade de culturas em um Latossolo Vermelho argiloso sob diferentes sistemas de manejo. R. Bras. Ci. Solo, 29:407-414, 2005.
SHAPIRO, S.S. & WILK, M.B. An analysis of variance test for normality: Complete samples. Biometrika, 52:591-611, 1965.
SILVA, J.R. & NOGUEIRA JUNIOR, S. Cereais de inverno: Entraves e possibilidade no Estado de São Paulo. Inf. Econ., 31:51-57, 2001.
SOUZA, L.S. Variabilidade espacial do solo em sistemas de manejo. Porto Alegre, Universidade Federal do Rio Grande do Sul, 1992. 162p. (Tese de Doutorado) SOUZA, Z.M. et al. Variabilidade espacial do pH, Ca, Mg e V%
do solo em diferentes formas do relevo sob cultivo de cana-de-açúcar. Ci. Rural, 34:1763-1771, 2004.
SOUZA, Z.M.; MARQUES JÚNIOR, J.; PEREIRA, G.T. & BENTO, M.J.C. Variabilidade espacial de atributos físicos em um Latossolo Vermelho distrófico sob semeadura direta em Selvíria (MS). R. Bras. Ci. Solo, 25:699-707, 2001.
SOUZA, Z.M.; MARQUES JÚNIOR, J.; PEREIRA, G.T. & BENTO, M.J.C. Variabilidade, espacial de atributos físicos de um Latossolo Vermelho sob cultivo de cana-de-açucar. R. Bras. Eng. Agríc. Amb., 8:51-58, 2004.