I
Assessing the use of price insurance tools to minimize
income volatility
Stable as a case study
Maria Francisca da Silva Mouga Viveiros
Dissertation to obtain a master’s degree in
Agriculture Engineering
Advisors: Luís Manuel Bignolas Mira da Silva
Francisco Ramos Lopes Gomes da Silva
Jury:
President: PhD Maria do Rosário da Conceição Cameira, Associated Professor of the Instituto Superior de Agronomia of the Universidade de Lisboa
Members:
PhD José Paulo Pimentel de Castro Coelho, Associated Professor with habilitation of the Instituto Superior de Agronomia of the Universidade de Lisboa
PhD Luís Manuel Bignolas Mira da Silva, Associated Professor of the Instituto Superior de Agronomia of the Universidade de Lisboa
III
Acknowledgements
I have to express my gratitude to my professors Luís Mira da Silva and Francisco Gomes da Silva for supervising my thesis; sharing their valuable knowledge and guiding me through the whole process.
Special mention to Richard Counsell for all the time and availability to always answer my questions with friendliness.
I would like to thank Cristina Mota Capitão for constantly being available to help.
I cannot forget to thank National Federation of Producers Organizations highlighting specially Alexandra Diogo for the readiness and for always being resourceful.
I would like to show my appreciation to all the Producers Organizations interviewed during this work: Frutus, Torriba, Hortofrutícolas Campelos, Global Fruit and Benagro for their availability and enthusiasm.
I cannot forget to acknowledge Professor Jorge Cadima for his help in the statistics analysis of my thesis.
I would also like to thank Professor Cristina Oliveira for all her help during last semester and for all her tips on how to write a thesis.
I must warmly thank my aunt and godmother Teresa Mouga for answering all my questions and for patiently but firmly pressuring me to finish my work.
Lastly, my parents and Martim, who always accompanied me on this journey, for that belief in me.
V
Abstract
Risk is an inevitable feature in agriculture. On one side, there is the unpredictability of weather, and crop and livestock performance, which enhances market risk, leading to changes in supply and the overall income of farmers. On the other side, demand in agriculture is inelastic, meaning that whenever there are big increases in production there aren’t proportional income increases.
The common agricultural policy has started to replace direct payments by risk management measures for farmers to manage their own risk. This study addresses risk measures that are currently being used in Portugal and studies some others currently used abroad, focusing on index-based insurance. To be effective, index-based insurance needs local, independent, public and trusted historical data.
With this work it is also intended to learn farmers’ need and demand for such products, and their willingness to use and buy them. To analyse that, producer’s organizations were interviewed. It was also considered important to contact growers, to learn if their opinion was different from the organizations they work with, and to learn the needs of non-organized farmers. Therefore, questionnaires were also made directly to farmers, at the national fair of agriculture.
After this step a statistical analysis was performed. It was concluded that there was not possible to prove that there was a relation between any pair of answers studied. To further study this subject the questionnaire should be applied to a bigger sample of farmers.
All in all, it was clear that the agricultural insurance business in Portugal is greatly overlooked, and the services that companies provide in this context aren’t built from the ground up for farmers.
Both farmers and producers’ organizations showed interest in acquiring index-based tools. However, they were mostly interested in risk management measures that cover crop instead of price.
Key words
Agricultural risk management strategies, index-based insurance, agricultural price data, Portugal, agricultural insurance.
VII
Resumo
O risco é um fator inevitável na agricultura. Por um lado, existem riscos de produção, associados à imprevisibilidade do clima, e ao desempenho das culturas e dos animais, aumentando o risco de mercado e levando a alterações na oferta, acabando por criar uma variação no rendimento dos agricultores. Por outro lado, como a procura na agricultura é inelástica, em anos de grandes produções não existe um aumento proporcional de lucros para o produtor.
Numa altura em que a política agrícola comum começa a dar menos ênfase aos pagamentos diretos em prol da gestão de risco por parte de cada agricultor, pretende-se estudar diferentes formas de gerir este risco. Este trabalho foca-se em seguros baseados em índices que para poder operar, necessitam de uma série histórica local, independente, pública e fiável de dados.
Pretende-se também entender qual é a necessidade e predisposição dos agricultores para adquirir um tipo de produto concreto. Para tal, entrevistaram-se organizações de produtores. Também foi considerado importante questionar os agricultores para perceber se tinham as mesmas opiniões que as organizações com que trabalham, e para perceber quais as opiniões dos agricultores não-associados destas organizações.
Após estes passos, foi feita uma análise estatística, na qual não se conseguiu provar que exista relação entre nenhum dos pares de respostas estudados. Para aprofundar este estudo, seria interessante aplicar este questionário a uma amostra mais ampla de agricultores. Em suma, tornou-se evidente que, em Portugal, o sector dos seguros agrícolas é negligenciado, sendo que as companhias de seguros generalistas não constroem os seus produtos com base nas necessidades dos agricultores.
Quer os agricultores quer as organizações de produtores mostraram interesse em adquirir produtos de gestão de risco com base em índices. No entanto, revelaram um maior interesse em ferramentas de gestão de risco que protejam a colheita em detrimento do preço.
Palavras-Chave
Medidas de gestão de risco agrícola, seguro com base em índices, dados de preço agrícolas, Portugal, seguro agrícola.
IX
Resumo alargado
O risco é um fator constante e inevitável na agricultura. Por um lado, existem riscos de produção, associados à imprevisibilidade do clima, ao desempenho das culturas e dos animais. O risco proveniente do clima acaba por afetar e aumentar o risco de mercado uma vez que diminui (ou aumenta) a oferta, e acaba por criar uma variação no rendimento dos agricultores. Por outro lado, a procura na agricultura é inelástica; em anos de grandes produções não existe um aumento proporcional de lucros para o produtor.
Numa altura em que a política agrícola comum começa a dar menos ênfase aos pagamentos diretos em prol da gestão de risco por parte de cada agricultor, pretende-se estudar diferentes formas de gerir este risco. Algumas das ferramentas de gestão de risco apresentadas neste trabalho já são utilizadas atualmente em Portugal, enquanto que outras são mecanismos utilizados noutros países.
Comparando a engenharia financeira utilizada na agricultura em Portugal versus o que já é efetuado em termos de gestão de risco noutros países, como, por exemplo, nos Estados Unidos da América, podemos constatar que há ainda muito espaço para evoluir. Os agricultores do outro lado do Atlântico selecionam medidas de gestão de risco de forma autónoma e informada. No futuro, para que os agricultores portugueses possam gerir o seu risco com igual perícia, é necessário que exista à sua disposição a formação necessária, bem como oferta de um leque de ferramentas de gestão de risco.
Este trabalho foca-se essencialmente em seguros com base em índices, um mecanismo ainda desconhecido em Portugal, contrariamente a outros tipos de seguros, já utilizados no nosso país. Os seguros baseados em índices foram escolhidos especificamente porque uma seguradora startup inglesa, a Stable, atualmente a operar em dez países diferentes com este tipo de produto, manifestou o seu interesse em entrar no mercado português. O seguro agrícola foi estudado uma vez que é o mecanismo mais utilizado em Portugal.
Um seguro baseado em índices permite reduzir a burocracia e a quantidade de pessoas necessárias à sua gestão, tornando-o um seguro mais económico. Este tipo de seguro não usa informação histórica da parcela para calcular prémios, mas sim uma série histórica de dados, por exemplo, do preço de venda. Neste caso, o utilizador escolhe um preço base, a partir do qual não quer que o seu preço de venda desça, e a data na qual planeia vender a sua produção. Se, quando chega a essa data, o preço de venda é inferior ao preço base escolhido anteriormente, então o agricultor recebe esta diferença de rendimento. O seguro é capaz de o fazer uma vez que calcula a probabilidade de o índice descer no futuro tendo por base a série histórica, permitindo assim ao agricultor proteger-se de uma descida súbita de
XI preços no futuro. Uma outra vantagem deste tipo particular de seguros é o rápido reembolso em caso de descida de preço, uma vez que este reembolso é automático e vai diretamente para a conta do agricultor, não havendo necessidade (nem o respetivo custo) de enviar um perito ao terreno.
Pretende-se também com este trabalho entender qual é a procura e a predisposição dos agricultores para utilizar e adquirir estes produtos. De forma a analisar esta necessidade foram feitas entrevistas a cinco organizações de produtores, nas quais compareceu o diretor executivo da Stable, de modo a demonstrar detalhadamente em que consiste este produto de gestão de risco. As organizações de produtores contactadas, todas pertencentes ao setor hortofrutícola, foram a Frutus, Torriba, Hortofrutícolas Campelos, Global Fruit e Benagro. Todas as organizações entrevistadas já utilizavam mecanismos de gestão de risco, sejam eles seguros agrícolas, contratos de venda ou variação de localização ou de cultura.
Adicionalmente, sentiu-se a necessidade de falar diretamente com os agricultores, para perceber se tinham as mesmas opiniões que as organizações com quem trabalham e para conhecer as necessidades dos agricultores não-organizados. Desta forma, foram efetuados questionários a cinquenta agricultores (na feira nacional da agricultura).
Após este passo, concluiu-se que a maioria dos inquiridos não utiliza diretamente qualquer medida de gestão de risco. Dos agricultores que utilizam alguma ferramenta para minimizar o seu risco, a mais utilizada é o seguro agrícola. Os agricultores que utilizam seguros, geralmente fazem parte de organizações de produtores, confirmando o que defenderam as organizações nas entrevistas, que fazem seguros coletivos para todos os seus associados. As organizações também referiram que para gerir grandes áreas e grandes produções o seguro de colheita torna-se essencial. Porém, as organizações não estavam completamente satisfeitas com este serviço. O seguro não tinha cobertura suficiente, não assegurava todos os produtos produzidos pela organização e, em caso de sinistro, demora demasiado tempo a pagar a indeminização à organização, e consequentemente esta a pagar aos seus associados. Desta forma, os agricultores e as organizações de produtores sentem que o setor dos seguros agrícolas é negligenciado, e que as companhias de seguro que providenciam estes serviços não constroem os seus produtos com base nas necessidades do agricultor. Tal explicará a reduzida adesão deste mecanismo no nosso país e a insatisfação dos seus utilizadores.
A maior parte dos agricultores contactados está mais interessada em proteger a colheita do que em proteger o seu preço de venda, uma vez que sentem que o maior fator de variabilidade do rendimento é a imprevisibilidade do desempenho das culturas. Apesar de reconhecerem que são necessários mecanismos de gestão de risco mais direcionados para os agricultores,
XIII a maioria não está disposta a gastar mais de cinco euros para adquirir estes mecanismos por cada cem quilos de produção.
Outros resultados interessantes referem-se ao facto de, apesar da maioria dos agricultores não estar disposta a gastar muito dinheiro para se assegurar, os inquiridos pareciam estar dispostos a gastar mais dinheiro para segurar a sua produção do que para segurar o seu preço, o que faz sentido tendo em conta o que foi referido acima. Quando inquiridos sobre se estariam mais interessados em seguros de preço ou seguros de colheita, a maior parte dos agricultores escolheu seguros de colheita. No entanto, dos agricultores que escolheram seguros de preço, mais de oitenta por cento não utilizavam qualquer medida de gestão de risco. Ora, estas constatações levantam inevitavelmente a questão: os seguros de preço existentes corresponderão às necessidades dos agricultores?
Mais ainda, os agricultores mais jovens usam mais medidas de gestão de risco no total e são também quem usa medidas mais diversificadas. Agricultores que cultivam áreas maiores têm tendência a utilizar mais mecanismos de gestão de risco, o que faz sentido uma vez que áreas maiores têm mais fatores de risco associados e são também os que costumam ter mais fundos disponíveis. Como parece existir uma tendência de correlação relativamente aos resultados acima apresentados foi efetuado um teste de independência, de modo a verificar se estas tendências seriam significativas. No entanto, a hipótese nula não foi rejeitada nos testes de independência, i.e., não se pode descartar a possibilidade de que as variáveis sejam independentes, pelo que, a aparente tendência de correlação não foi provada.
Para penetrar no mercado português, seria mais interessante a Stable oferecer seguros de colheita baseados em índices, uma vez que, como vimos anteriormente, é o que os agricultores portugueses mais procuram.
A distribuição do seguro desenvolvido pela Stable deveria ser efetuada através de organizações de produtores. Por um lado, grande parte dos inquiridos pertence a uma organização, pelo que daria acesso à Stable a um grande número de agricultores. Por outro lado, as organizações já fazem seguros de colheita coletivos, pelo que este seria mais um serviço que poderiam adquirir para todos os seus associados. Finalmente, os agricultores portugueses mostram alguma desconfiança e desconhecimento no que se refere à gestão de risco, pelo que será preferível que estes sejam abordados por quem já trabalha com eles e os possa aconselhar.
XV
Index
Index of Figures ... XVII List of Acronyms ... XIX
1. Introduction ... 1
2. Literature review ... 5
2.1 Introduction to risk in agriculture ... 5
2.2 Solutions in the market ... 15
2.3. Agricultural risk management in Portugal ... 19
2.4. Solution designed by Stable ... 23
3. Methodology ... 27
3.1. Steps taken during this work ... 27
3.2. Statistical Methods Used ... 29
4. Results and Discussion ... 33
4.1. Introduction ... 33
4.2. POs Interviews ... 33
4.3. Farmers Questionnaires ... 37
5. Conclusions ... 61
Bibliography ... 65
Annex 1: Chi-squared distribution probability table ... 67
Annex 2: POs Interviews ... 69
Annex 3: Farmers Questionnaire ... 71
Annex 4: ... 75 Annex 5: ... 77 Annex 6: ... 79 Annex 7: ... 81 Annex 8: ... 83 Annex 9: ... 85
XVII
Index of Figures
Figure 1- Trends in real commodity prices ... 5
Figure 2- Areas of concern – Extreme weather events ... 7
Figure 3- Inquired farmers age scatter ... 37
Figure 4- Inquired farmers production destination ... 39
Figure 5- Geographical origin of the farmer ... 39
Figure 6- Inquired farmers farm size ... 41
Figure 7- Percentage of inquired farmers belonging to a Producers Organization ... 41
Figure 8- Farmers opinion on whether their income suffer from volatility ... 43
Figure 9- Inquired biggest source of income volatility ... 43
Figure 10- Risk management strategies used by inquired ... 45
Figure 11- Respondents insurance preference, crop or price ... 45
Figure 12- How much inquired farmers were willing to pay for insurance premium ... 47
Figure 13- Risk management strategies used versus respondents belong to a PO or not .... 49
Figure 14- Risk management strategies used versus farmed areas ... 51
Figure 15- Risk management strategies used versus whether farmers believe there is volatility in their income ... 53
Figure 16- Risk management strategies used versus inquires farmers ages ... 55
Figure 17- Risk management strategies used versus the preferred type of insurance, crop or price ... 57
Figure 18- Preferred insurance versus how much respondents would be willing to pay as an insurance premium ... 59
XIX
List of Acronyms
AIS - Agricultural Insurance System
AMIS – Agricultural Markets Information System CAP – Common Agricultural Policy
CEO - Chief Executive Officer EU – European Union
ISPCACR - Integrated System of Protection of Cultures Against Climate Randomities NFPO – National Federation of Producers Organizations
NSI - National Statistics Institution
OAMAFI - Observatory of Agricultural Markets and Agri-food Importing PO – Producers Organization
PPGAO - Planning, Policies and General Administration Office USA – United States of America
1
1. Introduction
Agriculture isn’t an exact science and risk is an inevitable component of the activity. There are production risks that come from unpredictable nature of the weather and the performance of crops or livestock. The prices of farm inputs and outputs are always uncertain – leading to market risk. Weather risk affects, and enhances, market risk as changes in weather inevitably lead to a changing supply of agricultural products and changing market prices (Hardaker, Huirne, Anderson, & Lien, 2004).
Nowadays, the main mechanism of the Common Agricultural Policy (CAP) has been direct payments to promote stabilization in prices and farmers’ incomes. However, looking ahead and facing the effects of climate change, more intense and frequent phenomena will probably take place. These phenomena will continue to enhance weather risk, to increase market risk and will lead to an even greater volatility in the Agricultural sector, which will originate a decrease in European Union’s (EU) competitiveness in the global market.
Therefore, there is a need to introduce more risk management measures in the next CAP. The current CAP already has some risk management measures, but their effect is residual. If new risk management measures were implemented, every farmer could manage and outsource their risk. Farmers would be protected not only against market risk, and the oscillations of demand and supply, but also against the growing threat of weather risk, and without overloading the EU budget. This change would allow farmers to manage their own risk, not depending of external entities.
In the United States of America (USA) farmers have been responsible for managing their own risks for decades through futures and options markets. Nevertheless, these kinds of contracts require a large volume of produce to be traded. This is possible since farmers in the USA have much larger areas, and much larger productions than Europeans. Trading in the futures market is unfeasible at this side of the Atlantic, at least for the vast majority of farmers.
In Portugal, farm areas are much smaller than in the USA, and the average in the EU. Therefore, the most used risk management tool has been crop insurance. There has been crop insurance since the 1980’s although their policies have changed over the years.
This thesis presents a different risk management tool: a private company (Stable) that provides risk management with simplicity. This tool was created in the UK and is currently being used in ten other countries, such as Argentina, Poland and Australia, amongst others. Even though in the UK this tool works mostly with dairy, meet and arable crops, Stable is always looking to diversify the products they work with and the countries they work in. If these products have no correlation between them, better for Stable, that takes less risk to insure them, i.e., if this tool
3 insures beef in Argentina and cereals in Poland, when the price of beef drops in Argentina it will have no correlation with the price of cereals in Poland, which will remain the same, and this might be an advantage for an insurance company.
The purpose of this work is, thus, to study the possibility of implementing Stable’s tool in Portugal, insuring fruits and vegetables. This study also analyses the steps needed to be taken for Stable to be able to work in Portugal.
This thesis presents the risk management strategies already in use in Portugal and the openness for new tools as the one developed by Stable.
First, it was needed to understand if Producers Organizations (POs) and farmers considered market price volatility to be a serious problem in need of a solution, if they already used any solution and if they were happy with its’ performance.
To do so, five POs were contacted: Frutus, Torriba, Hortofrutícolas Campelos, Global Fruit and Benagro, all from the fruits and vegetables sector.
Second, fifty farmers were questioned to understand if farmers themselves had the same opinion as POs and if farmers that didn’t belong to any PO also had the same opinion. This was done in order to understand if a solution like Stable’s could be the ideal fit for Portuguese agriculture.
Stable’s idea isn’t new, what is innovative about this new tool is the simple way it approaches
risk. Any farmer that doesn’t understand financial markets or futures is able to realise how much it will cost to insure his/her crop with little information available. Studying this tool is an original idea since risk management in Portugal has not been deeply analysed.
5
2. Literature review
2.1 Introduction to risk in agriculture
Risk is an inevitable feature in agriculture. There are production risks that come from the unpredictable nature of the weather and uncertainty about the performance of the crops or livestock. The incidence of pests and diseases is among other unpredictable factors. Furthermore, prices of farm inputs and outputs are uncertain – leading to market risk (Hardaker, Huirne, Anderson, & Lien, 2004).
Weather risk affects, and enhances, market risk. Weather risk can create variations in production that will create market price oscillations making agriculture one of the most volatile markets.
Farmers have little ability to control the prices they sell at, which means that they are price-takers. Prices in agriculture, like every other market, are influenced by the demand and supply. But the demand in agriculture is inelastic, meaning that the quantity demanded does not react to price changes (Counsell, 2016).
If farmers want to increase their level of production, to have a greater market share, the market price they sell at is at risk. On one hand, if there is a downfall in production the price increases. On the other hand, when there is a rise in production, the farmer is left with a considerable amount of product he/she may only sell at a low price.
“Variability in farm income depends on the variability of prices, yields, costs and support but also on the co-variability among all these factors and the diversification in production.” (Schaffnit-Chatterjee, 2010, p. 27). Prices of inputs in agriculture have also shown volatility especially throughout the last decade. As seen bellow, in Figure 1, there were peaks in the prices of fertilisers, energy, metals and minerals, in 2007-2008 and 2010-2011, which inevitably lead to an increase in volatility of agricultural market prices.
Figure 1- Trends in real commodity prices
7 But, historically farmers would diversify their crops to protect them from such risks. Nowadays farmers tend to focus on only one crop in order to reduce fixed costs, making them more exposed to volatile markets, moreover since their entire income comes from one single product (Counsell, 2016).
Looking ahead, agricultural risk management must incorporate the effects of climate change. These more intense and frequent phenomena will certainly increase agricultural risks and make markets even more volatile. Bellow, in Figure 2, it can be seen the areas that have already suffered from extreme climate events, such as heatwaves and droughts, in 2017-2018. In the near future these extreme weather events will tend to increase.
There are some government schemes to eliminate some sources of risk in order to support the prices of farm products, such as the CAP of the EU and farm support programs in the USA (Hardaker et al., 2004).
Without appropriate measures to control agricultural risks, the EU could suffer from a reduction of production and competitiveness. To prevent that and to achieve stabilization in prices and incomes it is necessary to implement adequate strategies of risk management in the CAP post 2020. If farmers understand that risk is something they can outsource, using the implemented strategies, there will be less uncertainty ahead (Avillez, 2016; Pinheiro, 2017; Sampaio, 2017).
Figure 2- Areas of concern – Extreme weather events
9 Until CAP 1992 natural risks weren’t a part of the community measures even though market risks were. This assured responsible price making, avoiding price uncertainty and assuring stable farmers’ incomes (Avillez, 2016).
By 2000 the CAP had already dismantled most of price making measures which were interchanged by the progressive introduction of direct payments to production. The mission of 2003 CAP reform was to start disconnecting these payments from production. Nevertheless, it contained three forms of risk management:
1. Subsidizing insurance premiums for natural disaster insurances; 2. Support mutualist funds to prevent big income losses; and 3. Establishing a base coverage against severe losses in income.
These measures aimed to reduce catastrophic losses of production or income. Nowadays, all three measures are considered quite limited in their application as well as the funds available (Avillez, 2016).
In 2005 the EU decided that most of its help would be in the form of disconnected payments (Avillez, 2016).
The 2013 CAP reform brought some exciting news, as risk management became a part of the mandatory measures to all member states. Although they were still quite limited, there were four articles that referred to them:
1. Article 36 classified new measures into three groups:
- Financial contribution for agricultural insurance premiums;
- Financial contribution to support mutual funds in the management of climatic and sanitary events, and natural disasters; and
- Financial contribution to support mutual funds to apply an Income Stabilization Instrument whenever there are severe losses of income.
2. Article 37 introduced the use of indexes to predict a certain crop production downfall. 3. Article 38 widened the support to mutual funds whenever there are serious climate
events. Also, it widespread the use of indexes to calculate the annual production loss. 4. Article 39 created an Income Stabilization Instrument through financial support to
mutual funds (Avillez, 2016).
Finally, the last CAP reform, 2014-2020, complements these measures with governmental intervention on the markets, private storage and giving back to farmers.
11 1. Stabilization Income Instrument supports mutual funds to make up for severe income
losses (above 30% of average revenue);
2. Counter Cyclical Payments include equilibrium prices, floor prices, roof prices for different commodities, threshold prices for market regulation and threshold prices for financial solidarity:
– Equilibrium prices are calculated according to average production costs. Floor and roof prices depend on the EU dispersion;
– Countercyclical payments are payed whenever the average market price is below the floor price for a certain amount of time according to historic means and not the actual values;
– If prices go below the threshold price for market regulation, there will be a market intervention creating regulation stocks that shouldn’t be higher than a certain value; and
– For values above the floor prices the regulation stocks are freed and for values above the threshold price a tax must be paid for financial solidarity (Avillez, 2016).
Whenever the market prices are in between the roof prices and the floor prices there is no need for market intervention or taxes.
There are some downsizes to these measures such as the loss of economic efficiency, only help a small number of farmers and they are too sensible to a given price (Avillez, 2016). Even though the most recent CAP has all these measures available to farmers, they are still quite limited since:
- Their use isn’t mandatory amongst the member states of the EU; - Their budget is joint with the Rural Development Program;
- Introduces an Income Stabilization Instrument, which won’t be easily operational in the short term; and
- They are still quite marginal when compared with American policies - Farm Bill 2014-2018 (Avillez, 2016).
On the other side of the Atlantic, the USA have in place the Farm Bill 2014-2018, which establishes the following:
- Price Loss Coverage which provides protection whenever the higher of the market year average price or the national average loan rate for the covered commodity is less than the respective reference price;
- Dairy Margin Protection Plan which offers coverage when the difference between the margins calculated based on average national prices of both milk and feed drop below
13 - a reference margin. Works like an insurance with different coverages and different
premiums; and
- Agriculture Loss Coverage that can be calculated at the county level or at a personal level. At the county level it provides a payment when the county crop revenue of a commodity is less than the guaranteed for that commodity. At the particular level disburses whenever the difference between annual revenue is lower than 86% average (Avillez, 2016).
The main differences between Farm Bill 2014-2018 and the CAP 2014-2020 are:
- Direct payments are the core purpose of the CAP, using 72% of the budget whereas risk management measures use only 6%;
- In the USA risk management and price and income stability are the main objective of the Farm Bill, with 80% of the budget being directed towards these measures;
- Counter cyclical payments have an important role in the Farm Bill, but in the CAP, direct payments have a more important role; and
- The Farm Bill budget is partially flexible whilst the same doesn’t apply to the CAP budget (Avillez, 2016).
After comparing these two very distinct policies, it becomes clear that there is a need to reinforce risk management and price and revenue programs on the next CAP.
As stated before nowadays the main purpose of the CAP are direct payments. But, if we take into consideration the growing globalization, the high volatility of markets and the income variation for farmers, CAP must change in order to prevent losing its economic competitiveness. Otherwise, CAP won’t be able to release the necessary funds to invest in risk management nor in price stability (Avillez, 2016).
Thus, to be able to maintain EU’s position in the international market CAP should replace part of the direct payments system by some effective risk management strategies. This way public policy would be responsible for farmers informed risk management decisions. Furthermore, it would be possible to free enough funds to keep on investing in the risk management system (Avillez, n.d., 2016; Schaffnit-Chatterjee, 2010).
However, it is essential to keep subsidies for farms that aren’t able to be competitive but are vital on an environmental and social level (Avillez, 2016).
15
2.2 Solutions in the market
As mentioned above there is the need to use more frequently financial products like insurances, futures and other derivatives. Below it can be overviewed the most important methods already available for farmers to hedge risk.
2.2.1 Insurance
It is possible to insure crops against natural disasters, usually promoted and subsidized by governments. There are also some insurance companies that offer saving schemes as a way for farmers to share the risk they may suffer.
All insurance companies operate in the same manner. An insurance company requires premiums from a considerable number of clients so that they can pool the risk. The insurance company also uses information on the frequency and level of claims, so they can calculate these premiums. The overall value of premiums should be able to cover all indemnities also leaving a margin for the insurance company to make profit (Hardaker et al., 2004).
There are a variety of insurances. There are crop insurances that provide payment whenever yields are lower than a previously established amount. There are price insurances that offer compensation if market prices go below an established value. There are also revenue insurances that cover both against falling prices and low crop yields. The catch with using solely crop insurance or price insurance is that whenever crop yields fall there is an increase in price, since supply is lower. And whenever price falls it usually means that there is an increase in supply, meaning that the farmer will get payed less per ton but will have produced more tons.
There are even different crop insurance options. There’s single-peril insurance that is favourable to insurance companies, since they are cheaper, and protect the farmer solely against one source of risk. With multi-peril insurance there is the possibility to cover a whole set of hazards. Usually this last type of insurance is connected to the public sector. It either pays part of the premium or helps insurers whenever there are too many losses (Kang, 2007). A few different solutions could be to broaden insurance coverage using revenue insurance, supporting the use of index-based insurance, weather derivatives, using insurance securitization to reinsure the market against systemic risk or natural catastrophes. These options are even more useful in developing countries, where governments cannot support risk management strategies. For this transition to happen, governments will need to facilitate the
17 communication between specialized financial agencies and farmers, so that farmers can negotiate on the markets with equal financial expertise (Kang, 2007).
There is also disaster aid. Whenever a disaster occurs, farmers expect the government to help. The problem begins when the definition of disaster is broadened and embraces more modest falls in production. If that happens frequently farmers get reassured and their irresponsibility is promoted. If that is the case insurance mechanisms are a better option other than disaster aid (Hardaker et al., 2004; Kang, 2007; Kang & Mahajan, 2006; Schaffnit-Chatterjee, 2010).
2.2.2 Index-based tools
Index-based tools enable the coverage of a larger number of hazards like rainfall, yields and price falls. Transferring their risk to the global markets will, on one hand allow farmers to protect their short-term revenues from global market prices downfall, and on the other hand, provide them with an outlet for perishable crops (Allen, Heifner, & Helmuth, 1976; Kang, 2007). Index based mechanisms offer one advantage when compared with insurances, since they offer lower transaction fees as it doesn’t need farm-level yield data. It is possible to find derivative prices using financial engineering techniques with simulation models (Assa, 2015; Kang, 2007).
2.2.3 Futures and options markets
Financial products can be traded in two different markets: the exchange-traded market and the over-the-counter market. The exchange-traded market establishes the conditions of the contracts so that traders can be assured the contracts are going to be executed. The major difference between the exchange-traded market and the over-the-counter market is that in the latest, the conditions of the contract can be adapted to each client’s needs, whilst in the exchange there are mandatory conditions for every contract. At the same time, there is the risk of a contract not being honoured that doesn’t exist in exchange (Yan & Hull, 2007).
Future contracts are agreements, between two parties, to buy an asset, sold on an exchange, sometime in the future. The contracts are standardized, meaning the exchange defines the amount of the asset dealt, when the delivery is to be made, etc. One of the advantages of a future contract is that you can easily give up your position, i.e., you can sell the contract at any time, before the expire date. Usually contracts are closed before maturity (Hardaker et al., 2004; Yan & Hull, 2007).
19 To enter a future contract, you must open a margin account with a broker. These contracts are settled daily, which means that, each day, the price increases or decreases, according to the contract established in the margin account, with the corresponding immediate gains or losses. Future contracts trade large volumes making it hard for small farmers to use financial products like so (Allen et al., 1976; Damodaran, 1996; Yan & Hull, 2007). In countries where the use of financial instruments is more common it is possible for a buyer or a seller to purchase the opposite position in the future market. In other words, a farmer that is planning to sell his production in six months, can sell a futures contract today and buy it back in six months. This way the profits/losses from the physical market can compensate for the losses/profits of the futures market (Kang & Mahajan, 2006).
“Most agricultural options have futures contracts as the underlying asset” (Hardaker et al., 2004, p.238). An option on the futures market gives the holder the right to buy or sell the futures contract at an established strike price, before or on the expiration date. The holder has the right to buy but not the obligation. There are two different options, an option to buy is a put option and an option to sell is a call option. For contracts to be possible there must always be a put option for every corresponding call option (Hardaker et al., 2004; Yan & Hull, 2007). There are European style options that can be exercised only on the expiration date, while American style option can be exercised until the expiration date. The last ones are the most commonly used in agriculture (Damodaran, 1996; Hardaker et al., 2004; Kang & Mahajan, 2006; Yan & Hull, 2007).
The Chicago Mercantile Exchange, a leading futures exchange, has a diverse offer of agriculture futures and options with a portfolio of grains, oilseed, livestock and dairy products such as corn futures, corn options, soybean futures, soybean options, soybean oil futures, live cattle futures, lean hog futures, amongst others.
2.3. Agricultural risk management in Portugal
Prices for agricultural products are quite dependent of the market. Hence, it is crucial for farmers to be able to reduce all the predictable forms of risk. Effectively managing agricultural risk could be the solution to stabilize farmers’ incomes in Portugal, but unfortunately, they aren’t currently used as much as they could. Nowadays the only risk management instrument widely used in Portugal is agricultural insurance.
The main difference between insurance and the remaining instruments is that they altogether, except insurance, require a large amount of money to access. Meaning that farmers with low productions are not able to trade on the futures market contrary to what is done on the other
21 side of the Atlantic. American farmers can trade on the futures market far more easily than Portuguese farmers since they have greater productions and areas and, therefore, income. For instance, an average American property is around one hundred sixty hectares while an average Portuguese farm is twelve hectares. This large difference has made it impossible, until now, for other risk management strategies to be used in Portugal, other than insurance.
2.3.1. Agricultural insurance in Portugal
Agricultural insurance has been around in Portugal ever since the 1980’s. Back then, the premiums required were too high, and very few insurers were willing to work in higher risk regions (Sampaio, 2017).
Whenever there was an insurance claim, the payment wouldn’t match the actual damages and farmers became less interested in insuring their crops. Gradually the only people eager to insure their yield were the ones who were more susceptible to risk, and for that, were the ones insurers were least sympathetic about (Sampaio, 2017).
Thus, by 1996 the Integrated System of Protection of Crops Against Climate Randomities (ISPCACR) was created. It had three different elements:
- Crop Insurance;
- Disaster Fund – Compensation for farmers whenever the peril wasn’t insured; and - Compensation for Claims – Payments to insurers whenever there were too many
damages (Sampaio, 2017).
The Program was entirely funded by government money making it impracticable due to the countries budgetary constraints at the time. After awareness that these instruments could be co-financed by the EU it was established a new agricultural insurance program in Portugal. It was called Agricultural Insurance System (AIS) and was subdivided in three insurances: Crop Insurance, Crop Insurance for Viticulture and Crop Insurance for Fruits and Vegetables. The ISPCACR Compensation for Claims was also active. This new insurance system showed a risk independent coverage strategy and better answered farmer’s needs (Sampaio, 2017). These new insurance mechanisms lead to a substantial increase in the number of farmers insured. From 1995 to 1999 the number of insurances rose from 3,000 to 104,000. This sudden increase was certainly due to the support for the premium, the fact that the risks that weren’t covered by the insurance were covered by the Disaster Fund and that the Compensation for Claims would benefit the insurers position (Sampaio, 2017).
23 After 1999 there was a decrease in the number of insurances. This was led by a reduction of the number of farms and by the fact that there wouldn’t always be declared a disaster. If the risk was uncovered losses up to 50% had no coverage, and the help provided by the Disaster Fund was offered as a credit line with interests (Sampaio, 2017).
Both the ratio of Insured Production versus Total Production and Insured Area versus Total Area took a downfall for most crops. Therefore, in 2013, it was established a new insurance system with new insured risks which lead to a new increase in the number of insurances. (Sampaio, 2017).
A good example of agricultural insurance in Portugal is the Green Wines’ case. The Viticulture Commission of the Green Wines Region (VCGWR) has been an insurance policy taker, dealing with over 20,000 farmers, since 1997. This insurance guarantees that every grower included in this combined insurance had his/her crop protected from weather incidents. This initiative was only possible due to the ISPCACR support in the early years (Pinheiro, 2017).
Despite all that, there are drawbacks in using a large insurance policy. For instance, there isn’t a bonus for farmers with little incidents because their risk cannot be separated from the group. That is to say, a driver with little incidents pays a lower insurance premium when insuring their car but when using collective insurance that isn’t possible, for he must pay a fraction of the total premium (Pinheiro, 2017).
2.4. Solution designed by Stable
Stable is an insurance technology, “insurtech”, solution designed and built from the ground up
for farmers to help them manage price volatility and build a stable income. It simplifies financial risk management making it accessible and useful for farmers.
It’s a simpler alternative to futures. Futures use exchanges to transfer risk from farmer to speculator while Stable transfers risk from farmer to insurer.
Stable can link the farmer to the insurer/underwriter. The farmer pays a premium to underwriter
and Stable earns a commission from the underwriter; it takes no risk since the contract is between the farmer and the underwriter.
Stable works out the probability of the index price falling in the future. For instance, considering
the Portuguese strawberry price. It works out a premium the farmer should pay (per kilogram) to transfer the risk to the insurer. They pay a premium just like insuring a tractor/car. To operate, Stable needs a transparent and trusted index (for example issued by the government). Then the farmer selects the amount they wish to insure/protect, for instance, 1000 kg, the
25 calendar month they wish to protect, for example, July 2018, and they select the index floor price. If the index price in July 2018 is lower than the floor price they selected, then the farmer has their lost index-income replaced.
If market price at the selected date becomes higher than the floor price selected by the farmer, then the farmer loses the premium he paid (and the underwriter keeps it) but he would have received more for his physical crop.
Therefore, Stable is a product that protects farmers from an unexpected drop in prices in the future. In derivative world this is a ‘put option’, but insurance is simpler, less regulated for the farmer and has lower basis risk. Meaning that Stable can use an index that is local and publishes prices that are more closely related to the price the farmer would actually receive for their physical crop. Futures are often characterised by high basis risk, in other words, the price on the futures market may be in a different currency which makes it harder for a farmer to create a position that protects his farm if the currency rate changes.
This product only uses price index not related with crop yields. This means that when ten tons of tomatoes are insured, and they are lost due to a plague it is not covered by Stable. The farmer can insure with others for that event, Stable would only pay if the price of tomatoes fell above the agreed amount (“Income Insurance for Farmers - Stable,” n.d.).
27
3. Methodology
3.1. Steps taken during this work
During this work, four steps were taken: they were a literature a review, interviews to Producers Organizations, questionnaires to farmers and a statistical analysis. Below, each step is explained in detail.
3.1.1. First step
Firstly, there was a literature review about the subject of this thesis, starting by a comprehensive introduction about risk in agriculture. Then a review was done of the different risk management strategies already existing worldwide. Afterwards the current risk management measures existing in Portugal were covered and how they have changed over the years. And finally, it was analysed the basic information about how Stable’s solution works.
3.1.2. Second step
Secondly, to learn if market price volatility is considered a problem by the fruits and vegetables sector, if there is the need to find a solution and if that solution could be similar to Stable’s tool, interviews were done with five POs from the fruits and vegetables sector. They were Frutus, Torriba, Hortofrutícolas Campelos, Global Fruit and Benagro.
It was decided to contact these specific POs since, advised by NFPO, they were considered the most developed POs in the risk management subject, and therefore the ones that would have better grounded opinions about the matter. All of them currently use other risk management strategies such as insurance, sales contracts and crop or location variation. The fruits and vegetables sector was chosen because it is one of the sectors of production where variability and price instability is more evident, and so is adequate to the use of risk management tools like price insurance.
3.1.3. Third step
Thirdly, to understand if farmers had the same opinions as the POs they work with, and to learn the opinions of non-organized farmers, questionnaire were undertaken. A sample of fifty farmers was questioned at the National Agriculture Fair because it is an event that gathers farmers from the entire country. In these questionnaires the sample was characterized, farmers were asked about the risk management strategies they already used and about what they would want out of a new tool. Some farmers to whom this questionnaire was applied were chosen randomly, others were also chosen by NFPO as the ones that were better informed about risk management, even though not all of them used risk management strategies.
29
3.1.4. Fourth step
Finally, to analyse respondents’ data Microsoft Excel was used. Respondents answers were inserted in a worksheet and pivot tables were used to analyse these data. To further examine the distribution of different farmers profiles, pie graphs showing their answers were also made. Subsequently clustered column graphs were produced showing pairs of questions to see if there were correlation tendencies.
3.2. Statistical Methods Used
To further analyse the results, independence tests were performed to six different pairs of variables (answers) that showed the biggest correlation tendencies. This was performed in order to understand if there was a correlation between them. To do so, firstly, these pairs of answers were arranged in double entry tables (entry A and entry B).
If there is independence between the two answers the joint probabilities are equal to the marginal probabilities. Meaning that the null hypothesis would be equal to:
𝐻
": 𝜋
%&= 𝜋
%.∗ 𝜋
.&where:
πij is the probability of an observation on the cell (i,j)
πi. is the marginal probability of an observation on the level i of the factor A (whatever the level of the second factor)
π.j is the marginal probability of an observation on the level j of the factor B (whatever the level of the first factor)
The Pearson statistic or chi-squared tests are used for categorical data, to evaluate how likely a correlation tendency is likely to happen by chance.
To calculate the chi-squared statistic formula is:
𝑋+ = , ,(𝑂%&− Ê%&)+ Ê%& 2 &34 5 %34
31 where:
a is the number of levels of the A factor. b is the number of levels of the B factor. i is the number of observations of the A factor. j is the number of observations of the B factor. Oij is the observed value of the (i,j) cell.
Êij is the estimated expected value of the (i,j) cell.
The estimated expected value is given by:
Ê%&=𝑁%.∗ 𝑁.& 𝑁%& where:
Ni. is the marginal total of the line i. N.j is the marginal total of column j. Nij is the total sample.
The confidence level, or the probability of type 1 error considered is: α = 0.05 The degrees of freedom are given by: (a - 1)(b - 1)
If the calculated test statistics is higher than the value presented on the chi-squared probability distribution table (in annex 1) for (a - 1)(b - 1) and α = 0.05, then the null hypothesis is rejected. And we can conclude that there exists dependency between the two variables.
Otherwise, in case we do not reject the null hypothesis, we can’t deny the possibility of independence between the two variables (Martins, 2010).
33
4. Results and Discussion
4.1. Introduction
Our first goal was to understand if POs considered price volatility to be a serious problem inside their organizations, if they though there was the need for a solution and whether the solution we presented, Stable’s solution, could be the right fit for this problem.
And our second goal was to speak to farmers themselves, to learn if individual farmers would also be interested in an insurance as described, both those who belong to POs and those who do not.
4.2. POs Interviews
Direct interviews (see interview guide attached in annex 2) were conducted alongside Stable’s Chief Executive Officer (CEO), Richard Counsell, to POs, of the horticultural sector at their local place of business.
The aim of these interviews was to learn about whether these POs suffered from market volatility, what risk management strategies are already in use in these organizations and if these measures hedge the risk according to their needs. It was also intended to find out if there is demand for additional risk management tools, such as the tool designed by Stable. The contacted POs were Frutus and Global Fruit that focus on fruits and Torriba, Hortofrutícolas Campelos and Benagro focusing on vegetables, advised by NFPO, because they were considered the most developed POs in the risk management theme, and therefore the ones that would have better grounded opinions about the matter.
All POs said they had to handle volatile markets and production fluctuation, that characterizes the fruits and vegetables sector, and all had their own ways to manage these risks, all quite different from each other.
Frutus, worked mostly with pears, and had different orchards in several geographical locations. In this way they were able to minimize risk since, if there were extreme weather events in one geographical area, all the other orchards located in other areas would possibly not suffer any losses associated with such weather events, and only a part of their production would be compromised.
Global Fruit worked with a set of different fruits as another way to minimize risk. That is, the strategy implemented is to produce different crops to decrease the loss of income in case of a specific plague or disease. Producing different crops means that if there is a plague or disease
35 in one specific crop the entire production will not be compromised, and there would only be a loss in production of the specific crop attacked.
The POs that worked with vegetables mainly produced vegetables that were meant to be transformed by the industry. Therefore, as an additional way to minimize price risk, farmers sell their entire production to industries in the beginning of each year. In this way there is no market price volatility for POs and for farmers that work alongside them. Thus, their main concern was yield, i.e., if production would drop income decreases, due to a decline of total weight of vegetables sold.
POs were in general pleased with the prices they received from industry, but obviously they would not mind having higher prices. However, they believed that what they receive is fair. Also, all interviewed POs currently work with crop insurance, a different way to minimize risk. They stated that the service was useful and necessary to prevent big losses in production, but not good enough. This insurance had the same coverages for all POs. It covered hail, frost, persistent rain (raining for three consecutive days), violent downpour and whenever machines are unable to enter the field.
The main problems identified by POs regarding crop insurance was that it did not have enough coverage, e.g., it did not insure all the products their organization produced, and it took too long to pay back to the POs in case of an insured event occurred. Some POs also stated that in Portugal there are solely two insurance companies that provide insurance for agriculture, which means that the market is too small and there is no room for competition.
One of our questions was whether Stable’s product should be acquired by POs for all the farmers the organization worked with, or whether farmers should acquire it themselves. We have also questioned POs about what they thought would be the better fit. They all said that the organization acquiring the insurance for all their associates would be the best solution since they already had collective crop insurance.
All in all, after a detailed demonstration most POs were interested in Stable’s product. They were keen to learn how Stable could help them remove part of the risk they dealt with. POs were willing to learn about new ways to better cope with risk and about having another insurance company in the market, even if just to tighten competition. They believed there is a need for more efficient insurances, with better coverages. POs were impressed about how little
Stable’s insurance would cost. Stable’s tool can be much cheaper since it uses indexes to
calculate premiums, not having the need to have as many people and as many bureaucratic paperwork as other insurance companies.
37
4.3. Farmers Questionnaires
After learning that POs would be interested in acquiring a product as described, the second goal was to speak to fruits and vegetables farmers themselves to learn if individual farmers would also be interested in an insurance as described, both those who belong to the POs and those who do not.
To do so, it was decided that a questionnaire (attached in annex 3) would be applied to a sample of fifty farmers, during the National Agriculture Fair, in Santarém, in June 2018. The questionnaire had two different purposes. Firstly, describe farmers’ profile and production, and secondly to understand how a new insurance product as the one developed by Stable could adapt to these farmers.
The first half of the questions regarded farmer’s age, who they sold their crop to, the region of the country where they produced it, the area they use to produce it, whether they belonged to a PO or not, whether they felt like there was volatility in their income or not, what created that volatility and if they used any risk management strategy.
The second half of the questions asked farmers what is more important for them to protect, crop or price, and asked them how much they though would be fair to pay for such a product.
4.3.1. Sample Description
The results obtained from these fifty questionnaires are analysed in the following pages. The age scatter of the respondents can be seen below in Figure 3. More than half the farmers questioned - 52% - were under fifty years old and 12% were over seventy. More than a quarter, 26%, had between thirty and forty years old.
6% 26% 20% 18% 18% 12% Respondents ages <30 <40 <50 <60 <70 ≥70
39 As it can be seen in Figure 4 most farmers sold their productions to distribution - 36%, a significant part of farmers - 32% - sold their production fresh and directly to the consumer, almost a quarter - 24% - of the surveyed farmers sold their production to a PO and a small percentage of them, only 8%, exported their production.
Concerning the geographical origin of the respondents, the majority are from Ribatejo, with 30%, followed by Estremadura, with 18%, and Trás-os-Montes, with 12%. The remaining farmers were from Alentejo, Beira Alta, Beira Baixa, Beira Litoral and Douro Litoral. All these locations had an equal percentage of around 8% of the total fifty farmers questioned. Even though the majority of farmers are from Ribatejo and Estremadura, which makes sense since the fair is located in Ribatejo, in the centre region of Portugal, the questionnaires cover eight different regions of the country (Figure 5).
8% 8% 8% 8% 8% 18% 30% 12% Respondents regions
Alentejo Beira Alta Beira Baixa Beira Litoral Douro Litoral Estremadura Ribatejo Trás-os-Montes e Alto Douro
Figure 5- Geographical origin of the farmer 36% 8% 32% 24% Respondants Production Destination
Distribution Export Fresh market PO
41 Figure 6 below regards the size of the farm. The most common size of farm - 50% - is under twenty-five hectares, 80% of the inquired had areas under one hundred hectares and the remaining 20% had areas bigger than one hundred hectares.
Concerning farmers belonging to a PO, analysing Figure 7 below, we can see that despite having very similar percentages, there is a difference of four percent. A little over half of the farmers, 52%, didn’t belong to POs and a little under fifty percent, 48% did belong to a PO.
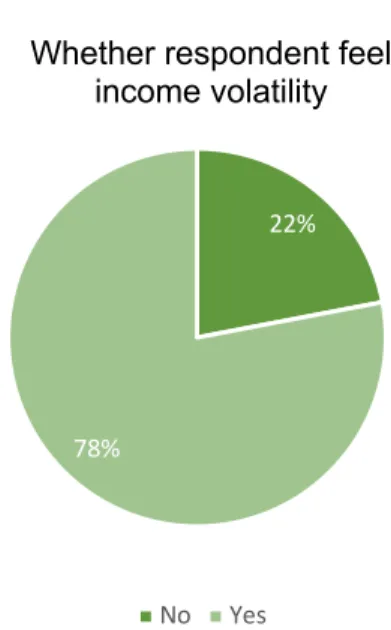
In Figure 8 it can be seen that almost 80% of the farmers inquired felt there was significant variability of their income over the years and only 22% said there were no major changes in income. 26% 24% 20% 10% 20% Respondants areas
<10ha <25ha <50ha <100ha ≥100ha
Figure 6- Inquired farmers farm size
52% 48%
Respondents belonging to a PO
N Y
Figure 7- Percentage of inquired farmers belonging to a Producers Organization
43 Figure 9 below shows that a majority (56%) of the inquired farmers believed their income volatility was due to productivity variability and intense climatic events that could not be prevented. Almost a quarter (24%) of them saw variation of the market price they sold at as the greatest cause for income volatility. And 20% of farmers considered the variation of fixed cost to be the biggest cause of variability in their profit.
When it concerns risk management strategies used by farmers it is showed in Figure 10 below that more than half of the inquiries - 52% - don’t use any strategy to manage their risk. Of those
22%
78%
Whether respondent feel income volatility
No Yes
Figure 8- Farmers opinion on whether their income suffer from volatility
20%
56% 24%
Biggest cause for volatility
Fixed costs Productivity Sell price
45 who do, the most largely used insurance, with 36%, followed by sales contract and crop or location variation, with equal percentages.
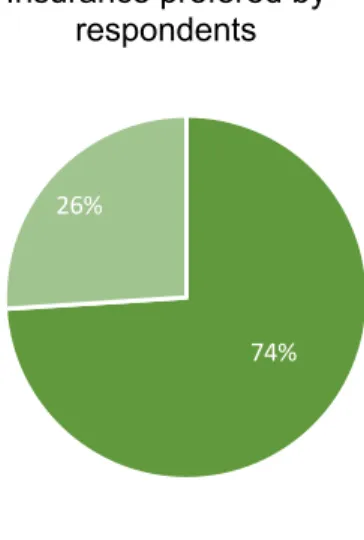
Inquired farmers were asked what kind of insurance they believed would be more useful to their particular circumstances. Below in Figure 11 we can see that 74% of them chose crop insurance and only 26% said they would prefer to cover their market price.
6%
36% 52%
6%
Respondants Risk Management Strategies
Crop/Location variarion Insurance None Sales Contract
Figure 10- Risk management strategies used by inquired
74% 26%
Insurance prefered by respondents
Crop Price
Figure 11- Respondents insurance preference, crop or price
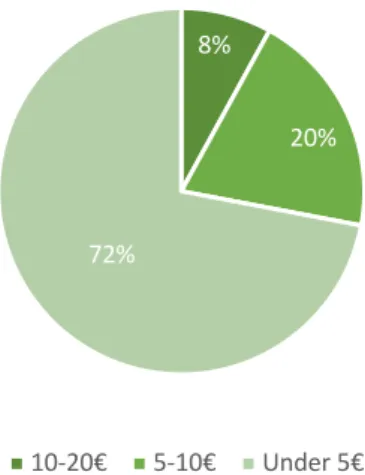
47 Figure 12 below refers to how much inquired farmers were willing to pay as a premium for a crop insurance that would cover one hundred kilos or a price insurance that would cover one hundred euros. We can see that 72% of farmers would pay under five euros, 20% would pay five to ten euros and 8% would pay ten to twenty euros. It is interesting to learn that even though farmers are interested in learning about new risk management tools they are not willing to spend a lot of money. Almost three quarters of all the inquired farmers have an upper limit for risk management strategies of five euros.
4.3.2. Statistical analysis
After analysing the dispersion of answers for every question, the next step was to cross reference answers and see what we could learn from that.
4.3.2.1. Cross referencing which risk management strategies were used by farmers
First, we cross referenced the risk management strategies used by respondents in percentage of the number of farmers that belong to a PO and the ones that do not. After carefully analysing Figure 13 below we can conclude that over 60% of farmers that do not belong to a PO do not use any strategy to manage risk. When comparing this value with the value of farmers that are members of POs there are over 40% of farmers that do not use risk management tools. The value is still high but is considerably lower.Of the respondents that belong to POs over 40% of them use insurance to manage their risk, whilst farmers that do not belong to POs have a lower percentage of use of insurance to manage risk, a little under 30%.
8%
20%
72%
Premium respondents would pay
10-20€ 5-10€ Under 5€
Figure 12- How much inquired farmers were willing to pay for insurance premium
49 The remaining risk management measures used by the farmers showed smaller discrepancies than the ones mentioned above, despite the fact that inquired farmers that do not belong to POs use less crop or location variation to control their risk. Besides, farmers that do not belong to POs use more often sales contracts to minimize their risk than farmers that are part of a PO. After analysing the graph below, there seems to be a tendency: farmers that belong to POs use insurance more often than farmers that do not belong to POs. This may be because some POs use collective insurance for all their associates. This way having or not insurance would not be a decision made by the farmer but made by the PO.
Since risk management strategies used by farmers and whether or not they belong to a PO seem to be dependable variables, an independence test (calculations in annex 4) was performed to verify if they were statistically significant. However, the null hypothesis was not rejected, so we cannot discard the possibility of independence between the two answers.
In Figure 14 we cross referenced risk management strategies used by inquired farmers versus farmed area sizes. We can conclude that most farmers still do not use any risk management strategy. Despite that, from those farmers who do, insurance is the most commonly used tool followed by sales contracts and crop or location variation.
Of the farmers with areas under twenty-five hectares, around 70% did not use any tool to manage their risk, around 25% used insurance and only about 8% of farmers with areas under ten hectares used sales contracts.
Inquired farmers with areas between twenty-five and fifty hectares were the ones that had a higher percentage of use of insurance. Moreover, farmers with areas within this range are the ones that use more risk management measures of all the inquired. Respondents that farmed areas bigger than fifty hectares had higher percentages of insurance use when compared with
0 10 20 30 40 50 60 70
Don't belong Belong
Risk management strategies vs Belong to a PO
Crop/Location variarion Insurance None Sales Contract
%