ACCESS TO HIGHER EDUCATION IN PORTUGAL: AN ANALYSIS
OF THE IMPACT OF THE ECONOMIC CRISIS IN THE PATTERNS
OF REGIONAL DISTRIBUITION OF CANDIDATES
Fábio José Marques Oliveira
Dissertation
Master in Economics
Supervised by
Pedro Nuno de Freitas Lopes Teixeira, PhD
ii
Abstract
Higher education has experienced important transformations, namely a rapid and significant expansion and a growing diversification in the types of institutions and programs. This was sustained by high individual and social expectations regarding the future benefits of higher education. Due to the massification of higher education and the significant increase in the number of graduates, questions emerged about the sustainability of those benefits and the potential differentiation among graduates. Thus, the choice of institution and the field of studies have been regarded as increasingly important, as they may be associated with future differences in the returns to higher education. It is therefore relevant to study the mobility patterns of candidates to the extent of which they concentrate in certain regions, institutions, and programs.
This dissertation analyses these issues by looking at the Portuguese experience. In particular, we aim to answer two main and related questions: (i) how can the student’s geo-graphical flows be characterized regarding regional, disciplinary, and programmatic distribu-tion? (ii) to what extent has the economic and social crisis between 2010 and 2014 affected these patterns?
The methodology used to address these questions is mainly quantitative, using na-tional and comprehensive data to study the origin and destination of students and their choices regarding institution, field of study, and degree. We will analyse it for the period of 2008 to 2018 in order to identify possible trends and the potential impact of the crisis on them.
Geographic flows show clear trends in regional preferences. Most students prefer to stay in their region or in another geographically close. Despite the significant decline in de-mand for higher education, between 2010 and 2014, the supply remained very stable. The financial crisis enhanced the trends already observed with regard to geographical proximity and the weight that this factor has in the decision taken by the student. Nevertheless, there are relevant differences across higher education sectors, institutions and fields of study.
JEL codes:
I20; I21; I23; I26; J24iii
Resumo
O ensino superior tem passado por transformações importantes, nomeadamente uma expansão rápida e significativa e uma diversificação crescente nos tipos de instituições e programas. Isso foi amplamente sustentado por altas expectativas individuais e sociais em relação aos benefícios futuros do ensino superior. Devido à massificação do ensino superior e ao aumento significativo de diplomados, surgiram questões sobre a sustentabilidade desses benefícios e o potencial de diferenciação entre os diplomados. Assim, a escolha da instituição e do curso tem sido vista como cada vez mais importante, dado que aquelas podem estar associadas a diferenças futuras nos benefícios. É, por isso, relevante estudar os padrões de mobilidade dos candidatos para entender a distribuição por regiões, instituições e cursos.
Esta dissertação analisa estas questões a partir do contexto português. Em particular, pretende responder a duas questões relacionadas: (i) como podem ser caracterizados os flu-xos geográficos dos estudantes em relação à sua distribuição regional, disciplinar e instituci-onal? (ii) em que medida a crise entre 2010 e 2014 afetou esses padrões?
A metodologia utilizada para abordar essas questões é principalmente quantitativa, utilizando dados nacionais e abrangentes para verificar a origem e o destino dos estudantes e as suas escolhas quanto à instituição, área de estudo e região. Será analisado o período de 2008 a 2018 a fim de identificar tendências e o potencial impacto da crise nessas tendências. Os fluxos geográficos mostram tendências claras em termos de proximidade, sendo que a maioria dos estudantes de uma região prefere permanecer na mesma ou noutra região geograficamente próxima. Apesar do acentuado declínio da procura pelo ensino superior, entre 2010 e 2014, a oferta permaneceu bastante estável. A crise evidenciou as tendências já observadas no que se refere à proximidade geográfica e o peso que este fator tem na decisão do aluno. Por outro lado, há diferenças claras quando analisamos o comportamento da pro-cura por subsetor do ensino superior, instituição e área científica.
Códigos JEL:
I20; I21; I23; I26; J24Palavras-chave:
Educação Superior; Escolha do estudante; Retornos; Fluxos geográfi-cos; Criseiv
Contents Index
Abstract ... ii Resumo ... iii Contents Index ... iv Table Index ... vFigure Index ... viii
Chapter 1. Introduction ... 1
Chapter 2. An economic analysis of the demand of Higher Education... 4
2.1 Growth and Mass Higher Education – economic factors and motivations ... 4
2.2. The growing complexities of choice in Higher Education ... 6
2.3. Demand for Higher Education in Portugal ... 6
2.3.1. Access to Higher Education in Portugal – recent trends ... 8
2.3.2. Growing competition among graduates and institutions ... 9
Chapter 3. Methodology ... 11
Chapter 4. Empirical analysis ... 14
4.1 Data overview ... 14
4.2 Demand Index ... 15
4.2.1. Competition across regions ... 16
4.2.2. Attractiveness by institutions ... 18
4.2.3. Attractiveness by fields of study ... 21
4.3 Dispersion index ... 33
4.4 Attractiveness vs dispersion ... 35
4.5 Regional Retention index ... 37
4.6 Mobility index ... 40 Chapter 5. Conclusion ... 42 Bibliographic References ... 45 Annexes ... 48 1. Demand index ... 48 2. Dispersion index ... 56 3. Mobility index ... 66
v
Table Index
Table 1 - Demand index by region (2008 - 2018) ... 16
Table 2 - Demand index by polytechnic institution (2008 - 2018) ... 19
Table 3 - Demand index by university (2008 - 2018) ... 20
Table 4 - Demand index by 1-digit CNAEF (2008 - 2018) ... 21
Table 5 - Demand index by 2 and 3 digit CNAEF - Education (2008 - 2018) ... 22
Table 6 - Demand index by 2 and 3 digit CNAEF - Arts and Humanities (2008 - 2018) .... 23
Table 7 - Demand index by 2 and 3 digit CNAEF - Social Sciences, Commerce and Law (2008 - 2018)... 24
Table 8 - Demand index by 2 and 3 digit CNAEF - Sciences, Mathematic and Informatics (2008 - 2018)... 26
Table 9 - Demand index by 2 and 3 digit CNAEF - Engineering, Manufacturing and Construction (2008 - 2018) ... 27
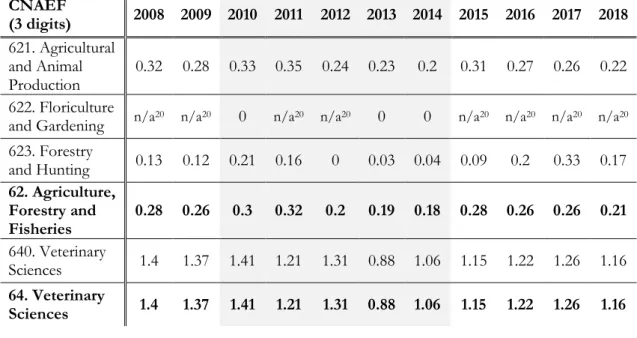
Table 10- Demand index by 2 and 3 digit CNAEF - Agriculture (2008 - 2018) ... 29
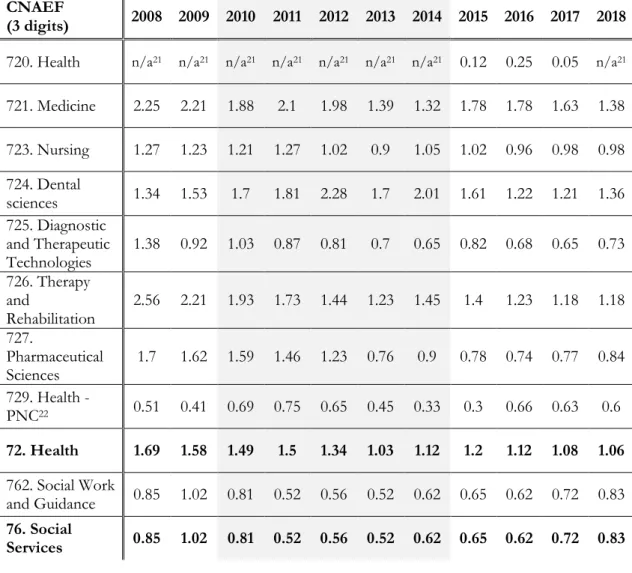
Table 11 - Demand index by 2 and 3 digit CNAEF - Health and Social Protection (2008 - 2018) ... 30
Table 12 - Demand index by 2 and 3 digit CNAEF - Services (2008 - 2018) ... 31
Table 13 – Comparison between demand and dispersion index by 3-digit CNAEF ... 36
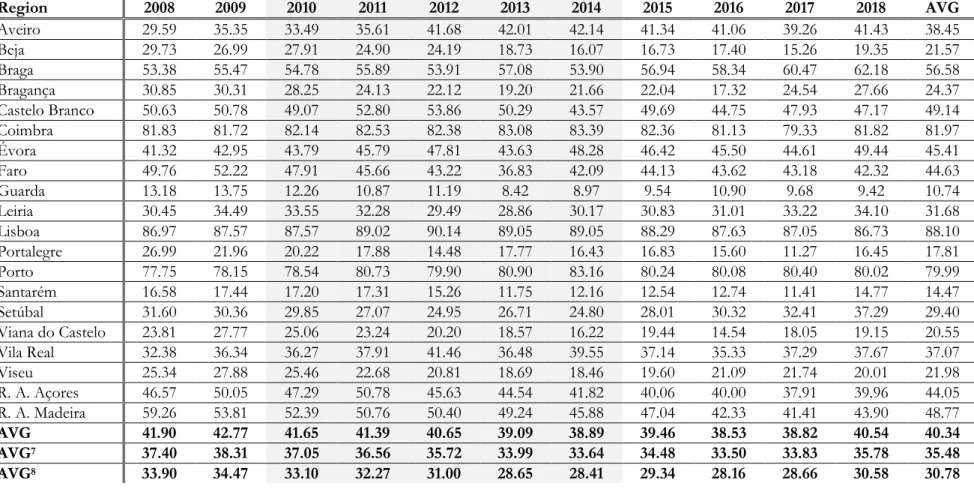
Table 14 - Potential regional retention index (2008 - 2018) ... 38
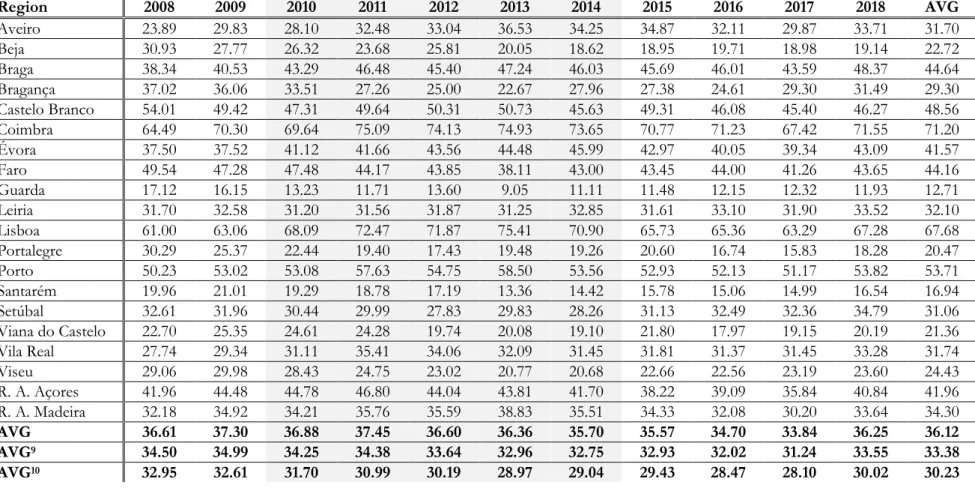
Table 15 - Effective regional retention index (2008 - 2018) ... 39
Table 16 - Demand index by 2 and 3 digit CNAEF - Education (2008 - 2018) ... 48
Table 17 - Demand index by 2 and 3 digit CNAEF - Arts and Humanities (2008 - 2018) .. 49
Table 18 - Demand index by 2 and 3 digit CNAEF - Social Sciences, Commerce and Law (2008 – 2018) ... 50
Table 19 - Demand index by 2 and 3 digit CNAEF - Sciences, Mathematic and Informatics (2008 - 2018)... 51
Table 20 - Demand index by 2 and 3 digit CNAEF - Engineering, Manufacturing and Construction (2008 - 2018) ... 52
Table 21- Demand index by 2 and 3 digit CNAEF - Agriculture (2008 - 2018) ... 53
Table 22 - Demand index by 2 and 3 digit CNAEF - Health and Social Protection (2008 - 2018) ... 54
vi
Table 24 - Dispersion index by 1-digit CNAEF (2008 - 2018) ... 57
Table 25 - Dispersion index by 2 and 3 digit CNAEF – Education (2008 - 2018) ... 58
Table 26 - Dispersion index by 2 and 3 digit CNAEF - Arts and Humanities (2008 - 2018) ... 59
Table 27 – Dispersion index by 2 and 3 digit CNAEF - Social Sciences, Commerce and Law (2008 - 2018) ... 60
Table 28- Dispersion index by 2 and 3 digit CNAEF - Sciences, Mathematic and Informatics (2008 - 2018) ... 61
Table 29 - Dispersion index by 2 and 3 digit CNAEF - Engineering, Manufacturing and Construction (2008 - 2018) ... 62
Table 30 - Dispersion index by 2 and 3 digit CNAEF - Agriculture (2008 - 2018) ... 63
Table 31 - Dispersion index by 2 and 3 digit CNAEF - Health and Social Protection (2008 - 2018) ... 64
Table 32 - Dispersion index by 2 and 3 digit CNAEF - Services (2008 - 2018) ... 65
Table 33 – Mobility index from region x to region y 2008 (%) ... 67
Table 34 - Mobility index from region x to region y 2009 (%) ... 68
Table 35 - Mobility index from region x to region y 2010 (%) ... 69
Table 36 - Mobility index from region x to region y 2011 (%) ... 70
Table 37 - Mobility index from region x to region y 2012 (%) ... 71
Table 38 - Mobility index from region x to region y 2013 (%) ... 72
Table 39 - Mobility index from region x to region y 2014 (%) ... 73
Table 40 - Mobility index from region x to region y 2015 (%) ... 74
Table 41 - Mobility index from region x to region y 2016 (%) ... 75
Table 42 - Mobility index from region x to region y 2017 (%) ... 76
Table 43 - Mobility index from region x to region y 2018 (%) ... 77
Table 44 - Mobility index of region y coming from region x 2008 (%) ... 78
Table 45 - Mobility index of region y coming from region x 2009 (%) ... 79
Table 46 - Mobility index of region y coming from region x 2010 (%) ... 80
Table 47 - Mobility index of region y coming from region x 2011 (%) ... 81
Table 48 - Mobility index of region y coming from region x 2012 (%) ... 82
Table 49 - Mobility index of region y coming from region x 2013 (%) ... 83
Table 50 - Mobility index of region y coming from region x 2014 (%) ... 84
vii Table 52 - Mobility index of region y coming from region x 2016 (%) ... 86 Table 53 - Mobility index of region y coming from region x 2017 (%) ... 87 Table 54 - Mobility index of region y coming from region x 2018 (%) ... 88
viii
Figure Index
1
Chapter 1. Introduction
Access to higher education has become a very important issue from an economic perspective. The choice of the field of study and institution causes major geographical flows that translate into changes in the region's economy and its respective attractiveness. Many decades of research has stressed that education can be considered as an investment in human capital (Mincer, 1993; Becker, 1994). Just like any other investment, costs and future benefits need to be assessed, mainly because employers tend to associate an individual’s productivity to his or her level of education (Psacharopoulos & Patrinos, 2010). A person with a higher educational level has a greater knowledge, thus making him or her more productive. The skills gained from it make an individual more valuable to an organization, resulting in better remuneration. Additionally, education shows significant impacts on accessibility to the labour market and in several other areas of the individual's personal life, namely in health and savings (Grossman, 2006).
The decision to enrol in higher education, including the choice of institution and field of study, seems to be shaped by a variety of factors. As higher education become a very important choice in individual life, it is important to analyse which factors may influence that decision and their relative importance. The decision is influenced by several factors. Among these, mention should be made to a so-called investment rationale, reflecting all factors that may be considered long-term costs and benefits or sacrificing immediate benefits for future returns, such as financial aid, employability, access to the labour market and lifetime income (Furukawa, 2011; Krezel & Krezel, 2017). On the other hand, from an economic perspective, there are also so-called consumption factors, that include everything that can be considered as immediate benefits and present decisions, such as quality of life and pleasure of studying (Blaug, 1970; Becker, 1994; Krezel & Krezel, 2017). Furthermore, there are also social factors, encompassing all social opinions and pressures, such as the influence from family, friends and socio-economic background (Moogan & Baron, 2003; Tavares, Tavares, Justino & Amaral, 2008). This decision has become increasingly complicated and demanding over time.
The choices and benefits associated to higher education in Portugal have been subject to significant attention in recent decades. Since 1995, there has been a smaller wage gap between young graduates and those who do not choose to pursue higher education (Centeno
2 & Novo, 2014). Even so, there is a difference in earnings resulting from the specialization of the graduates' skills. Machado & Mata (2001) also corroborate these findings because even though education is valued in any job, the returns are significantly higher when individuals have a college degree.
During the past few decades, the Portuguese system has suffered several changes, due to the impact of the Bologna process and the economic crisis, leading to a potential shift in the relative importance of the factors described above in the decision-making process. Studies have shown that employability is the most important factor in attending higher education, and education is seen as a better way of access to the labour market (Tavares & Cardoso, 2013). In addition, the opinion of family and friends is more important than the information provided by the institutions or the ministry (Tavares et al., 2008). The decision to study is not the only decision to be made. Due to the massification of higher education, the decision of where to apply becomes increasingly relevant.
In the Portuguese case, there is a great competition in the search for specific regions and institutions, which causes regional concentration of students. This leads us to believe that demand patterns might be directly influenced by the concentration of population, wealth and accessibility to better economic opportunities in the job market. There has been a great effort, by some institutions to specialize in some field of study, in order to attract students that might be interested, therefore being themselves more attractive (Guerreiro, Queiroz & Teixeira, 2019). This might be a good strategy to keep the institutions relevant and to keep attracting students in the future.
The recent recession period in Portugal (2010-2014) has had major social and economic impacts on resident households. Thus, it is important to analyse how this may have affected demand of higher education. One of the aspects that can be considered is how the recession may have affected the level of regional distribution of demand, either by making the choice to move to another city more attractive (due to reduced employment opportunities concentrated in a few larger cities) or less attractive (the costs of moving to another city may have become strong deterrent). Therefore, this dissertation aims to analyse the changes in the regional distribution of demand to higher education, by looking at the periods before, during, and after the economic crisis. Thus, we will analyse the flows of the candidates to understand if candidates were willing to stay in the same region or willing to move to a different one, and to analyse possible differences by region, field of study and type of institution. This will be carried out through a series of indicators.
3 In a first instance, it will be discussed the decision to study in higher education. With the expansion in access and in the number of graduates, aspects such as the choice of institution, field of study and program have become increasingly relevant differentiating factors and their relevance will be ascertained subsequently. Then, the analysis will focus on the Portuguese case, namely by presenting its higher education system, the main trends observed and possible explanations for those developments. This will be followed, in Chapter 3, by the presentation of the methodology, justifying its adequacy and relevance for the research questions being considered. Chapter 4 discusses the main results of our empirical analysis and in Chapter 5 it will be presented the main conclusions of this study and their relevance, as well as the limitations and possible future research aiming at developing the analysis.
4
Chapter 2. An economic analysis of the demand of Higher Education
In this chapter, we will analyse, in the first instance, the massification of higher edu-cation, trying to extrapolate what the literature points out as the main motivations for the growing demand for higher education. Subsequently, the analysis of the choice’s complexity when entering a higher education program will become relevant. As the objective of this dissertation is to study the Portuguese case, we will pay special attention to its main charac-teristics, namely its organization, the main observable trends in the demand and supply and the growing competition between students and between institutions.
2.1 Growth and Mass Higher Education – economic factors and motivations Cantwell, Marginson & Smolentseya (2018) point out that the higher education system has been changing worldwide, especially in the last twenty years. This is due to three major trends: growth and massification of the system, growing competition between institutions and globalization. Massification comes across as the most universal one and the main reason of this change.
Several studies pointed out that attending college, as an alternative to the other options, has a direct impact on an individual’s position in the labour market, namely regarding employability and earnings (Mincer, 1993; Becker, 1994; Thomas, 2000; Thomas, 2003). Even though those aspects are the most quoted throughout the economics’ literature, they are not the only significant impacts of attending higher education. Grossman (2006) pointed out that higher education impacts on consumption patterns, savings and health and even self-esteem. Lochner (2011) also concluded that a higher level of education directly affects the criminal index, mortality and political participation. Furthermore, college graduates are less likely to experience periods of unemployment when compared to high school graduates (Thomas, 2000). These factors affect the higher education system on a global scale. Peracchi (2006) shows that the tendency towards higher income resulting from higher levels of education is present in several countries, such as Spain, Italy, Germany, Portugal and many others, suggesting a global trend. Psacharopoulos & Patrinos (2010) have extensively documented this, updating several previous works that have shown, over the years, a significant return to those with higher levels of education.
5 education sector has some similarities with other economic sectors. However, this sector also presents specific features. Thus, we have to develop some efforts to understand multiple factors that could affect students when they are deciding whether to apply for a higher education degree and where to apply (Krezel & Krezel, 2017). Higher education institutions are seen as service providers, expecting students to be aware of what awaits them in terms of education and its return. However, they are not, in general, seeking to maximize profits like firms. Thus, their behaviour is different and more complex. On the other hand, some argue that students can be seen as consumers, within this context, since they try to maximize the benefits that they could get from higher education, behaving like rational consumers (Tavares & Cardoso, 2013). Nevertheless, their behaviour is also moulded by a variety of factors.
Regarding the choice of where and what to study, research shows there are multiple factors that can influence a student. We will discuss them as investment, consumption and social factors. As far as investment factors go, reflecting all that may be considered long-term costs and benefits or related to sacrificing immediate benefits for future returns, there is an idea that the availability of financial aid is one of the most important (Furukawa, 2011; Krezel & Krezel, 2017). Factors as family income and overall costs tend to have a big impact, as well (Krezel & Krezel, 2017). Career enhancements and employment opportunities are also quoted throughout the literature (Moogan & Baron, 2003; Briggs, 2006). Besides this, consumption factors, reflecting immediate benefits and present decisions, assume a significant weight, as several studies have been conducted to try to understand their impact on the application process. Students tend to take into account the distance between their residence and the institute they intend to apply (Moogan & Baron, 2003; Krezel & Krezel, 2017), as it is expected that this factor will have a direct impact on the overall costs and many students have a harder time being away from their family. Institution’s reputation and their marketing strategies come as important factors within the literature, although the former has a higher relevance than the latter (Moogan & Baron, 2003; Furukawa, 2011). The program of study, entry requirements and academic support facilities are also quoted (Moogan & Baron, 2003; Briggs, 2006). Finally, there are also social factors, encompassing all social opinions and pressures, which influence the decision. The literature points to parental education background as one of the most important: it seems that a student, whose parents have a higher education degree, is ten times more likely to access the higher education system (Tavares et al., 2008). Vocation and the opinion of friends, family or teachers are other
6 relevant factors (Moogan & Baron, 2003; Tavares et al., 2008).
2.2. The growing complexities of choice in Higher Education
Increasingly, due to the development of higher education and the exponential increase of graduates, the question is not only the decision to study but also in which institution, field of study and degree. This new decision spectrum has been increasingly studied to understand the advantages associated with these variables. The possibility of job prospects varies substantially depending on the field of study and educational institution, as well as their income (Thomas, 2000; Thomas, 2003; Varga, 2006).
Recent research has also pointed out that there is significant evidence of diversity among graduates.Graduates prior to the massification of Higher Education obtain better returns than current graduates do. This trend started since higher education ceased to be an elitist system and became accessible to a wider range of students (Peracchi, 2006). Jobs for recent graduates that are easy to learn may be the cause of frustration at the choice of higher education, because it makes them easily replaceable and with lower returns (Figueiredo, Biscaia, Rocha & Teixeira, 2017).
Studies conducted in the USA, Canada, and in the U.K. show that there is a difference in return depending on the field of study, pointing to the fields of law, business and engineering as the most profitable (Livanos & Pouliakas, 2011). There is a significant tendency to choose institutions and fields of study considered prestigious in order to obtain an easier access to the labour market (Livanos & Pouliakas, 2011). Facing major obstacles, such as changing demand patterns and increasing competitiveness, the focus of institutions has become the attraction of good resources and students with high potential (Simões & Soares, 2010).
At the time of application, the student makes a choice of program, institution and region, resulting in a trade-off between demand and supply in higher education, becoming relevant the analysis of these variables within the education system.
2.3. Demand for Higher Education in Portugal
Over the years, a phenomenon of massification of higher education has occurred. In the 1980s and 1990s, it appeared to be too elitist, allowing only families with greater financial capacity to bear these costs (Figueiredo, Teixeira & Rubery, 2013). Over time, this
7 trend was reversed and allowed other social classes to access higher education.
Regarding the Portuguese case, the education system is still something that deserves special attention because even though it is merging with the European average, there is still a long way to go. For example, in 2017 research shows that 47.95% of the active population has attended only elementary school or less than that. In comparison, only 18.94% of the European Union, under the same conditions, had the same level of education. With regard to higher education, the difference is not that significant but it is still worrying. In 2007, 24.02% of the Portuguese active population had a higher education degree in contrast to 33.98% of the European Union (Guerreiro et al., 2019).
Access to higher education in Portugal is below the European average. This is due to a much more recent massification of the higher education system, as the country has had historically low levels of qualification (Neave & Amaral, 2012). There has been a major transformation on the Portuguese scene in the last ten years and despite considerable improvements, only Germany and Italy remain with a lower penetration rate, meaning that a smaller percentage of students in these countries pursue a higher education degree (Guerreiro et al., 2019). Due to the fact that Portugal has had historically lower levels of education, when compared to most of the other European countries, the expansion of higher education became a political goal. The Portuguese economic backwardness was partly explained by the delay of the Portuguese education, which led to believe that if there was a boost in it, there would be a great progress within the economy and it would result in social benefits, equality of opportunities and social mobility (Figueiredo et al., 2013).
Figueiredo et al. (2013) show that there has been an increasingly difference between graduates, since the expansion of the Portuguese higher education system. The graduates wage premium1 has been decreasing for younger graduates. However, older graduates do not
seem to be affected as much, due to the massification of the higher education system. This suggests that younger graduates cannot perfectly replace the older ones or that the younger are replacing older and less qualified workers. Centeno & Novo (2014) also corroborate these statements, as well as Machado & Mata (2011), who indicate that, since 1995, the wage gap between graduates and non-graduates has been narrowing. However, they demonstrate that it remains profitable for a student to obtain a higher education degree, achieving, in general, a higher income when they enter the labour market. This evidence is explained by the growing specialization of work that comes from higher levels of education.
8 Even though income is higher for graduates, the market presents a high heterogeneity regarding the type of qualification. The field of study is indicated as a variable that conditions the employment opportunities obtained by the graduate and determines the degree of substitutability. Failure with regard to employment in the field of study can dictate dissatisfaction with the choices made in education. The reputation of the institution in which they graduated is also important in the analysis of satisfaction (Figueiredo et al., 2017).
2.3.1. Access to Higher Education in Portugal – recent trends
Higher education in Portugal is mainly composed of universities and polytechnics, both public and private. There is a network of institutions that offer several higher education degrees in each of the Portuguese regions. The greater concentration of the population in coastal and urban regions has forced policymakers to develop strategies to ensure the sustainability of institutions (Lourenço & Sá, 2019). However, the Portuguese system is based on a policy of limiting the number of students who can enter higher education to prevent students from being directed to the fields of greatest interest, leaving the others with lower occupancy rates (numerus clausus), implying an obvious restriction on the supply side (Sá, Dias & Tavares, 2013). This was introduced after the democratic revolution, due to significant social pressures for expansion, and it was never reversed, due to a variety of reasons. In recent years, it has been regarded as a factor to limit the expansion of most attractive regions, institutions, and programs.
The number of vacancies available in the public sector has increased considerably since the 1990s, especially in public polytechnic institutes, surpassing, in 2010, the number of vacancies provided by the private universities (Sá et al., 2013). In the 2017/2018 school year, public university education had around 28000 vacancies for new students, being the largest subsystem. In the same school year, to confirm the trend mentioned above, polytechnic public education had approximately 22000 new places available while private university education had only 14544 (DGEEC & DSEE, 2018). There is an effort by the government to diversify the program offerings in order to allow a better fitting between supply and demand. There are universities, which, due to their location, offer a more diverse range of higher education programs, mainly because there is no competition nearby and it is easier to capture local demand (Portela, Areal, Sá, Alexandre, Cerejeira, Carvalho & Rodrigues, 2008). When supply is compared between subsystems, it becomes obvious that
9 public education has gained share while the private sector has lost (Sá et al., 2013; DGEEC & DSEE, 2018). In 2018, there was an effort to decentralize higher education, reducing the vacancies available for the Lisboa and Porto regions by 5%.
To access these institutions, a student can do it through different ways. The first and more common one is through the National Access Contest, which is done annually and organized in three different phases, making it possible for a student to apply to his/her leading choices more than once. The special track for international students is another possibility, only applying to international students that do not belong to the European Union and that are holders of a recognized high school degree. This contest takes place once a year and it allows the student to apply to any private or public institute with the exception of military and police higher education institutes. There is also the Special Contest for students over 23 years old, allowing students over 23 to apply provided they are not holders of another college degree. Apart from these, there are several other ways to access, such as: Superior Professional Technicians (TeSP); Holders of Technological Specialization Diploma; Holders of Other University Degree and Special Contest for Access to Medicine by Graduates. Due to its representativeness (about 70% of the new students), the first one is the most common object of study and it is also our focus. Accordingly, a student can choose six pairs of programs/ institutions at the time of application, by order of preference, thus placed by the grade point average (average of the marks obtained during high school plus national examinations) (Portela et al., 2008; DGES, 2020).
2.3.2. Growing competition among graduates and institutions
The demand for higher education in Portugal has been changing over the past decades due to demographic changes and adjustments made to the entry conditions (Portela et al., 2008). Studies conducted in the Portuguese context a few years ago show that there were evident trends in the destination institutions that students choose first, namely those universities located in the main metropolitan regions of Lisboa and Porto. In addition, there is a strong trend towards the preference of universities over polytechnics (Sá & Tavares, 2018). In 2011, the University of Madeira and the University of Açores had a higher concentration of demand, possibly due to their geographical isolation (Sá et al., 2013). Several factors may explain this trend, but the importance of the institution's attractiveness and location is emphasized. We can also speculate that the fact that these institutions are in
10 the large metropolitan areas of the country is a relevant factor in the process of decision-making. This trend constitutes a pattern of consumption in the higher education sector, which may be influenced by the concentration of population and wealth and the expectation that access to the labour market will be easier and employability (easiness in finding employment in the field of study) will be enhanced in those areas. If the analysis is made by educational rather than geographical area, there are also some differences. These may be related as well to employability’s concerns, but can also be influenced by other factors such as social visibility and prestige.
The economic recession had an impact on demand because it conditioned household income, namely, those that already had significant financial restrictions. That is why it is important to see the extent to which it affected demand behaviour and priorities in terms of institution, field of study and region. Hence, the main objective is to understand the geographic flows and their changes before, during and after this period. Geographic flows tend to be similar over the years and intensify in two major areas: Porto and Lisboa (Sá et al., 2013). It is important to analyse this trend, as this preference can be explained by factors such as city’s attractiveness or institution’s reputation.
To understand the impacts felt by the crisis, it is necessary to ascertain how the system behaved before and how it has evolved afterwards. The economic crisis, although developing earlier, began during the year of 2010. Prior to that, the higher education system in Portugal underwent a restructuration caused by the Bologna process. The Bologna process was a reform of higher education aimed at increasing students’ mobility and employability of future graduates, redefining the structures of higher education degrees. According to the Ministry of Science, Technology and Higher Education instructions, the restructuring in question had a deadline in the 2008/2009 school year. Consequently, pre and post Bologna programs coexisted during the 2006/2007 and 2007/2008 school years (Portela, Sá, Alexandre & Cardoso, 2009). For this reason, we will only consider data from 2008 onwards for our analysis, so that this process does not influence them.
Therefore, it is relevant to analyse the impacts of the economic crisis in the patterns of regional distribution of candidates. Consequently, we will try to characterize students' geographic flows according to regions, institutions and fields of study so we can later infer the impacts of the crisis on them.
11
Chapter 3. Methodology
The methodology to be adopted throughout this dissertation will be quantitative. It allows for greater clarity and reliability of data, helping to make the observable trends clear over the years and drawing some inferences from that behaviour. For the analysis, we will do it over the suggested period (2008 – 2018) in order to be able to speculate trends, calculating several indicators assessing levels of dispersion/concentration and higher/lower demand. This will make possible to understand which regions, institutions or CNAEF areas have undergone the greatest variations in terms of demand over time, which have become more irrelevant and which have gained relevance. Additionally, we will be able to observe the concentration of CNAEF areas in the national territory and crosscheck the information with that previously mentioned. A region or an institution with low demand will have greater difficulty in retaining local students, speculatively. A field with high concentration of demand suggests that students privilege some institutions/programs instead of spreading among many options available. We will also analyse the capacity of regions, institutions, and programs to attract candidate from other regions, as well as the loss of candidates to other regions by each region. We will assess the extent of which there have been changes in those patterns over time, namely to understand how these trends were affected by the economic crisis and how the system subsequently adapted.
Alternatively, we could follow a strategy of questionnaires or interviews to try to understand, from the student's perspective, the geographical trends and the motivations underlying those choices. This method would be more viable if the issue was geographically focused on an institution or even a region, mainly because these methods are better for contextualizing and getting details about specific situations. Given that the objective is to carry out an analysis at national level and over a period of 10 years, it is unrealistic to follow this approach. We would need a large number of interviews to attain a representative picture and, moreover, it would be problematic to question individuals about their choices after several years they have taken place.
To obtain this data we decided to calculate several indicators: demand index, dispersion index, regional retention index and mobility matrix. The first one mentioned, the demand index, will allow us to obtain information on the attractiveness of the object in question. It is calculated by dividing the number of students who chose a given region as their first option by the total number of places available for that region during the year under
12 review. If the demand index is greater than one, we can conclude that the demand in that region is greater than the supply. Vice versa also occurs, if the demand index is less than one it means that the region is not attractive enough to cover all available places. We will also calculate this index by educational establishment and by CNAEF area (1, 2 and 3 digits). For the same reasons, we will be able to assess attractiveness according to the institutions and fields of study. The main advantage in using this index is that it is adaptable to different aspects (region, institution and field of study) and the results are very straightforward to be interpreted. Additionally, it is an index that, being adjusted to the size of each region, institution or field of study, allows easy comparison between them. This index was based on the national study carried out by Guerreiro et al. (2019), about access to higher education in Portugal.
Additionally, we will have the opportunity to calculate the dispersion index. This index will allow us to analyse the concentration of CNAEF areas (1, 2 and 3 digits) in the national panorama, indicating whether they are very dispersed across the country or not. In order to extrapolate this information, we will add, by CNAEF area, the number of vacancies allocated to a field of study in specifics regions divided by the number of vacancies allocated to that field at the national level, squared. For three-digit CNAEF areas, if the demand index is less than 0.2, we will assume that there is a high dispersion of the field. Higher than 0.8 will be considered a high concentration and in the range between 0.2 and 0.8, we will consider an average concentration. The main advantage in using this index is to allow comparison between the different fields of study and easy interpretation. This index was also inspired by the work developed by Guerreiro et al. (2019).
Another index that will be used for our analysis will be the regional retention index. This indicator will allow us to understand the region's retention capacity at the expense of the rest. It will be divided into two parts to incorporate the effects of the numerus clausus system. The first part will reflect the potential regional retention index, encompassing the number of students from a certain region that places that same region as the first option, divided by the total number of students from the same region. This will allow us to extrapolate what the region's retention would be without the numerus clausus system. However, and since access is conditioned by this implemented system, we will also calculate the effective regional retention rate, which will allow us to obtain the same information but based on the candidates actually placed. The main advantage in using this index is to be adjusted to the size of each region, allowing great comparability between them. The obtainable results
13 are clear and not misleading. This index was also inspired by the work developed by Guerreiro et al. (2019).
In order to understand how geographic flows have changed over time, we will also calculate a mobility index by region. In the first instance, we will calculate in order to understand which regions students from each region travel to. This will be calculated by dividing the number of students in one region that is placed in another region by the number of students from the first one. Later, we will do the reverse analysis: where students placed in certain region come from. This will be calculated by dividing the number of students in a given region that is placed in another region and the total number of students placed in the second one. The main advantage in using this index is to be adjusted to the size of each region, allowing great comparability between them. The obtainable results are clear and not misleading. This index was also inspired by the work developed by Guerreiro et al. (2019).
The General Directorate of Higher Education (DGES - MCTES) has provided the data that will be used. The database used include major details characterizing the students’ preferences and characteristics such as: the students’ home region at the time of application and the region, institution, and degree chosen by them. These data are collected annually supported by the information provided during the national access contest. Only the first access phase will be used due to the representativeness it demonstrates. It would be interesting to carry out this analysis using other types of data such as the school of origin, the student's performance during secondary school or even the socio-economic origin. However, we do not hold this data in our possession, and cannot carry out the analysis considering it.
This methodology will allow a great observation of the general trends during the period, taking into account the veracity and reliability of the data. Despite this, it will not be possible to consider the remaining factors that are taken into account in the students' decision.
14
Chapter 4. Empirical analysis
In this chapter, the different indicators mentioned above will be presented and ana-lysed. We will start with a general presentation of the evolution of vacancies in higher edu-cation over time to demonstrate the rigidity of the offer versus the number of candidates. Subsequently, the demand index in relation to regions, institutions and areas will be ad-dressed, in that order. The term regions will be used for convenience throughout this docu-ment to replace the more formal denomination of districts (distritos). Moreover, this will allow to include the autonomous regions of Açores and Madeira. An analysis of the disper-sion index will be presented so that we can later justify the relevance of the demand index, crossing the two of them. Finally, the regional retention index and the mobility matrix will be presented to help us define trends in geographic flows.
4.1 Data overview
Over the years, higher education in Portugal has undergone significant changes with regard to its structure. Consequently, the number of candidates and vacancies available became good indicators of the evolution of higher education between the years 2008 and 2018.
Figure 1 shows the variation in the number of candidates in this period in comparison with the rigidity of the offer provided by Higher Education in Portugal. According to it, the general trend points to an initial sharp drop in the number of candidates, during the crisis period. This number only begins to return to the levels prior to the crisis period from 2014, coinciding with the end of this period. The number of vacancies reflects, in some way, this sharp decline, despite not being able to follow the variations felt by the number of candidates in the most precise way. The impacts were felt in such a way that only in 2017 (3 years after what is estimated to have been the end of the crisis) we can verify values similar to 2009. In 2018, the number of candidates declines again.
15 Figure 1 - Evolution of the number of vacancies and candidates (2008 – 2018)
Source: DGES
4.2 Demand Index
The demand index allows us to know the most attractive regions, institutions or CNAEF areas for future students of higher education by creating a ratio between the number of candidates for that region and the number of places available. Therefore, we will analyse this index for the different regions of the country, institutions and CNAEF areas. For the latter, the CNAEF areas will be broken down to 1, 2 and 3 digits, subsequently.
It is important to understand the attractiveness of all these components over time because it will allow extrapolating trends and conclusions about the impact of the crisis on them. We will be able to define, based on these indicators, the most regular choices of students and those that have not yet been able to stand out as attractive. A demand index higher than 1 implies, in itself, a number of candidates higher than the number of available places and the opposite, a low attractiveness. This will be the first index to be presented because it will give us a general idea of the various components over time and will then allow us to combine it with the others in order to obtain evident trends.
38000 40000 42000 44000 46000 48000 50000 52000 54000 56000 2008 2009 2010 2011 2012 2013 2014 2015 2016 2017 2018 Vacancies Candidates
16 4.2.1. Competition across regions
In this section, we will analyse the demand index by region, which will allow us to define which regions are most attractive and which were most impacted by the crisis experi-enced during the period from 2010 to 2014.
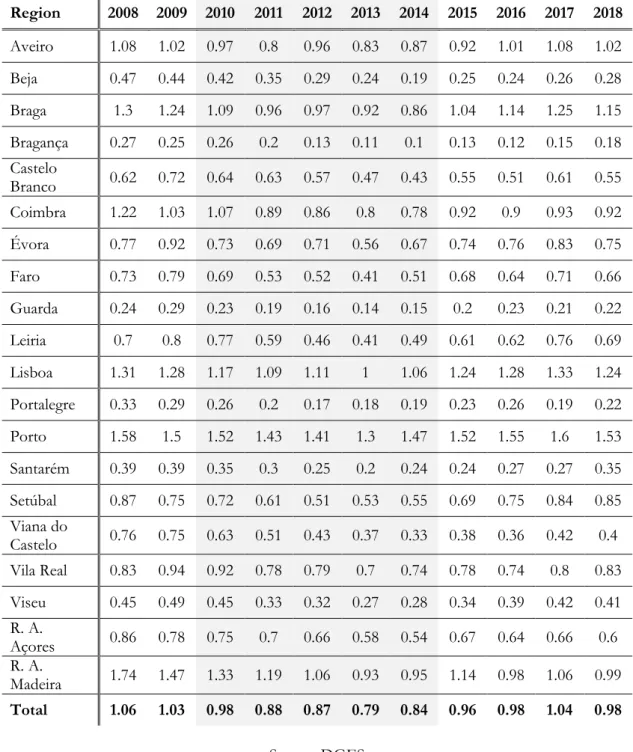
Table 1 - Demand index by region (2008 - 2018)
Region 2008 2009 2010 2011 2012 2013 2014 2015 2016 2017 2018 Aveiro 1.08 1.02 0.97 0.8 0.96 0.83 0.87 0.92 1.01 1.08 1.02 Beja 0.47 0.44 0.42 0.35 0.29 0.24 0.19 0.25 0.24 0.26 0.28 Braga 1.3 1.24 1.09 0.96 0.97 0.92 0.86 1.04 1.14 1.25 1.15 Bragança 0.27 0.25 0.26 0.2 0.13 0.11 0.1 0.13 0.12 0.15 0.18 Castelo Branco 0.62 0.72 0.64 0.63 0.57 0.47 0.43 0.55 0.51 0.61 0.55 Coimbra 1.22 1.03 1.07 0.89 0.86 0.8 0.78 0.92 0.9 0.93 0.92 Évora 0.77 0.92 0.73 0.69 0.71 0.56 0.67 0.74 0.76 0.83 0.75 Faro 0.73 0.79 0.69 0.53 0.52 0.41 0.51 0.68 0.64 0.71 0.66 Guarda 0.24 0.29 0.23 0.19 0.16 0.14 0.15 0.2 0.23 0.21 0.22 Leiria 0.7 0.8 0.77 0.59 0.46 0.41 0.49 0.61 0.62 0.76 0.69 Lisboa 1.31 1.28 1.17 1.09 1.11 1 1.06 1.24 1.28 1.33 1.24 Portalegre 0.33 0.29 0.26 0.2 0.17 0.18 0.19 0.23 0.26 0.19 0.22 Porto 1.58 1.5 1.52 1.43 1.41 1.3 1.47 1.52 1.55 1.6 1.53 Santarém 0.39 0.39 0.35 0.3 0.25 0.2 0.24 0.24 0.27 0.27 0.35 Setúbal 0.87 0.75 0.72 0.61 0.51 0.53 0.55 0.69 0.75 0.84 0.85 Viana do Castelo 0.76 0.75 0.63 0.51 0.43 0.37 0.33 0.38 0.36 0.42 0.4 Vila Real 0.83 0.94 0.92 0.78 0.79 0.7 0.74 0.78 0.74 0.8 0.83 Viseu 0.45 0.49 0.45 0.33 0.32 0.27 0.28 0.34 0.39 0.42 0.41 R. A. Açores 0.86 0.78 0.75 0.7 0.66 0.58 0.54 0.67 0.64 0.66 0.6 R. A. Madeira 1.74 1.47 1.33 1.19 1.06 0.93 0.95 1.14 0.98 1.06 0.99 Total 1.06 1.03 0.98 0.88 0.87 0.79 0.84 0.96 0.98 1.04 0.98 Source: DGES
17 According to Table 1, it is evident that the regions of Porto and Lisboa are the most sought after, therefore having higher demand indexes, constantly greater than or equal to one, demonstrating the polarization of the Portuguese educational system. The region of Madeira also presents high rates, mostly explained by its geographic component and the restrictions on mobility that result from this. The regions of Aveiro and Braga, that have a high demand, are of great importance, being higher, in several years, than the number of vacancies offered by the institutions present in them. We should also underline the region of Coimbra, which being the birthplace of Portuguese higher education, maintains a higher attractiveness compared to several other regions of the country. The regions of Bragança, Guarda and Portalegre have a stable low demand, explained by the diversity of programs offered without any of them standing out nationally for their prestige
We can also point out that the years in which this ratio was lower coincide with the years of the crisis period, corroborating what we had already pointed out in the previous section. When we analyse in more detail, several aspects should be underlined. The year of 2013 was the one in which the overall demand was lower, coinciding with the year in which the crisis was felt at a more intense level, followed by 2014 when there was an upward trend. 2010 is the first year of the crisis and the first year in which the number of candidates in the country is less than the number of vacancies available. If before the crisis there were several regions with an index higher than 1, at the height of the crisis, only two regions, Porto and Lisboa, managed to maintain demand higher than the supply. The regions that stand out most negatively over the period are Guarda, Bragança and Portalegre, which during the crisis period had an attractiveness lower than one fifth of the available places.
18 4.2.2. Attractiveness by institutions
In this section, we will analyse the demand index by institution, which will allow us to define which institutions are most attractive and which were most impacted by the crisis experienced during the period from 2010 to 2014. This analysis is done taking into account the demand and supply by institution. We will divide it into two different tables to differen-tiate universities from polytechnics, because historically the attractiveness is quite different.
As we can see from tables 2 and 3, in general, universities are more attractive than polytechnic institutes. The search for more general and less specialized fields is notorious, although there is an approximation when the numerus clausus system comes into action. Within the polytechnic sector, the Porto and Lisboa institutes stand out as the most attractive for students, alongside some specialized schools (Nursing Schools of Coimbra, Lisboa, and Porto, and Higher Institute for Tourism and Hospitality Studies of Estoril). On the contrary, some polytechnic institutions have a very low demand index, which is in line with the indi-cated regions with the lowest demand. With regard to universities, the universities of Porto, Lisboa, Madeira and ISCTE are the most attractive. In contrast, the universities of Beira Interior, Évora and Algarve are the least sought after by students.
Comparing the demand index by region and institution, we can see that the same conclusions are observable. Porto, Lisboa, Madeira, Coimbra, Aveiro e Braga are the most attractive regions and the same is true of the respective institutions in those regions. The same is true for the less attractive regions (Guarda, Bragança and Portalegre) whose institu-tions are less attractive, as well. This trend can also be explained by the fact that the most attractive regions have universities, in contrast to the less attractive regions with polytechnics, as mentioned above. However, the polytechnic institute of Tomar is also less attractive than the others are. This institute belongs to the Santarém region, which compensates for this lack of attractiveness as a region with the Santarém polytechnic institute.
According to tables 2 and 3, the theory that the economic crisis, felt between 2010 and 2014 in Portugal, had direct impacts on access to higher education is corroborated. In general, both universities and polytechnics declined in their attractiveness during this period. The only polytechnic institutes that managed to maintain demand above supply throughout the analysis period were Nursing Schools of Lisboa and Porto, and the Institute for Tourism and Hospitality Studies. When analysing the same for universities, we noticed that the only ones that sustained demand higher than supply were ISCTE, the University of Porto and Nova University of Lisboa. All of these are located in the regions of Porto and Lisboa.
19 Table 2 - Demand index by polytechnic institution (2008 - 2018)
Source: DGES
2 Estoril Higher Institute for Tourism and Hotel Studies
Educational Institution 2008 2009 2010 2011 2012 2013 2014 2015 2016 2017 2018 National Mari-time College 0.51 0.57 0.4 0.45 0.45 0.49 0.54 0.67 0.61 0.68 0.53 Nursing School of Coimbra 2.38 1.17 1.1 0.9 0.83 0.84 0.85 0.95 0.86 0.76 0.79 Nursing School of Lisboa 1.28 1.75 1.64 1.91 1.49 1.34 1.66 1.57 1.35 1.44 1.49 Nursing School of Porto 1.68 1.31 1.45 1.53 1.37 1.31 1.81 1.67 1.48 1.45 1.48 ESHTE2 1.73 1.82 1.47 1.36 1.43 1.28 1.09 1.51 1.37 1.48 1.25 Polytechnic of Guarda 0.24 0.29 0.23 0.19 0.16 0.14 0.15 0.2 0.23 0.21 0.22 Polytechnic of Beja 0.47 0.44 0.42 0.35 0.29 0.24 0.19 0.25 0.24 0.26 0.28 Polytechnic of Bragança 0.27 0.25 0.26 0.2 0.13 0.11 0.1 0.13 0.12 0.15 0.18 Polytechnic of Castelo Branco 0.51 0.51 0.45 0.42 0.39 0.27 0.25 0.33 0.29 0.32 0.34 Polytechnic of Coimbra 0.9 0.84 0.83 0.7 0.56 0.54 0.57 0.64 0.69 0.78 0.72 Polytechnic of Leiria 0.7 0.8 0.77 0.59 0.46 0.41 0.49 0.61 0.62 0.76 0.69 Polytechnic of Lisboa 1.2 1.08 0.96 0.85 0.81 0.68 0.77 0.86 0.9 1.08 1.01 Polytechnic of Portalegre 0.33 0.29 0.26 0.2 0.17 0.18 0.19 0.23 0.26 0.19 0.22 Polytechnic of Santarém 0.45 0.46 0.42 0.37 0.29 0.24 0.26 0.27 0.32 0.34 0.4 Polytechnic of Setúbal 0.66 0.59 0.56 0.47 0.34 0.32 0.33 0.38 0.41 0.54 0.58 Polytechnic of Tomar 0.31 0.29 0.25 0.18 0.17 0.14 0.18 0.19 0.18 0.15 0.25 Polytechnic of Viana do Castelo 0.76 0.75 0.63 0.51 0.43 0.37 0.33 0.38 0.36 0.42 0.4 Polytechnic of Viseu 0.45 0.49 0.45 0.33 0.32 0.27 0.28 0.34 0.39 0.42 0.41 Polytechnic of
Cávado and Ave 0.77 0.85 0.8 0.44 0.66 0.5 0.61 0.69 0.73 1 0.96
Polytechnic of
Porto 1.29 1.12 1.1 0.99 0.91 0.82 0.92 1.01 1.14 1.37 1.28
20 Table 3 - Demand index by university (2008 - 2018)
Educational Institution 2008 2009 2010 2011 2012 2013 2014 2015 2016 2017 2018 ISCTE 1.59 1.52 1.47 1.31 1.31 1.3 1.5 1.71 1.73 1.73 1.52 University of Beira Interior 0.7 0.89 0.79 0.8 0.71 0.61 0.56 0.71 0.67 0.82 0.7 University of Madeira 1.74 1.47 1.33 1.19 1.06 0.93 0.95 1.14 0.98 1.06 0.99 University of Aveiro 1.08 1.02 0.97 0.8 0.96 0.83 0.87 0.92 1.01 1.08 1.02 University of Coimbra 1.28 1.13 1.23 1.01 1.04 0.95 0.91 1.08 1.04 1.04 1.07 University of Évora 0.77 0.92 0.73 0.69 0.71 0.56 0.67 0.74 0.76 0.83 0.75 University of Lisboa 1.11 1.14 1.03 0.97 1 0.85 0.95 1.14 1.19 1.22 1.19 University of Trás-os-Montes e Alto Douro 0.83 0.94 0.92 0.78 0.79 0.7 0.74 0.78 0.74 0.8 0.83 University of Algarve 0.73 0.79 0.69 0.53 0.52 0.41 0.51 0.68 0.64 0.71 0.66 University of Minho 1.43 1.36 1.17 1.12 1.04 1.02 0.92 1.13 1.24 1.31 1.19 University of Porto 1.77 1.79 1.82 1.75 1.79 1.66 1.83 1.88 1.86 1.78 1.72 University of Açores 0.86 0.78 0.75 0.7 0.66 0.58 0.54 0.67 0.64 0.66 0.6 Nova University of Lisboa 1.56 1.47 1.4 1.26 1.29 1.24 1.29 1.55 1.65 1.61 1.49 Technical University of Lisboa 1.27 1.18 1.09 1.05 1.09 0.98 n/a
3 n/a3 n/a3 n/a3 n/a3
Total 1.26 1.24 1.18 1.08 1.1 1 1.05 1.2 1.22 1.24 1.17
Source: DGES
21 4.2.3. Attractiveness by fields of study
In this section, we will analyse the demand index by CNAEF area, which will allow us to define which fields are most attractive and which were most impacted by the crisis experienced during the period from 2010 to 2014. We will analyse the attractiveness by un-folding the CNAEF areas to 1, 2 and 3 digits. The demand index in the 3-digit CNAEF areas will be shown only for those fields that have, on average, during the period under anal-ysis, more than 500 vacancies per year (the remaining fields, even if mentioned in this chap-ter, should be consulted in Annex 1).
Table 4 - Demand index by 1-digit CNAEF4 (2008 - 2018)
CNAEF (1 digit) 2008 2009 2010 2011 2012 2013 2014 2015 2016 2017 2018 1. Education 0.68 0.82 0.91 0.66 0.67 0.56 0.55 0.65 0.69 0.7 0.43 2. Arts and Humanities 0.78 0.89 0.94 0.87 0.85 0.79 0.86 0.89 0.96 1.01 0.98 3. Social Sciences, Commerce, Law 1.17 1.17 1.09 0.91 0.98 0.95 1.07 1.2 1.22 1.3 1.23 4. Sciences, Mathematic and Informatics 0.64 0.62 0.65 0.66 0.75 0.7 0.64 0.75 0.83 0.9 0.88 5. Engineering, Manufacturing, Construction 1.01 0.87 0.77 0.69 0.61 0.58 0.55 0.75 0.81 0.88 0.78 6. Agriculture 0.72 0.72 0.73 0.68 0.64 0.45 0.5 0.61 0.63 0.65 0.58 7. Health and Social Protec-tion 1.55 1.49 1.37 1.34 1.21 0.96 1.05 1.12 1.05 1.03 1.03 8. Services 0.97 0.9 0.87 0.74 0.8 0.72 0.81 0.88 0.83 0.95 0.87 9. Unknown or
Unspecified n/a5 n/a5 n/a5 1.73 0.76 0.87 0.62 1.25 1.42 1.42 1.28
Total 1.06 1.03 0.98 0.88 0.87 0.79 0.84 0.96 0.98 1.04 0.98
Source: DGES
4 National Classification of Education and Training Areas 5 There are no programs allocated to this area.
22 The demand index by 1-digit CNAEF allows us to know the fields most sought by students, taking into account its vacancies. “Health and Social Protection” is the most attrac-tive field, in general, for students followed by “Social Sciences, Commerce and Law”. It is not surprising that health-related programs stand out as the most sought after, taking into account the general knowledge of Portuguese higher education. On the other hand, “Edu-cation” and “Agriculture” stand out as the least attractive.
There is also a decrease in demand in all fields, in general, during the period of crisis. However, it is important to point out that despite the crisis between 2010 and 2014, the field “Sciences, Mathematic and Informatics” shows a very constant demand, which suggests that more technological fields may have gained relevance due to market needs and advances in technology.
Besides this aggregated view of all the fields and their respective demand, it is im-portant to understand in detail what kind of variations have occurred over time. In order to do so, the demand indexes were calculated, disaggregating in two and three digits CNAEF areas, when it was relevant. The tables covering all 3-digit CNAEF areas can be found in Annex 1.
Table 5 - Demand index by 2 and 3 digit CNAEF - Education (2008 - 2018)
CNAEF (3 digits) 2008 2009 2010 2011 2012 2013 2014 2015 2016 2017 2018 144. Basic Edu-cation Teacher Training (1st and 2nd cycles) 0.79 0.96 1.05 0.76 0.8 0.64 0.66 0.78 0.82 0.82 0.31 14. Training of Teachers/ Trainers and Educational Sciences 0.68 0.82 0.91 0.66 0.67 0.56 0.55 0.65 0.69 0.7 0.43 Source: DGES
With regard to the "Education" field, when we look at 3-digit CNAEFs, we can see that, before and during the crisis period, "Basic Education Teacher Training" was highly sought after by students, when compared to the rest. However, this trend changes in the
23 post-crisis period and "Training of Teachers and Technological Trainers" becomes much more attractive, mainly due to the low weight of vacancies in the national supply, which makes sense in view of the growing specialization of the active population and the need for suitable trainers. "Education Sciences" remains quite constant even during the crisis period, suffering only a slight decline, even though the supply is not significant.
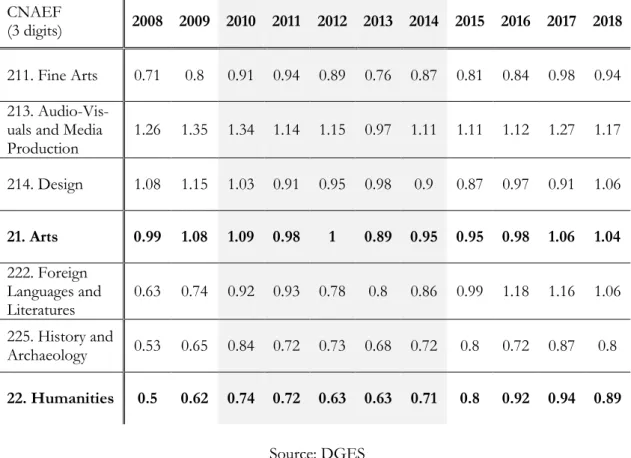
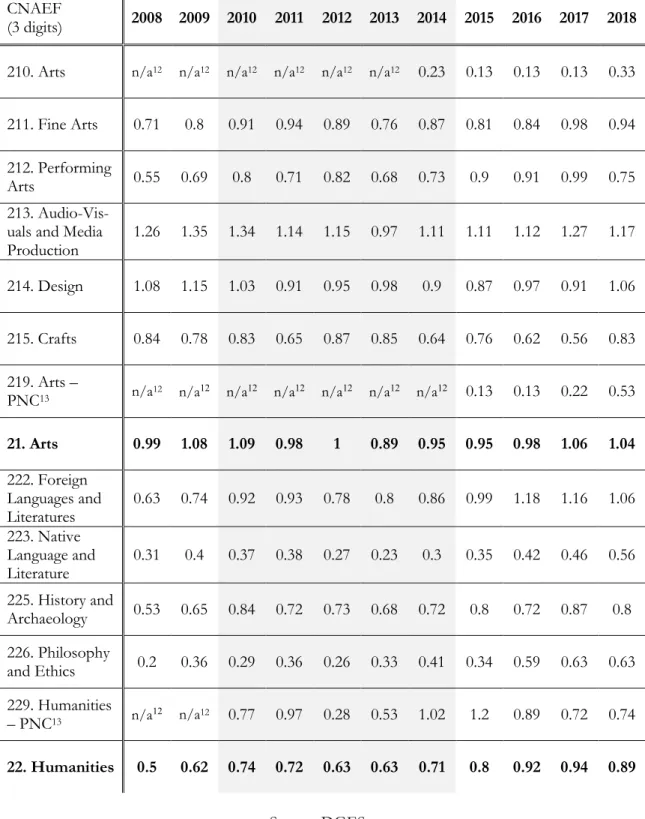
Table 6 - Demand index by 2 and 3 digit CNAEF - Arts and Humanities (2008 - 2018)
CNAEF
(3 digits) 2008 2009 2010 2011 2012 2013 2014 2015 2016 2017 2018
211. Fine Arts 0.71 0.8 0.91 0.94 0.89 0.76 0.87 0.81 0.84 0.98 0.94
213. Audio-Vis-uals and Media
Production 1.26 1.35 1.34 1.14 1.15 0.97 1.11 1.11 1.12 1.27 1.17 214. Design 1.08 1.15 1.03 0.91 0.95 0.98 0.9 0.87 0.97 0.91 1.06 21. Arts 0.99 1.08 1.09 0.98 1 0.89 0.95 0.95 0.98 1.06 1.04 222. Foreign Languages and Literatures 0.63 0.74 0.92 0.93 0.78 0.8 0.86 0.99 1.18 1.16 1.06 225. History and Archaeology 0.53 0.65 0.84 0.72 0.73 0.68 0.72 0.8 0.72 0.87 0.8 22. Humanities 0.5 0.62 0.74 0.72 0.63 0.63 0.71 0.8 0.92 0.94 0.89 Source: DGES
Regarding the "Arts and Humanities" field, it is broken down into two sub-fields: “Arts” and “Humanities”. It is clear that the first is more sought after than the second one. Although, once again, 2013 presents itself as the year in which the demand was less expres-sive, it is important to note that the "Humanities" field maintains, even in that year, values higher than 2008 and 2009 and presents a strong post-crisis growth. The field of "Audio-visual and media production" clearly stands out within “Arts” as the most sought after by students, even with high supply. This may be explained by the growing need to use technol-ogy in the most recent professions and the growing use of internet and social networks for
24 business development. The field of “Performing Arts” and “Crafts” show a much lower demand, despite the low supply in the Portuguese context.
The broad field of “Humanities” was shown before that it was least attractive to students. This can be partly explained by the low demand for “Native Language and Litera-ture” and “Philosophy and Ethics”, despite the low supply of these fields. These two fields attract few students possibly due to the lack of jobs available to work on after graduation. Throughout this dissertation, it has been stressed out, several times, that one of the reasons for students to pursue higher education is the possibility of entering the job market. The fact is that jobs in philosophy or related to the Portuguese language are not that often and there is not a high demand for them, on the market. On the other hand, “Foreign Languages and Literatures” presents itself as the most on-demand field to study on, within “Humanities”, despite the high supply within the field. There has been a growing concern about learning and mastering foreign languages because it can boost the ability to work abroad.
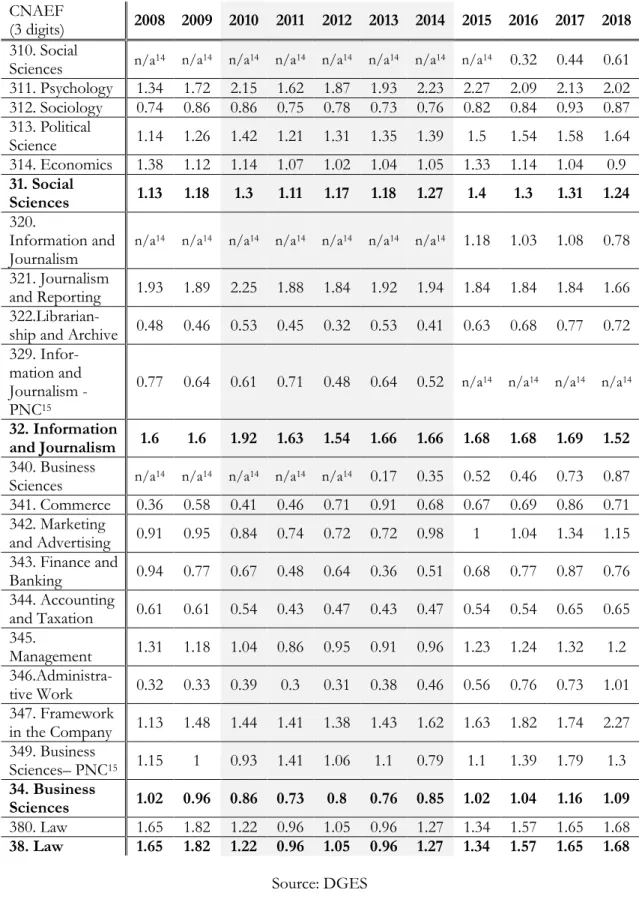
Table 7 - Demand index by 2 and 3 digit CNAEF - Social Sciences, Commerce and Law (2008 - 2018) CNAEF (3 digits) 2008 2009 2010 2011 2012 2013 2014 2015 2016 2017 2018 311. Psychology 1.34 1.72 2.15 1.62 1.87 1.93 2.23 2.27 2.09 2.13 2.02 312. Sociology 0.74 0.86 0.86 0.75 0.78 0.73 0.76 0.82 0.84 0.93 0.87 313. Political Science 1.14 1.26 1.42 1.21 1.31 1.35 1.39 1.5 1.54 1.58 1.64 314. Economics 1.38 1.12 1.14 1.07 1.02 1.04 1.05 1.33 1.14 1.04 0.9 31. Social Sciences 1.13 1.18 1.3 1.11 1.17 1.18 1.27 1.4 1.3 1.31 1.24 321. Journalism and Reporting 1.93 1.89 2.25 1.88 1.84 1.92 1.94 1.84 1.84 1.84 1.66 32. Information and Journalism 1.6 1.6 1.92 1.63 1.54 1.66 1.66 1.68 1.68 1.69 1.52 342. Marketing and Advertising 0.91 0.95 0.84 0.74 0.72 0.72 0.98 1 1.04 1.34 1.15 344. Accounting and Taxation 0.61 0.61 0.54 0.43 0.47 0.43 0.47 0.54 0.54 0.65 0.65 345. Management 1.31 1.18 1.04 0.86 0.95 0.91 0.96 1.23 1.24 1.32 1.2 34. Business Sciences 1.02 0.96 0.86 0.73 0.8 0.76 0.85 1.02 1.04 1.16 1.09 380. Law 1.65 1.82 1.22 0.96 1.05 0.96 1.27 1.34 1.57 1.65 1.68 38. Law 1.65 1.82 1.22 0.96 1.05 0.96 1.27 1.34 1.57 1.65 1.68 Source: DGES
25 With regard to the "Social Sciences, Commerce and Law" field, it is clear that the sub-field "Business Science" is the least sought after by future students, even with the low supply demonstrated, and the rest have a very expressive demand. Of particular relevance is the demand for the "Information and Journalism" sub-field, which remains constantly and significantly higher than the supply, even during the crisis period, making it one of the least affected. This can be explained by the low vacancies available for this field nationally. It is also important to note that all of these subfields are in high demand when compared to others.
When it comes to "Social sciences", "Psychology" and "Political Science" maintain a high demand, constantly exceeding the verified supply, highlighting the fact that there is a low supply for the first, which explains the high index. "Economics" is also very much in demand, also exceeding supply, with the exception of 2018. Regarding the field related to Sociology, there is less interest on the part of students, which can also be explained by the difficulty in entering the labour market and the high supply.
The field of "Information and Journalism" is very on demand and therefore it is normal for the subfields that are part of it to be equally attractive. However, we can see that "Librarianship and Archive" falls far short from the rest, possibly explained by the techno-logical innovation that allows to partially replacing the need for professionals in this field, despite the low supply shown by it.
"Business Science" is composed of several strands, which in itself justifies the lower demand for the field, in its totality. When we analyse in more detail, we can see that "Admin-istrative Work" is not as attractive as "Management" or "Framework in the Company", which maintain very positive levels, during the period under review. However, while “Management” demonstrates a high demand taking into account its high supply, the others show a very low supply. “Finance and Banking” and "Accounting and Taxation" continue to have a lower demand than the offer provided, although it is expected by the initial degree of specialization they present.
"Law" is also a field in high demand, showing only a decline during the years of crisis, just like the pattern observed so far, but usually maintaining demand in excess of supply, even with high supply.
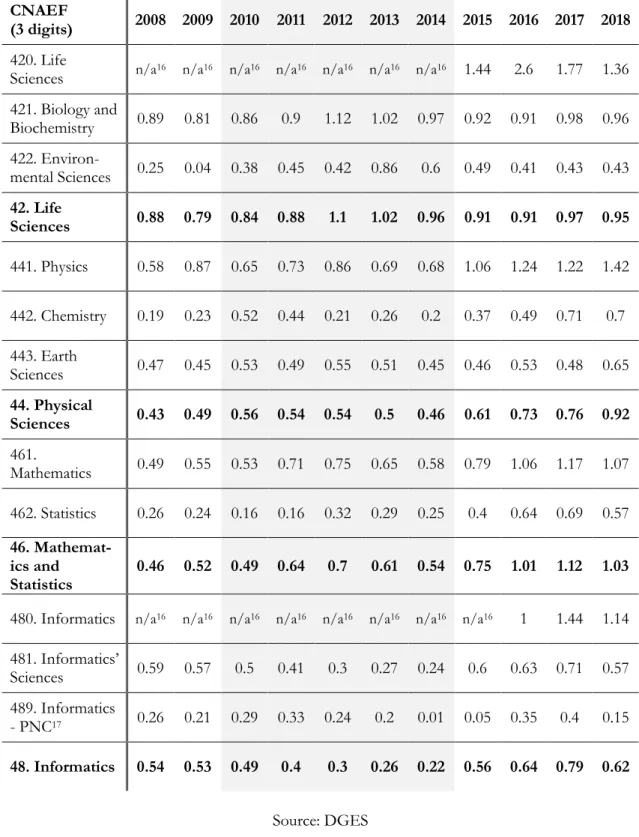
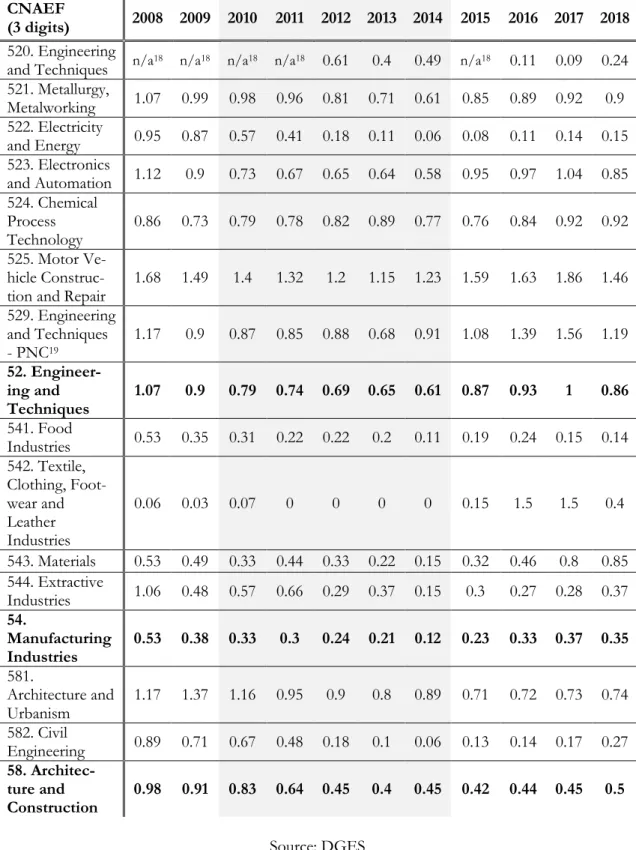
26 Table 8 - Demand index by 2 and 3 digit CNAEF - Sciences, Mathematic and
Infor-matics (2008 - 2018) CNAEF (3 digits) 2008 2009 2010 2011 2012 2013 2014 2015 2016 2017 2018 421. Biology and Biochemistry 0.89 0.81 0.86 0.9 1.12 1.02 0.97 0.92 0.91 0.98 0.96 42. Life Sciences 0.88 0.79 0.84 0.88 1.1 1.02 0.96 0.91 0.91 0.97 0.95 443. Earth Sciences 0.47 0.45 0.53 0.49 0.55 0.51 0.45 0.46 0.53 0.48 0.65 44. Physical Sciences 0.43 0.49 0.56 0.54 0.54 0.5 0.46 0.61 0.73 0.76 0.92 46. Mathemat-ics and Statistics 0.46 0.52 0.49 0.64 0.7 0.61 0.54 0.75 1.01 1.12 1.03 481. Informatics’ Sciences 0.59 0.57 0.5 0.41 0.3 0.27 0.24 0.6 0.63 0.71 0.57 48. Informatics 0.54 0.53 0.49 0.4 0.3 0.26 0.22 0.56 0.64 0.79 0.62 Source: DGES
With regard to the field of "Sciences, Mathematics and Informatics", what stands out immediately is the fact that the demand during the crisis period is higher than the pre-crisis period. This is due to the fact that the sub-fields "Life Sciences", "Physical Sciences" and "Mathematics and Statistics" show a growth during the crisis period, which can be explained by the perception that more specialized and technological programs would be the best op-tion. Oddly enough, the "Informatics" sub-field, which would be perceived as the most tech-nological field among the rest, shows a sharp decline during this period, subsequently show-ing rapid growth in the post-crisis period. However, and perhaps due to their specificity, these sub-fields present a lower demand, in general, than the vacancies available.
With respect to "Sciences, Mathematics and Informatics", we already saw that overall, the demand during the crisis period is higher than the pre-crisis period. However, when we see in more detail we can realize that not every of its components behaved the same way.
About “Life Sciences”, we can see that it happened just the way it was described above and it is the main factor for it to occur. It is evident that in the period of crisis there